
We are influencers and brand affiliates. This post contains affiliate links, most which go to Amazon and are Geo-Affiliate links to nearest Amazon store.
Review of the Alienware Area51 R2
Hey guys, so I am sure in your searches for the perfect gaming PC, you have at one point come across one flavor of an OEM or boutique PC builder and well, this review is about one of them. Now I know there are quite a few different boutiques and OEM builders out there, but this is review is based on one, Alienware.
This review will have full system performance and benchmarks against my own machine. This will include benches from all sorts of benchmarks, games and even power consumption, I know many of you wonder how much power a machine like this will take, and it is so much less than you would think though it is ready to take TON’s if needed.
There is a little story on how I got this machine though and because of it, there was no formal unboxing, but you can check it out here.
It was truly an experience, but I got it just so that I can show you guys those secret’s, and now that it’s out, please feel free to do your own exposition and share it, the people must know.
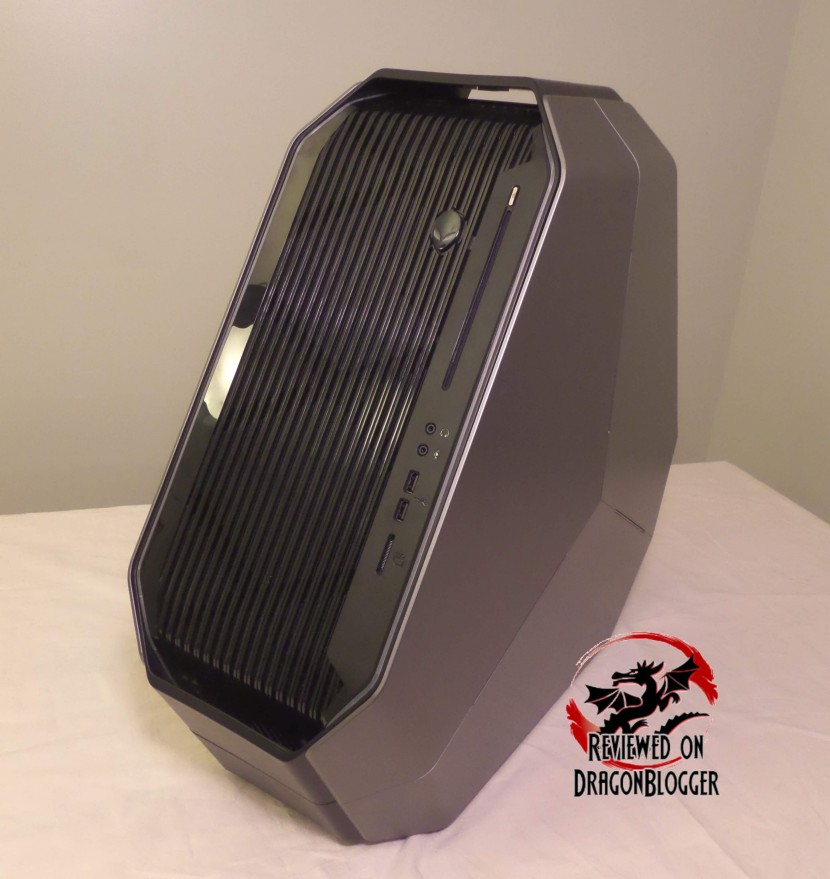
All joking aside, let me provide the specs of this machine.
Specifications
- Case: Custom Alienware Area51
- Lighting: Alienware Custom Case Lighting
- CPU Cooling: Alienware CPU Liquid Cooling
- Motherboard: Custom Alienware 0XJKKD X99
- Processor: Intel Core i7 5930K
- Memory: 16GB 4 x 4GB DDR4 Quad Channel 2133MHz RAM Hynix HMA451U6MFR8N
- Video Card: 3 x NVIDIA GTX980 Backplate Customized (TRI SLI)
- Power Supply: Custom 1500Watt Fully Modular 1500Watt
- Hard Drive: Samsung SM841N 2.5 256MB SSD (OS Drive)
- Hard Drive: Western Digital WD40EZRX-75SPEB0 4TB Green 5400RPM (Data Drive)
- Optical Drive: Matshita Slot Loading DVDRWBD UJ167AM (Blu-Ray Reader/DVD-RW/CD-RW)
- Intel 7260 802.11AC Wireless card with Bluetooth 4.0
- Ethernet: KillerNic Killer e2200 Gigabit Ethernet Controller
- OS: Microsoft Windows 10 Home
- SD Card Reader
Awesome specs, this is a powerful machine, but just how powerful is powerful and what does it mean to you and your games and everyday task, well…. Let’s find out.
I will be comparing the system with my own, here are the specs
- Processor: Intel Core i7 4790K
- CPU Cooling:Arctic Liquid Freezer 240 Liquid Cooling
- Motherboard: Asus Sabertooth Z87
- Memory:Patriot Viper 3 Series DDR3 16GB 1600MHz
- Power Supply: Cooler Master Silent Pro Gold 1200W
- Video Card: Sapphire Radeon NITRO R9 390 8GB GDDR5
- Hard Drive (SSD): Patriot Ignite480GB
- Hard Drive (Mechanical): Hitachi 1TB 7200RPM
- OS: Windows 10 Professional
- Case: Fractal Design Define S Windowed
I know that the configurations are not similar, I personally do not own such a high powered machine, but this comparison is to give you a bit of an example of what you can expect. Maybe also to help you decide what components you want to purchase if you wanted to build your own or potentially justify buying an Alienware if all stacks up well.
The games I will be benching as usual are Metro Last Light, Thief and Tomb Raider and I will be running 3DMark as well. Now these will be mainly running video test, but I will go throughout the entire system so I will be performing more tests, so please continue to check out the review after the initial benchmarks.
By the way, I will also be recording power consumption throughout these test using “P3 International’s” “Kill A Watt”
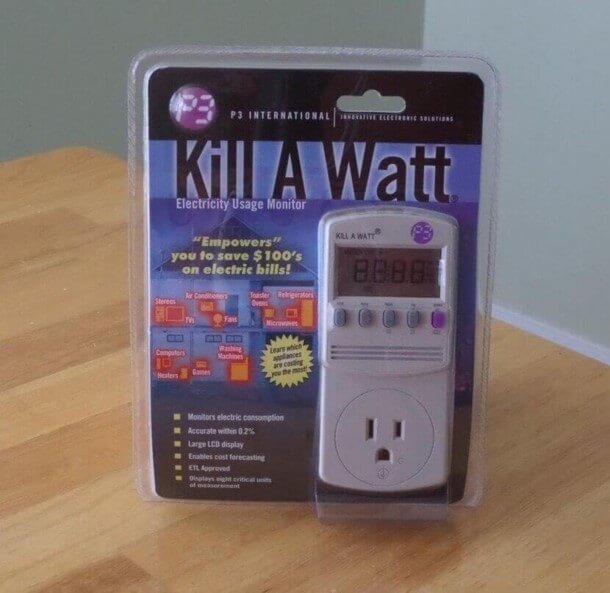
Ok, let’s get to the benches.
[nextpage title=”Gaming Benchmarks”]


Wow, what a huge difference in performance, mind you my custom built machine did pretty well, the Physics score only had a meager 18.47% difference but the Graphics score was more than triple that of the single card, to be expected though and a 101.13% difference and the 3DMark score itself was a little more than double, a 72.52% improvement. Overall, the Alienware destroyed my custom built machine.

For your reference, here is 3DMarks output, you can see here this machine scored 99% better than all other results, very impressive. Here are the scores on my machine. It did 86% better than all other results, not bad at all, it can hold its own but you can see the performance difference is almost night and day.

OK, now it’s time for Metro Last Light, this crushes any machine I have tested it on.

Here are my Metro Last Light presets

I test with these exact settings 2560×1440 and 1920×1080, I will omit the 1280×1024 resolution but those being the only settings changed.

A bit surprising, I did expect more but it seems that this crushes any system I have thrown at it, which leads me to believe this game is poorly optimized, though still I would say a great test. This was a measurement of the resolution of 2560×1440, the only score that really matters here is the average score, which on my machine was on 22 frames per second, playable, but barely and on the Alienware, 63 FPS, that’s a 96.47% improvement. On the flip side though and to be expected, the Alienware did get 9.15% hotter and consumed on average 35.45% more power, it is powering 3 video cards.
Ok, let’s check out 1920×1080

Now that surprise has worn off a bit after the initial score, we see that the Alienware scored 90.72% above my PC. Again though, still the it consumed 29.34% more power. I am sure you all expected it, but I am sure you would have also expected it to consume much more, being that it houses a 1500Watt power supply, looks like it might be overkill.
So aside from the average scores for each, it is worth mentioning the Alienware’s minimum frame rate was that of the custom PC’s average frame rate and more than double its maximum frame rate. Ok, let’s move on to THIEF. Will the performance be there for us all, or will the Custom PC steal the show?

Like in the previous test with Metro Last Light, THIEF and Tomb Raider will have the same configuration changing only the resolution.


Here we can see that the Area51 performance 64.40% better than the custom PC on average, but also consumed 38.75% more power. The temperature on this on was only 8 degrees higher on the Area51, 10.67% higher, some good thermal management I would say, the placement and the 45-degree angle of the cards really does help cool the cards that much better in the Alienware.

The Area51 performed 34.15% above the custom PC and on average consumed about 10.15% more power than the custom PC but spiked as high 45.83% above the custom pc’s power consumption. While it is to be expected, that is a huge spike but again, you would expect with such power it would consume more, the power management on the GTX980’s in this system does a great job. As for thermals, the Area51 was 10 degrees hotter, not bad I would say.
Let’s see which of the 2 steals Laura’s heart in Tomb Raider.


The performance here is obscene, on average the Alienware outperformed the custom built PC by 92.25% though it consumed 58.78% more power on average. The temperature was 10.53% higher on the Alienware as well. Let’s see if the performance holds true on 1920×1080.

Once again the Alienware impresses yet again out pacing the custom PC by 84.65% and taking up 48.04% more power than the custom PC.
I am sure everyone expected the Alienware to come up above the custom built PC’s single card, but the home built PC did hold its own pretty well. So a PC is much more than just a video card, there are more components, so let’s test them out.
[nextpage title=”Drive Benchmarks”]
Let’s continue with SSD performance differences. This will be testing the Patriot Ignite480GB against the Samsung SM841N 2.5 256MB SSD. The tests I will be running are BootRacer which tests how quickly these SSD’s can boot into Windows, then CrystalDiskMark and finally PCMark
So starting up the SSD test’s, we have BootRacer and as I mentioned, this tests how quickly the SSD’s can boot into windows.
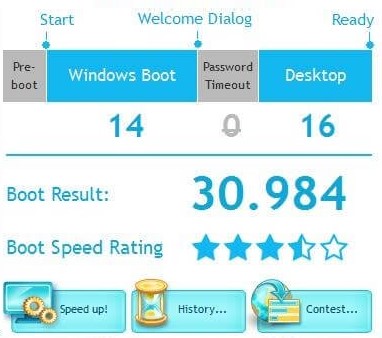
Tied to the Asus Sabertooth Z87 on the custom built PC, the Patriot Ignite 480GB takes a total of 30.98 seconds to boot into windows. 14 seconds to actually boot into windows then 16 seconds to get to a solid desktop, with no other programs loading. The tests can of course be sped up a bit by disabling certain services and programs from loading, but the only services running are what comes with windows and the services programs installed start up. Those programs being drivers only needed for the devices inside of the computer.

On the Alienware, even though the total time was almost 1 second higher, there was more than drivers loading. I can’t say it was bloatware, but it was more than just drivers. Pre-installed on this machine aside from drivers was Drop-box, AlienRespawn (to reinstall Windows), Alienware Command Center (to overclock, change the system lighting and more), Alienware Digital Delivery, Cyberlink Media Suite Essentials (Blu-Ray), Dell Foundation Services, Dell Support AssitantAgent, Dell SupportAssist, Dell System Detect and McAfee though seems to have uninstalled itself when I chose for it not to bother me anymore.
Very light on the bloatware, so they really didn’t install needless junk, all of them have a purpose, but of course you could always uninstall them, they are not necessary and they are not blocked from uninstalling. While the Windows boot time took 4 seconds less on the Alienware, it took 5 seconds longer to actually get to a fully useable and stable desktop.
Ok, boot up times are boring, we all know even some of the slowest SSD’s still boot up pretty quickly, but now let’s see what CrystalDiskMark tells us. Pretty important test, tells you the reads and writes your drive can perform, the faster it reads and writes, the faster everything will run. So let’s check it out.
First one on the bench, is the Patriot Ignite. Impressive speeds, but unless you have something to compare it against they don’t tell you much.
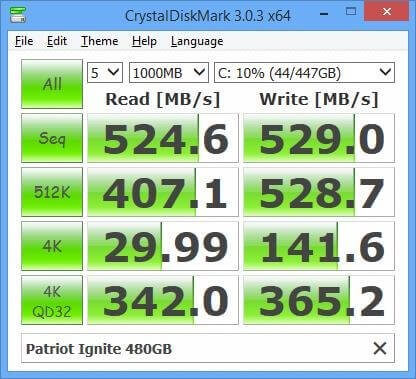
While Samsung is known for making some good drives, it seems like Patriot topped out on some of these result’s. So let’s move on to the Samsung.
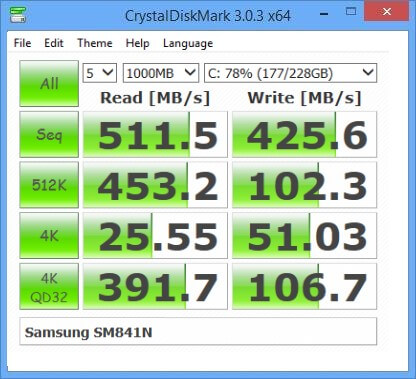
They might be a little hard to read, so let’s put them together.


As a little more of a visual representation, I made bar graph for you. I squeezed it a little together to make it easier to read.
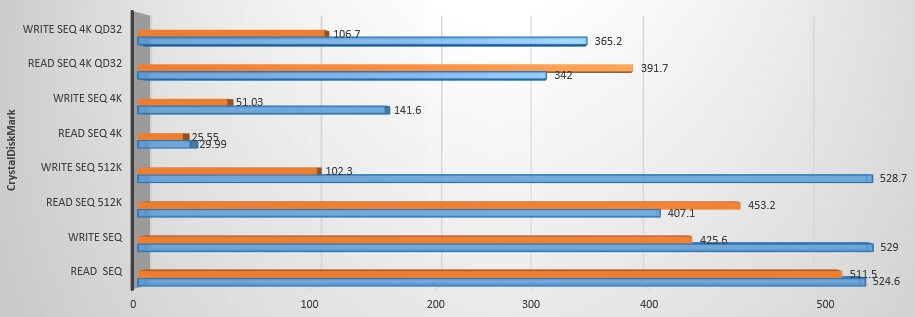
As you saw in the legend in the first screen, orange represents the Samsung SSD and blue represents the Patriot SSD. While the Samsung did outperform the Patriot in some, over all the Patriot drive outperformed the Samsung drive. The 4K Read and Write were better, Write was almost triple on the Patriot drive and again Sequential read and write speeds were higher on the Patriot.
OK, now what does this mean for your performance, these are just numbers and bar’s, well let’s put it more to real world use here.
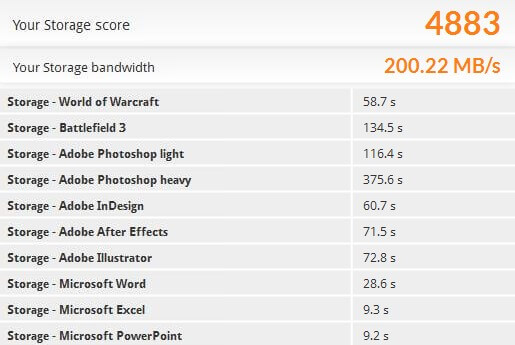
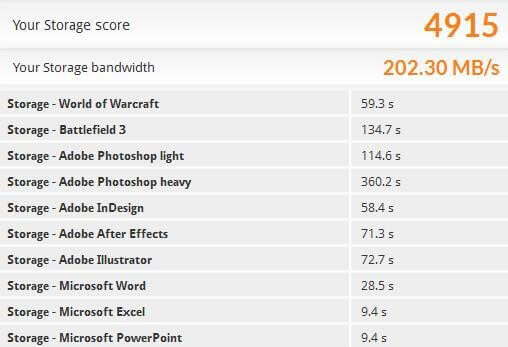
For a real world use to put the puzzle together for you, we will use PCMarks storage test. This test will show how quickly it loads games such as World of Warcraft and Battlefield 3, the applications such as Adobe’s Photoshop, InDesign and Illustrator then Microsoft’s Word, Excel and PowerPoint. These are programs and games you and I might use every day.
Alienware Area51
Custom Built PC
Combined Scores
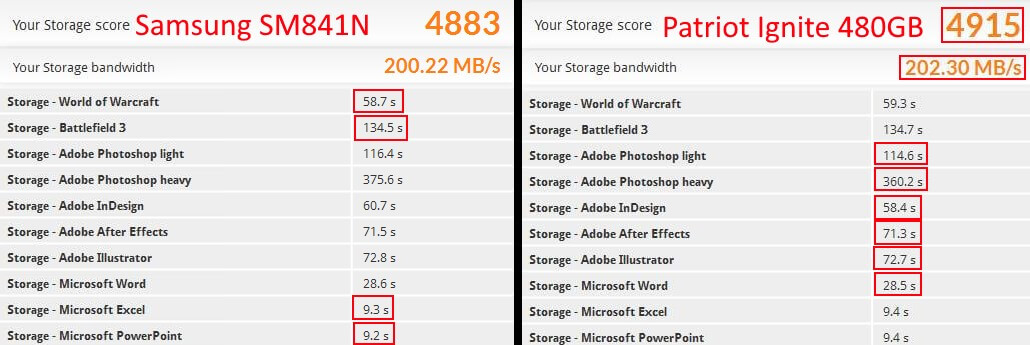
Comparing the 2, we can see that that the Patriot Ignite 480GB scored slightly higher, which means programs loaded just a few second fast. The most noticeable was the Adobe Photoshop heavy test, the Patriot loaded 15 seconds quicker than the Samsung SM841N.
Now, the Samsung in the Alienware might have been faster than the Patriot, it really didn’t need much more to be faster, but this is where the additional programs loading might have taken the toll on performance. The programs loading in the background make frequent calls to the hard drive since they are mostly monitoring programs, to get a speed increase one would just exit or uninstall these programs though I left everything running to show real world performance, I will show you a little more real world performance later on in the review, in the form of gameplay, but on the last set benchmarks we will check out the CPU.
[nextpage title=”CPU Benchmarks”]
Testing the CPU involves of course speed but it also involves heat and how to get rid of it. For this set of benchmarks, we will be testing with MAXON’s Cinebench and FinalWire’s AIDA64.
Cinebench
Alienware Area51
Custom Built PC
Combined Test
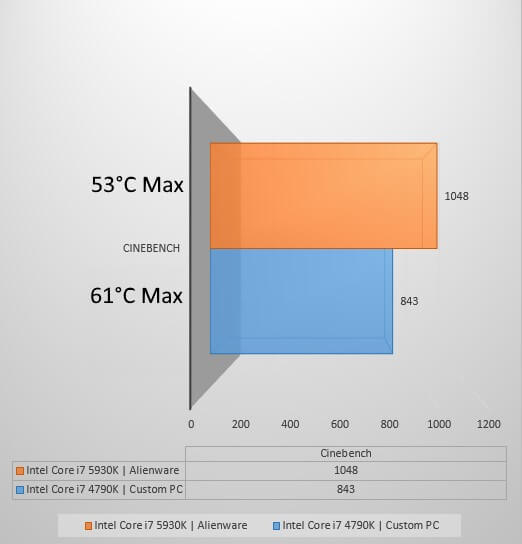
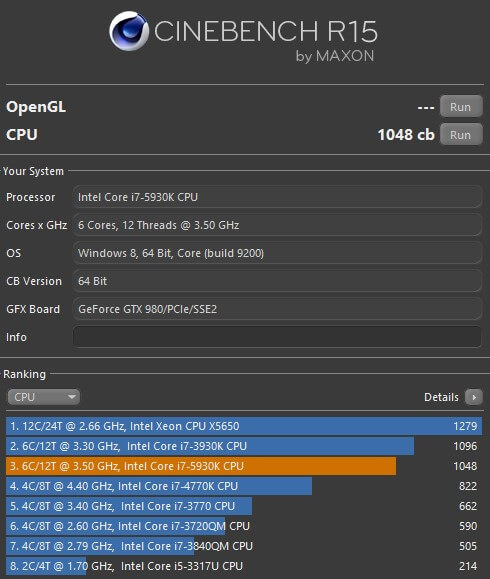
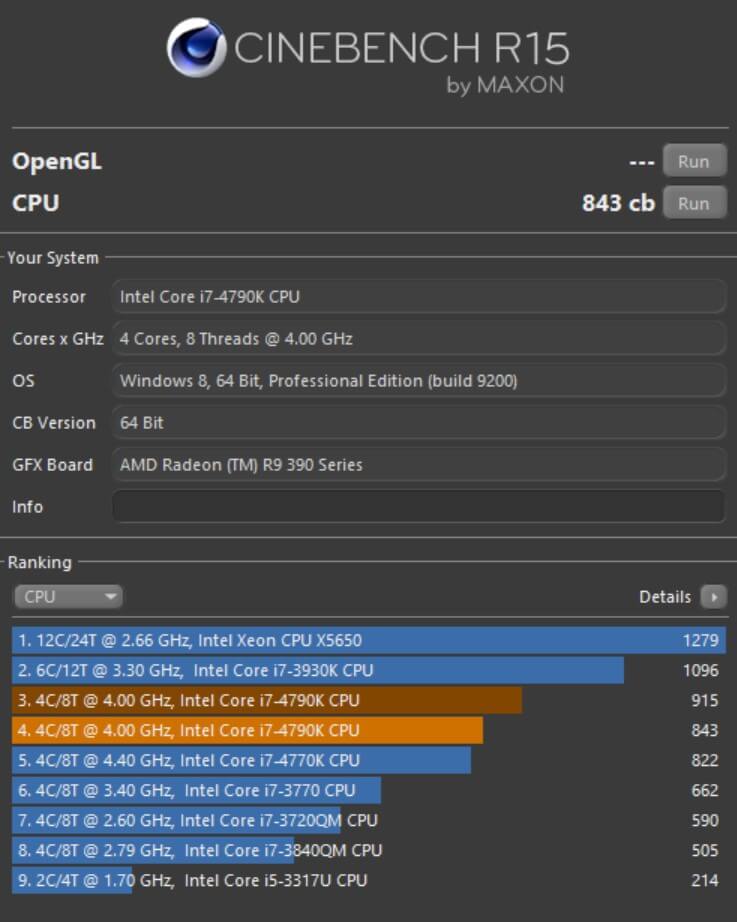
Understandably, the Alienware scored higher in this benchmark. While the Alienware’s Core i7 5930K running at 3.7GHZ (Max Turbo Frequency) had 6 physical cores and 6 hyper-threaded cores (for a total of 12 cores) scored higher at 1048 CB’s and the Custom built PC’s Intel Core i7 4790K running at 4.4Ghz (Max Turbo Frequency) had 4 physical cores and 4 hyper-threaded cores (for a total of 8 cores) scored just a bit lower at 843 CB’s.
Cinebench evaluates the CPU’s performance capabilities using the processors processing power to render a photorealistic 3d scene. As the program runs, you can see each core (physical and hyper-threaded) load individual frames. The CPU portion of the test, only performs the tests using the CPU.
You will notice as well in the combined tests, no matter how much processing power was pushed, these CPU’s did not throttle. Throttling occurs when CPU’s reach their max temperatures and down clock themselves to prevent potential fatal failures to the CPU. Throttling occurs at 100°C, the temps are far from 100°C. Now mind you, if you overclocked these processors past a certain point or you incorrectly raise the voltages, you will hit the TJunction or TJMax much quicker causing failure. So proceed with caution.
Ok, so talking about thermals and TJunction’s try to burn these up at stock speeds. To do this, we will stress the CPU’s using AIDA64, a more synthetic stressing utility. Different utilities will stress using different methods, but I found AIDA64’s method’s to hold more true to real world scenario’s, though again, synthetic.
To get this to show correctly, I had to resize the windows a bit, so I apologize if it looks a little odd.
Alienware Area51

Custom Built PC
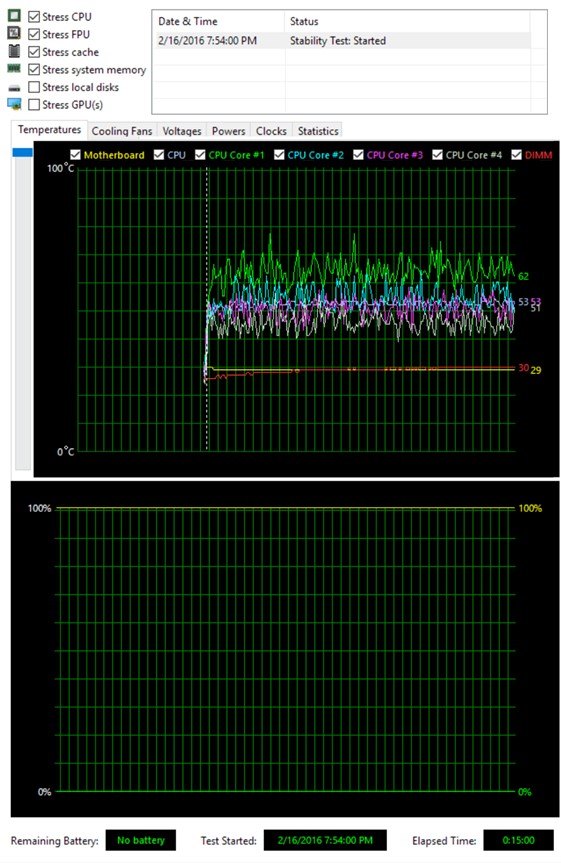
I ran the tests on each machine for at least 15 minutes to get a good heat buildup and you can see, they both did well holding up. The Alienware after 15 minutes reached a max of 58° C and the Custom Built PC a max of 62°C. You can see that each CPU was tested at 100% from the bottom half of each screenshot. You will also notice that while the temps did not get too high on either, the Alienware’s temps all hovered in the 50’s while the Custom PC’s seems to have fluctuated violently across all of the cores. This can be said for both liquid cooling solutions on both machines, they are both incredibly silent, you would barely know the machine was on.
Again, these are stock temps, overclocks will be very different. I will not overclock and compare on this review, but on the upcoming review I will be testing stock and overclocked benchmarks with the Arctic Liquid Freezer 240 Liquid Cooling. The comparison will not be made with the Alienware, because she’s gotta go back home, I can’t breathe in that atmosphere.
OK, so lots of benchmarks and not games, that’s not a great use out of this amazing machine and mind you, I am doing it for all of you…
[nextpage title=”Realworld Gameplay”]
So let’s get to some games, I will start the match up with Battlefield 4, then I will stir up some trouble in Grand Theft Auto V go back to a simpler time and vanquish some demons in Nosgoth.
First off on the list is Battlefield 4, let’s go kick some butt
Ok, maybe I didn’t do so great but you can see just how smooth gameplay was, the framerate was out of this world. I have never played the game so smoothly in my life with everything maxed out, all of the eye candy on.
Next up on the list is Grand Theft Auto V, a gallery of beautiful cars, rough streets and even more rough people. Let’s go destroy a gallery.
Yet again, I am impressed by the sheer fluidity of the game play and how pretty the world is with everything turned up high, or ultra. The light shining off of the cars, reflections and shadows, bodies flying, all look stunning, amazing even.
Sometimes you are fed up with the bright lights and the streets and want to go back to a time with no electronics, no cars, just you and nature. When you are done there, it’s time to hunt some demons and restore the peace or just embrace your inner demon and tear the flesh off of some mortal’s, well, there’s a game for that, let’s check out some Nosgoth.
That game is so much fun to get rid of some stress or maybe to build up more, pick your poison. The game as good as it is, seems very poorly optimized, there’s no reason why it should drop to the 30’s in frame rate. I watched my son play it a few times after testing it out, I fell in love with it. I will say the game takes a few minutes to load on his machine, graphics aside even though he does have an SSD and on this one, takes seconds. So loading wise, its tops but graphics, it seems to fall slightly behind, even though I did have all the eye candy turned up, 3 x GTX980’s shouldn’t even break a sweat and give you over 100 FPS, but that’s not the case in this game. Reading around the internet, I find everyone has the same problem though.
Now on to the maintenance side.
[nextpage title=”System Maintenance”]
When I received this system, it was in need for some driver updates and as a builder I am used to hunting and pecking around the world wide web for drivers, I update very frequently and it can take a long time even though I have favorites for all the manufactures that have their hands in my PC. I roam through Asus’ website for my motherboard, Intel’s for my chipset, MEI, NIC and a few others, then Patriots for potential firmw