
We are influencers and brand affiliates. This post contains affiliate links, most which go to Amazon and are Geo-Affiliate links to nearest Amazon store.
As a gamer and for all fellow gamers, we are bombarded with promises of upgrades will change our lives, and for the most part they don’t do much. SSD’s and memory do help tons, but one of the things that get us as gamers are video cards, but they are ALWAYS so expensive. Today I have the pleasure of bringing you my review of the Sapphire Radeon NITRO+ RX 480 8GB GDDR OC 11260-01-20G.

Ohh…. I know,… I want to tear it open too, but let’s check out the specs first.
Spec’s and Features
- Core Speed: 1208Mhz
- Boost Engine Clock: 1342 (Seems to always run at this speed though)
- 8192MB GDDR5 256 bit RAM
- 2000Mhz
- 8000Mhz Effective Memory Frequency
- Compute Shaders: 2304
- Supports Crossfire
- 5 Output Maximum
- 1 x DVI-D
- 2 x HDMI 2.0b
- 2 x Display Port 1.4
- Resolutions Supported
- DVD-D
- 2560 x 1600 (60Hz)
- HDMI 2.0b
- 3840 x 2160p (60Hz)
- Display Port
- 3840 x 2160 (120Hz)
- Quad HD Display 4K*K Support
- Supported API’s:
- OpenGL 4.5
- OpenCL 2.0
- DirectX 12
- Shader Model 5.0
- Vulkan API
- Supported Features
- FreeSync Technology
- AMD Eyefinity
- Dual Bios
- AMD Liquid VR Technology
- AMD Virtual Super Resolution (VSR)
- AMD TrueAudio Next Technology
- AMD Xconnect Ready
- DirecX 12 Optimized
- Radeon VR ready Premium
- HDR Ready
- Frame Rate Target Control
- NITRO Fan Check
- Dual X-Fans
- Two Ball Bearing
- NITRO Quick Connect System
- NITRO Glow RGB LED
- NITRO CoolTech(NCT)
- NITRO Free Flow
- Dual-X Cooling
- NITRO Boost
- Intelligent Fan Control III
- Black Diamonds Choke
- Power Consumption: 225Watts
- System Requirements
- 500Watt Power Supply
- 1 x 8 Pin AUX Power Connector (Yes, only 1)
- Windows 10, 8.1, 8 or 7
- Form Factor
- DVD-D
- 2000Mhz
- Length: 9.45in
- Width: 4.9in
- Depth: 1.6in
- Shipping weight: 2.35 pounds
I know, I fell asleep too while I was typing it, too much info. OK, let’s get into an unboxing and open this Sapphire Radeon NITRO+ RX480 8GB GDDR5 OC box up.
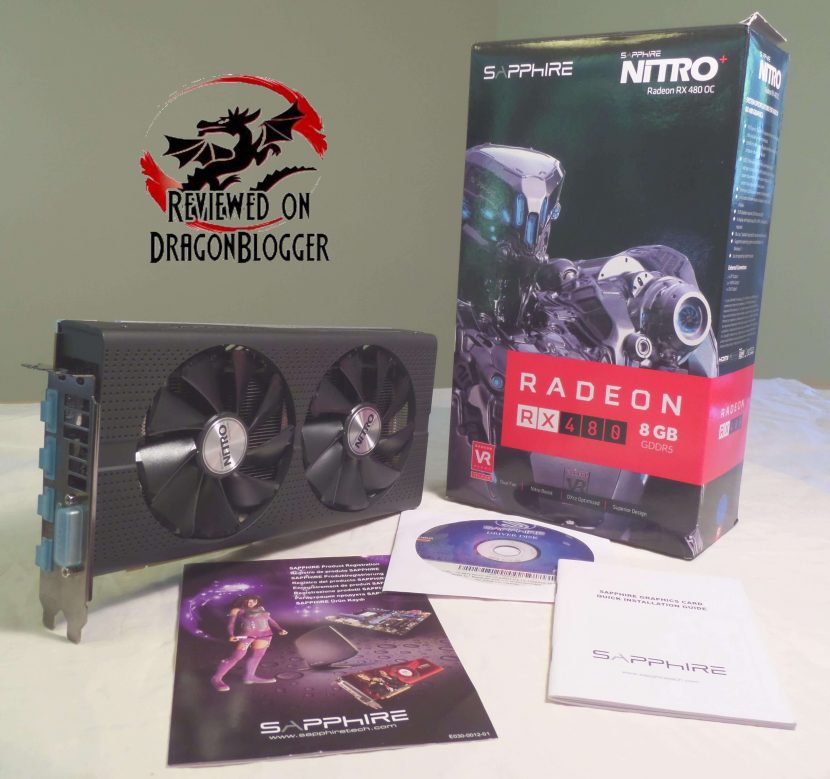
So yeah, you can hook up to 5 monitors, what kind of ports though?
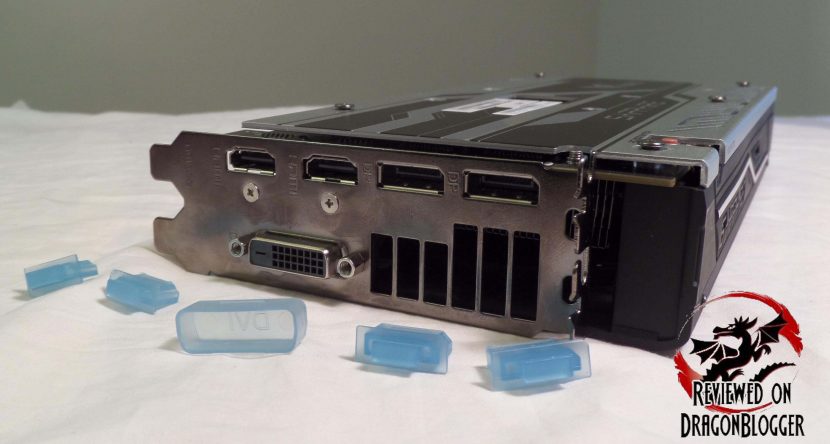
As I mentioned in the long list of specs and features, we can connect 2 x Display Ports, 2 x HDMI ports and a single lonely DVI-D port. Before you make fun of the DVI-D port, I still have a 27in monitor that has one, and yes it is an LED and it works fine, so there is no reason to get rid of it. Thankfully they still keep that port there as well as provide a host of other ports to make your investments still worth it.
Another thing this does is that it allows you to not have to use adapters to connect monitors. As you saw in the unboxing, Sapphire does not include any cables or adapters, so you have to fend for yourself on these.
Looking around the card, we find the “LED Mode Switch/V BIOS Switch”
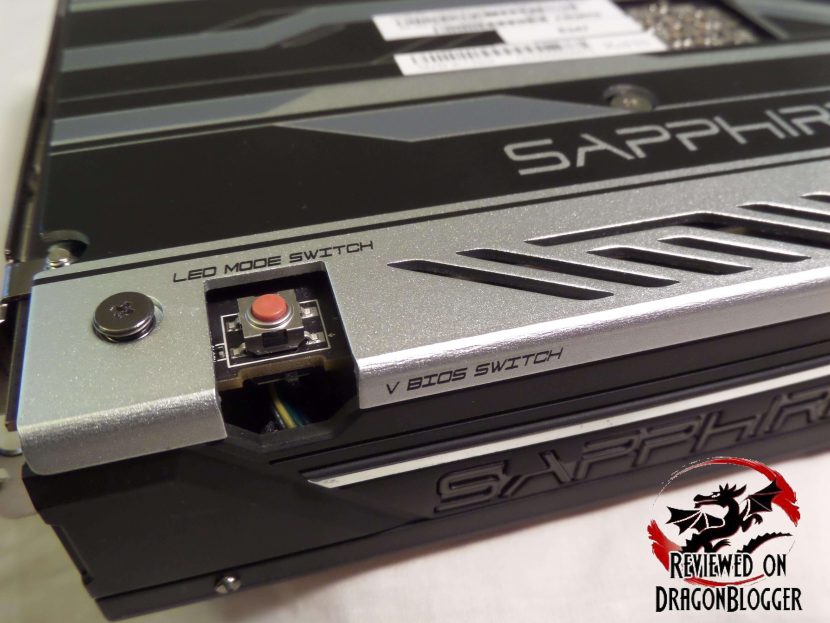
The LED Mode Switch on this Sapphire card allows you to change the LED lights on the card; I will show you that a little later in the review.
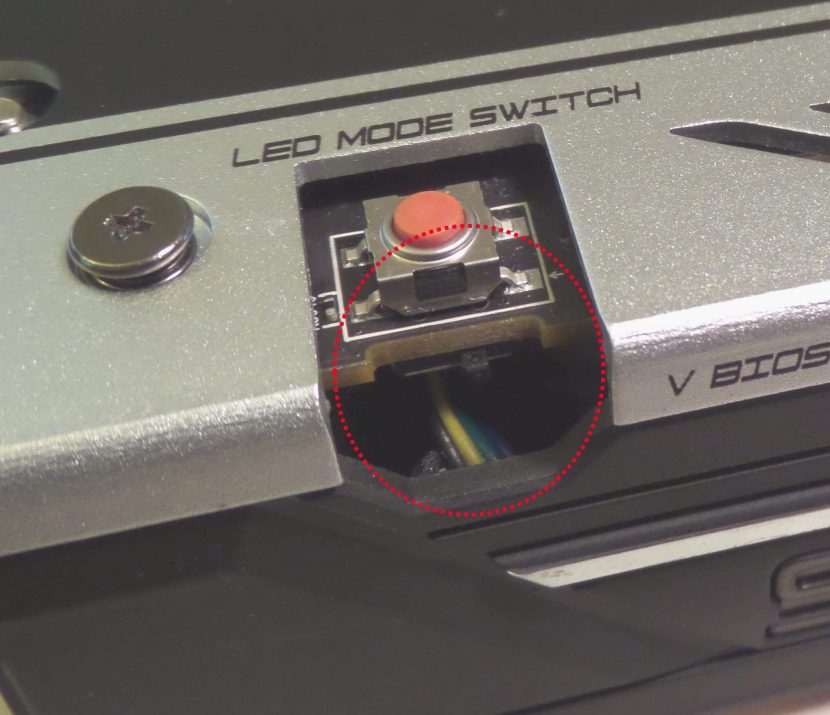
A little closer, under the button, we find the V BIOS Switch. This switch allows you to switch to a different BIOS or Firmware on the card where on one, you might have an overclock and the other, you might have a stock setting. This comes in handy when working on overclocks and you might push one of the overclocks a little too high not allowing the system to turn off, at this point you can unplug the machine to let it discharge, flick the switch to the left (or the right), plug the machine back in and you are good to go.
Moving more to the right, we come to the back of the card.
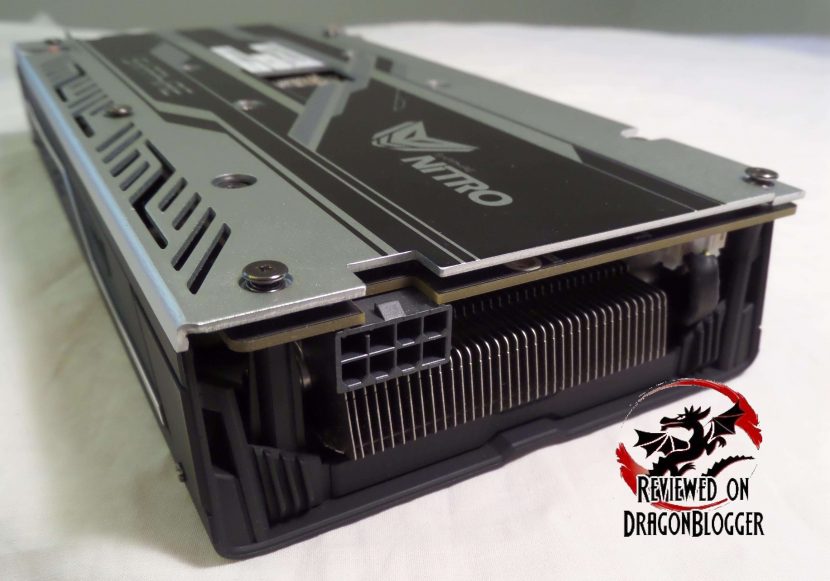
Here we find a single 8 Pin PCI-E plug, yup just one. This is not a power eater, but we will get into that also a little later in the review with some benches.
Turning the card around again, we come to the bottom of the card itself, where we find the PCI-e connector.
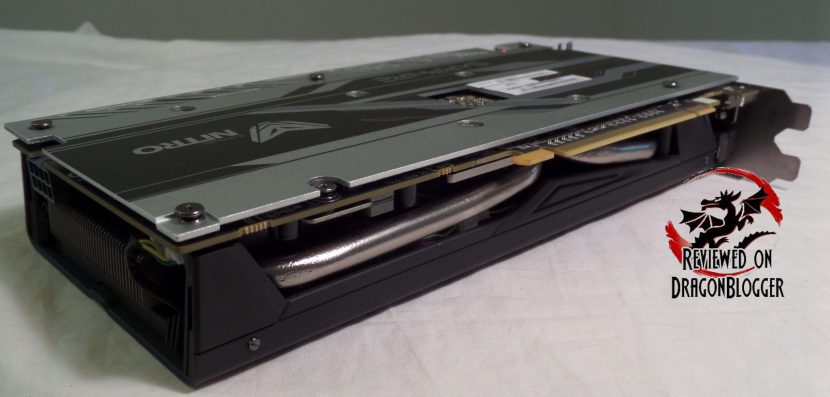
We also find 2 huge pipes to keep things nice and cool.
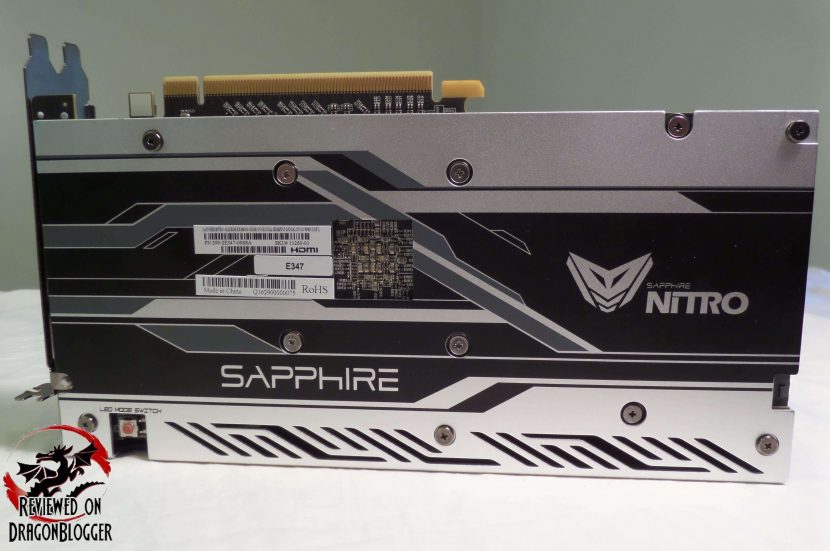
The top of the card has an Aluminum backplate with their own nice design, but it’s a little more than a design, there’s some function here as well. I will get into this a little later in the review as well.
Alight, so now that we have seen the card, how do we install it? Well I go over that it in the next chapter.
[nextpage title=”Installing the Sapphire Radeon NITRO+ RX 480″]
Alright, while some of my more advance readers might think it’s a little dumb that I am showing them how to install a card, I am not. I am providing this video for those of you that don’t know how to install a card to save you some money. Aside from saving you money, I am hoping to provide you some confidence to install and upgrade your video card on your own. This will save you some money, maybe enough to buy another card, who knows.
Anyway, let’s get to the install itself.
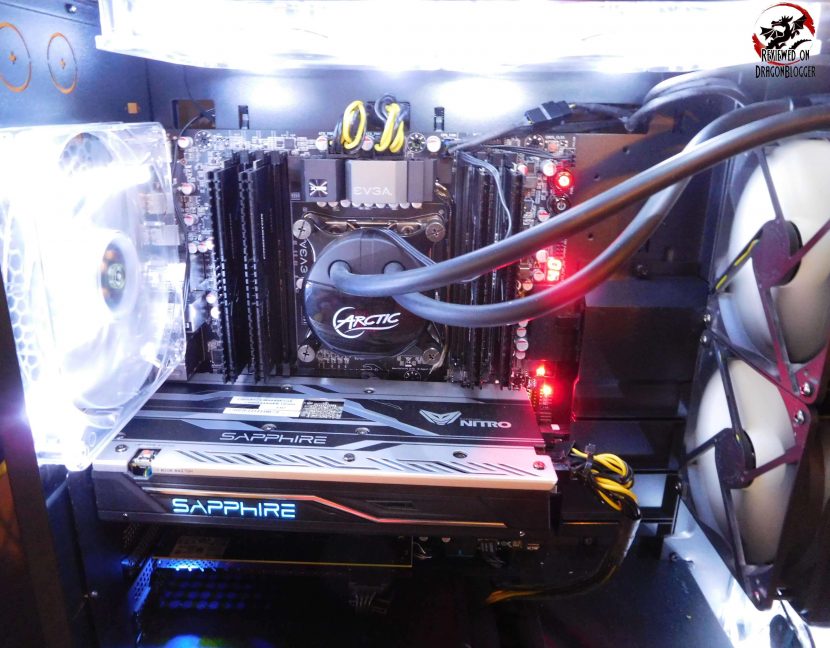
It’s a little bright I know, but I took the side panel off so that I could get a crystal clear picture of the system with the card inside. The Anidees AI Crystal has tinted glass side panels so it is not as bright with the side panel on but I wanted to get rid of the glass’ glare. She looks beautiful right?
That was a small chapter, but I think important enough to be on its own and hopefully helpful enough.
OK, let’s get into some benches, I think it’s time.
[nextpage title=”Benchmarks, Performance, Temperatures and power consumption”]
Before we get into the benchmarks, here are my system specs
- Anidees AI Crystal Case: https://geni.us/6NAIJBN?ygdb
- Intel Core i7 5930K Processor: https://geni.us/6NAIJBN?4C8Itd
- EVGA X99 Classified Motherboard: https://geni.us/6NAIJBN?E9eamo
- Arctic Liquid Freezer 240MM CPU Liquid Cooling: https://geni.us/6NAIJBN?vEaJAf
- Kingston HyperX Predator 3000Mhz 16Gig: https://geni.us/6NAIJBN?w9kPe5
- Sapphire Nitro RX 480 Video card: https://geni.us/6NAIJBN?zeF3
- Samsung 850 EVO 500GB SSD: https://geni.us/6NAIJBN?1gf0fs
- Hitachi 1TB SATA 3G HD: https://geni.us/6NAIJBN?pU2QOo
- Patriot Ignite 480GB SSD: https://geni.us/6NAIJBN?eoPVsG
- Kingston HyperX 240GB SSD: https://geni.us/6NAIJBN?8leEDW
- Plextor 256GB PCIE SSD: https://geni.us/6NAIJBN?gVBR
- Cooler Master Silent Pro Gold 1200W Power Supply: https://geni.us/6NAIJBN?Umwm
- Microsoft Windows 10 Professional: https://geni.us/6NAIJBN?GYbBRY
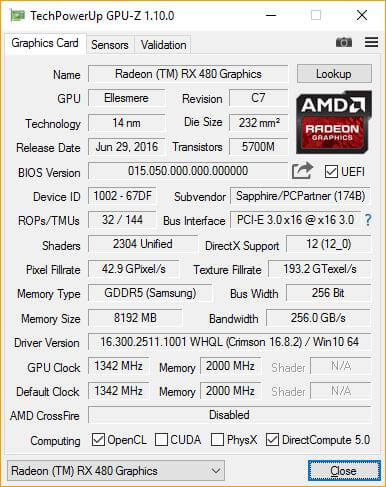
Here are the specs of the card displayed in TechPowerUp’s GPU-Z, just to give you a little more visual perspective of it.
Sapphire also has their own utility, which is very handy, it is TRIXX 3.0. I will go into that software a little later in the review, because we will need it for a few things.
you can find Sapphire’s TRIXX 3.0 here: http://www.sapphiretech.com/catapage_tech.asp?cataid=291&lang=eng
The Sapphire Radeon NITRO+ RX 480GB card is based off of AMD’s Ellesmere GPU and of course Polaris. This comes with a new 14nm FinFET process improving performance and lowering power requirements of AMD’s cards.
I had to cheat a little here and show you some of TRIXX 3.0
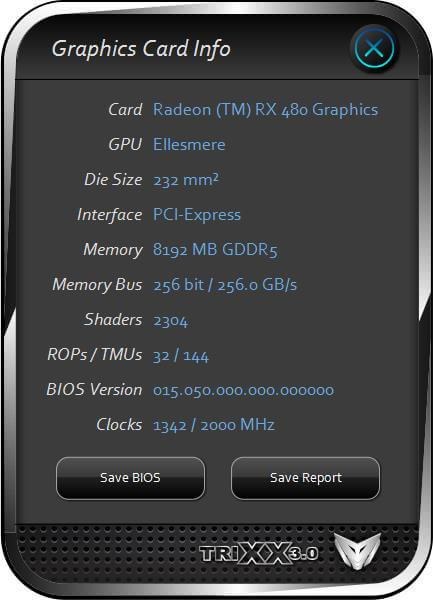
GPU-Z was not allowing me to show you the number of Compute Shaders, but here you go, 2304 of them.
As you can see from GPU-Z’s readout I am using GPU-Z’s I am using AMD’s video driver version 16.300.2511.1001, which is Crimson version 16.8.2. Once AMD released Crimson about a year ago, their performance has been greatly improving.
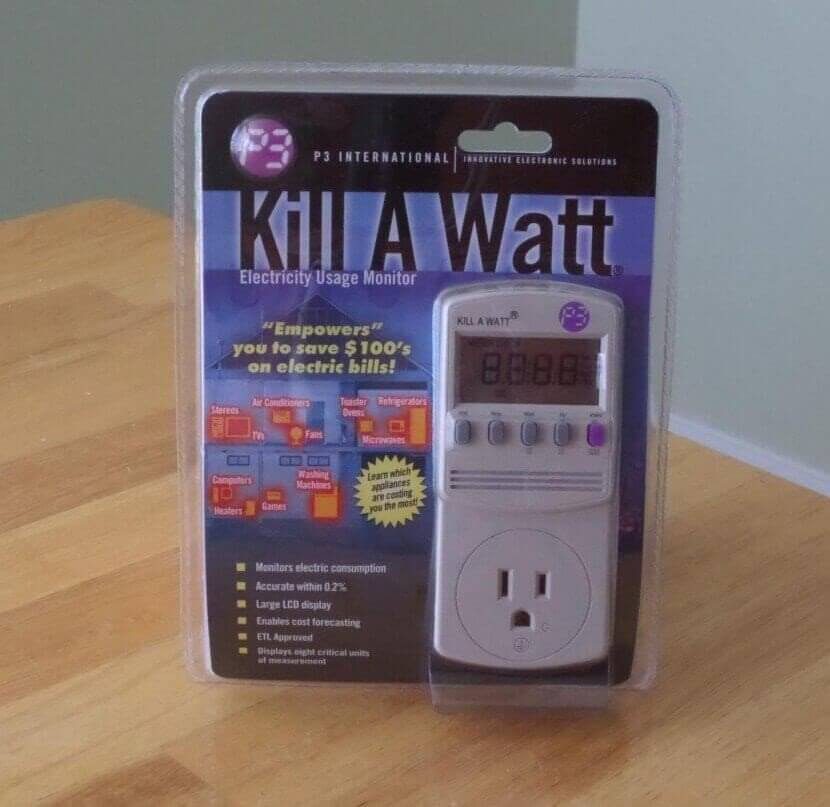
Before I start discussing the benchmarking process, I wanted to let you know I also check the wattage use of the entire system with the card. I test for Minimum, Average and Max usage using the “Kill A Watt” by “P3 International”.
The programs I am using to benchmark are the following.
- FutureMark’s 3DMark Fire Strike
- Metro Last Light
- Thief
- Tomb Raider
- Ashes of Singularity
- Tom Clancy’s The Division
Ashes of Singularity and Tom Clancy’s The Division are actually new additions to my benchmarking suite. So let’s started benchmarking Sapphires latest and greatest.


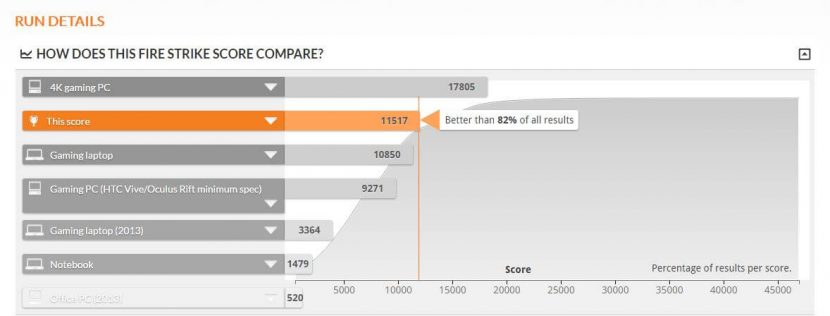
A very decent score and as it states 82% better than other results, pretty cool. The lowest wattage reached while this was benchmarking was 226Watts, average was 350Watts and the maximum watts pulled was 399Watts. Also, the GPU reached a max of 83°C, this was not utilizing TRIXX 3.0’s fan adjusting utility, all stock.
3DMark states that the drivers are not approved because Crimson drivers are typically beta drivers, but I grabbed the latest and greatest.
Alright, let’s get to some Metro Last Light

Here are my Metro Last Light presets. For each benchmark I will present the presets, changing on the resolutions.
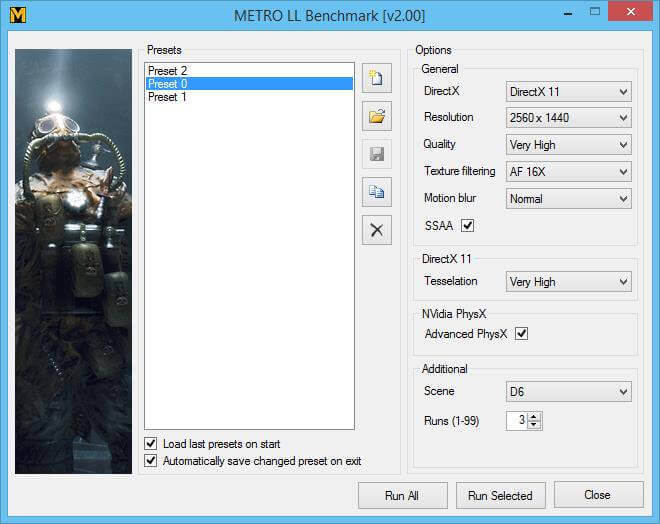
The only difference between “Preset 2”, “Preset 0” and “Preset 1” is changing the resolution between 2560×1440, 1920×1080 and 1280×1024. Below are the results from each.
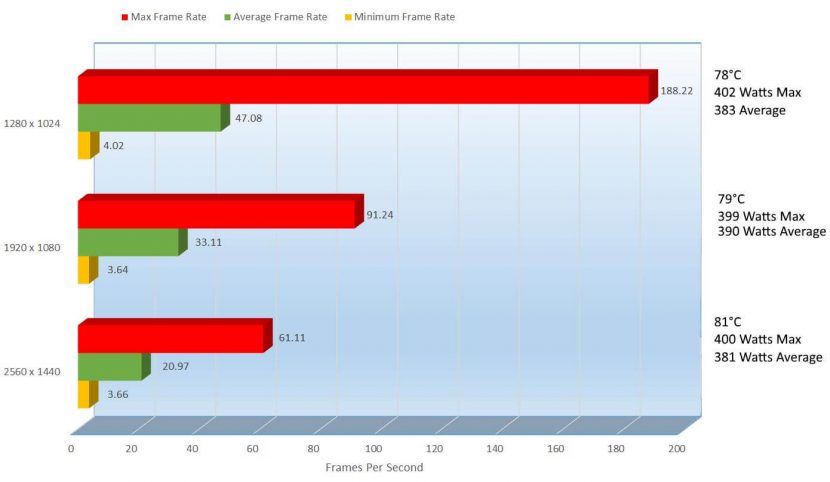
The performance here I know looks a little rough, but actually Metro Last Light is a card killer; it can take down the toughest of cards. I have been using this game to bench for a few years and not many cards can make this budge,… though there have been a few. One thing to note about Metro Last Light, and all of the other games I will be benchmarking here, they are set to Max settings, Very High, High or Ultra, depending on the individual settings on where they can go. That being said, if Metro Last Light is one of your favorites, you can turn down just a little bit of eye candy and get the performance you want, as high of a resolution you want.
There is a 6.94% decrease in performance from 1920×1080 to 2560×1440, though oddly enough the average power consumption also goes down 2.33%, usually it would go higher especially since the temperature was raised from 79°C to 81°C, a 2.5% difference.
Ok, let’s see if THIEF can silently makes its way into the arena and take the cake.

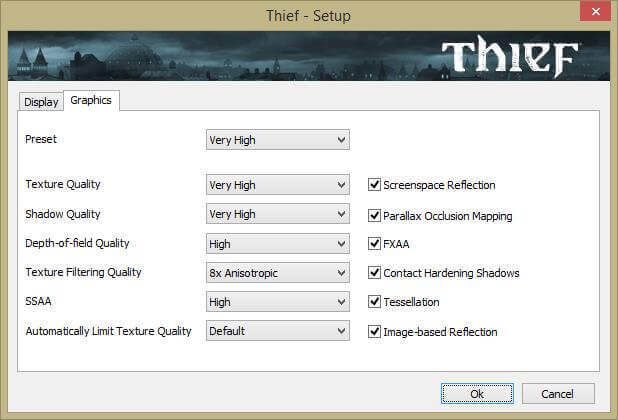
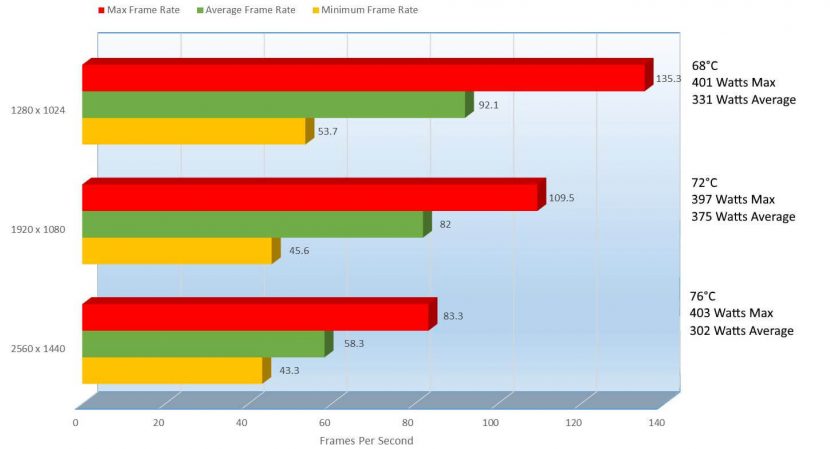
Thief gets much more playable at 2560×1440 at 58.3, slow close to the magical and sometimes mystical 60FPS. At 1920×1080 we can see 82FPS, that’s a 33.79% improvement from 2560×1440 and even the wattage difference between the 2 is impressive at 21.57% in favor of 1920×1080. For 1.7FPS from 60FPs, I would still play at 2560×1440 myself.
Laura might have a different opinion though, let’s check with her.

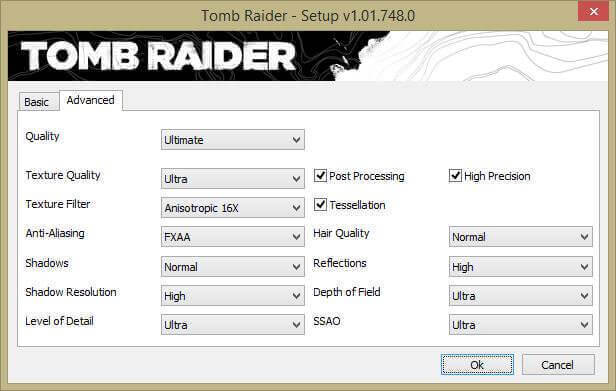
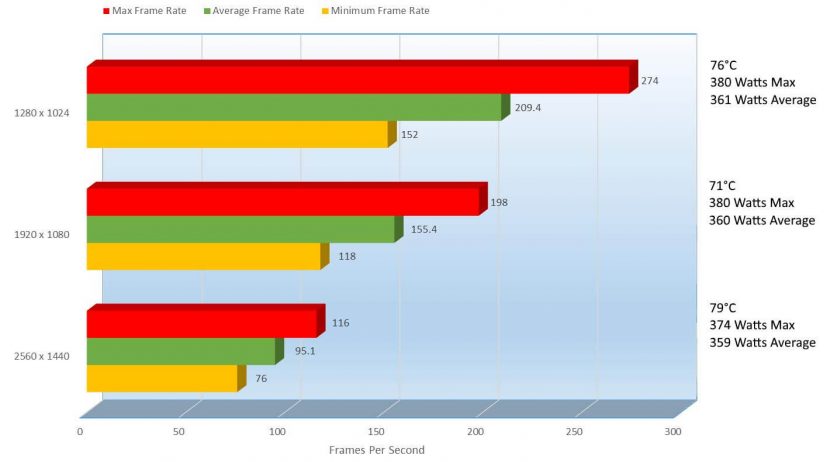
Laura joins the Thief guild in playability as the FPS jumps up to 95.1FPs at 2560 x 1440 at even better than that at 1920×1080 jumps to 155.4, that’s a 48.14% increase dropping resolutions. Mind you, if your monitor can handle 2560×1440, I would choose that resolution so it is 100% playable at 95.1FPS and there is only an 8°C heat increase and actually 1 Watt decrease. Very impressive here but these may need have more research done, I believe that the technology Ashes of the Singularity has may be able to calculate this correctly.

Ashes of the Singularity is a DX12 game if you did not know, but there is a little trick to get it to function in DX12. In Steam, when you about to double click this game to get it started, actually right click on the title
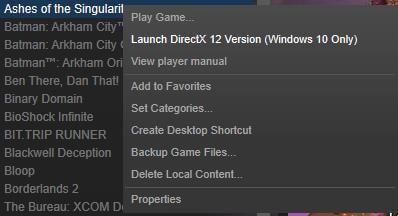
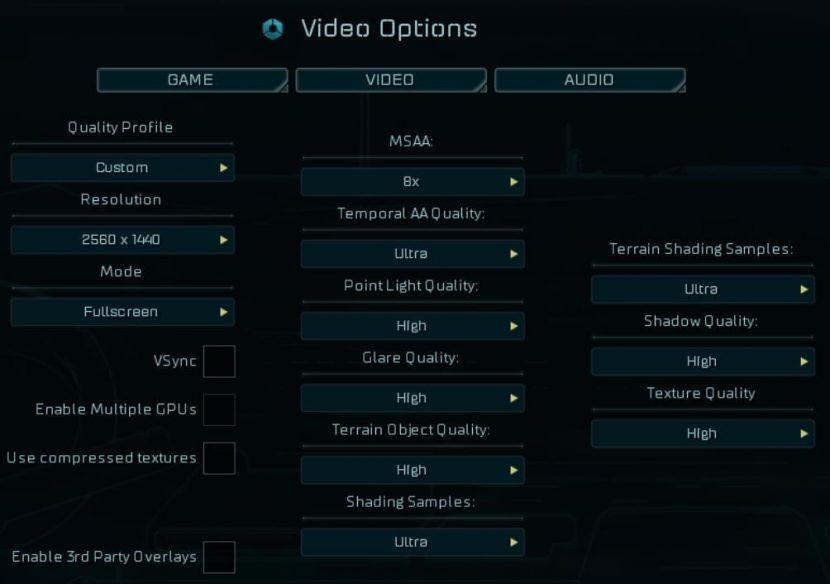
There you will see a drop down and you will find “Launch DirectX 12 Version (Windows 10 Only)”, then also as it implies, this will only work in Windows 10. After that, once it is loaded, here are my settings.
Also, you know you are benching in DX12 when you get this message when you click “Benchmark”
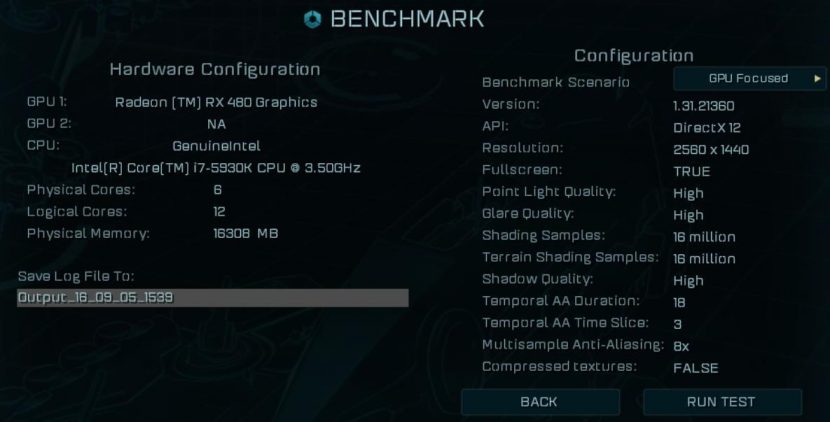
Notice under “API:” it reads “DirectX 12”.
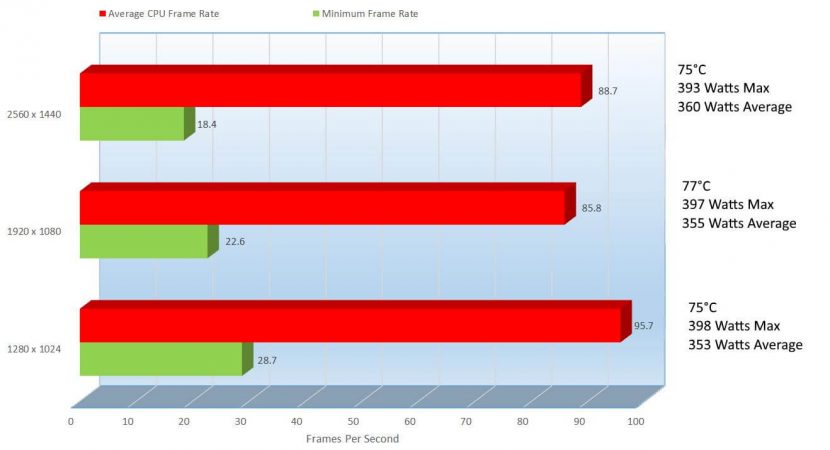
Now this game HEAVILY utilizes the CPU. As I was benchmarking this game, I watched it and it was smooth, there were a few tiny spots where it did slightly chug a bit, but mostly smooth. You can see that actually in the graph above. The settings I have are incredibly high, “Use Compressed textures” might help in the performance as well, but I wanted to make this card sweat a bit.
2560×1440 shows a GPU performance of 18.4FPs and 1920×1080 shows 22.6FPs, but the CPU offsets this a tiny bit.
The performance difference GPU wise was in favor of the 1920×1080 and shows a 20.49% improvement over 2560×1440. Here is where the CPU took charge a bit and the CPU performed better under 2560×1440 with a 3.32% improvement over 1920×1080. This is definitely a very interesting benchmark; we can see that the CPU might be a little more important than the GPU, though surely if you lowered some of the settings under “Video” you would surely get better performance.
OK, let’s jump to Tom Clancy’s The Division. I bought this game to do benchmarking and found it pretty cool. Now I just need time to actually play it.

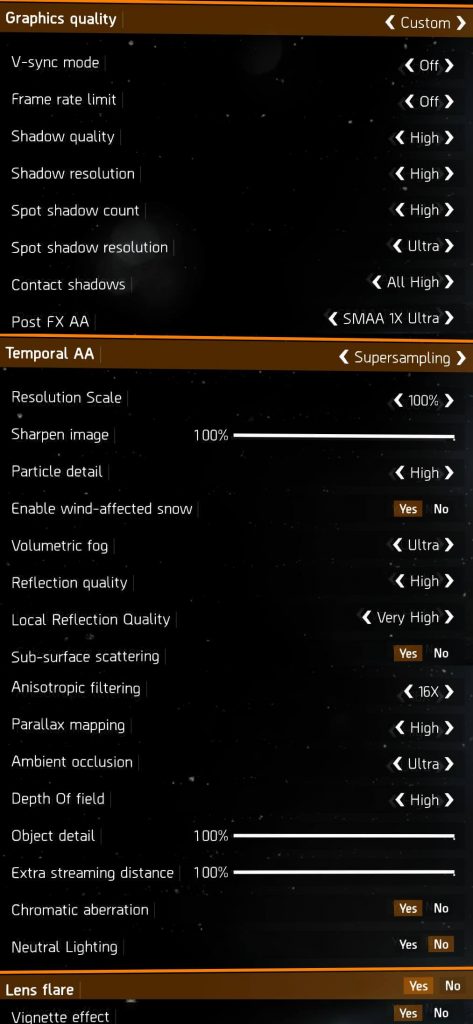
Here are the settings I defaulted at, again afterwards only changing the resolutions. There are a ton of settings.
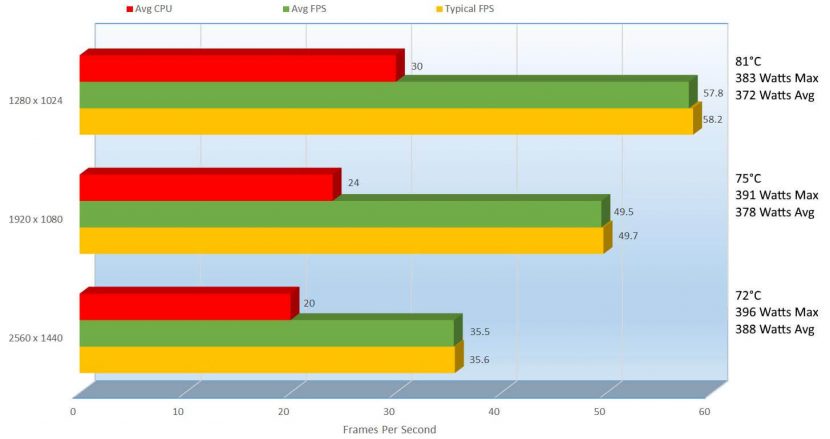
The Division does show you how much CPU it utilizes, but you can see here utilization is relatively low, now the benchmarks here are a bit surprising. I watch these benchmarks as they run to see if I see any artifacting, and while I saw none, it felt like everything was smooth. From 2560 to 1920 resolutions there is a 32.94% improvement, simply dropping resolutions. The game did play very well, but yeah there were a few spots where it chugged a little tiny bit.
It is very difficult to actually discuss what I saw though aside from what I have already, but actually, I think it might be best to show you exactly what I found.
This next chapter will show you some game play.
[nextpage title=”Gameplay and Performance”]
There is nothing better than seeing things first hand, so let’s check out some gameplay, this also gives me a great excuse to play some games.
Grand Theft Auto V at Ultra (Though I did change settings mid through the video, I show you everything)
OK, not bad, but since this I did have this card during the Open Beta, let’s check out some Battlefield One Beta Gameplay.
OK, I really like this game, so here is a little more.
And well, since I do still love Battlefield 4, here is some Battlefield 4 Gameplay
And here is Tom Clancy’s the Division.
You can see the frame rates did not get into the 60’s, but it still ran very well.
OK, now that we have all that, we can come to a conclusion of the card… well not really. Let’s benchmark the card itself overclocked.
[nextpage title=”Overcloking Performance, Benchmarks, Temperatures and Power Consumption”]
OK, so before I provide the results, let me show you how I got there. First off, this is not a quick thing, to overclock correctly, you have to spend a few hours, have some patience, a paper and a pen because you will be there for a while recording your previous attempts.
Below, I will list before and after results of course of benchmarks but I will show reports from Sapphires TRIXX 3.0 and GPU-Z.
Before After


So with this overclock, I was able to 79Mhz from the GPU Clock and 30Mhz from the memory clock. With that, I was to raise my bandwidth, pixel fill rate and texture fill rate. I didn’t spend a ton of hours doing this, I had to get this review out but it looks like I could have squeezed out some more performance.
OK, so let’s check it out under TRIXX 3.0 itself.
Before