
We are influencers and brand affiliates. This post contains affiliate links, most which go to Amazon and are Geo-Affiliate links to nearest Amazon store.
A lot of people are curious about what their temperatures might be while they are playing games which as we know puts a lot of load not only on your GPU but your CPU as well. One has to pause their game, and switch to their desktop to open a certain program to view the temperature of the CPU and GPU. That’s pretty much a hassle right? Well what if I tell you there’s a way that you can view both the CPU and GPU temperatures along with average usage in-game?
Be prepared because this article is going to be rather a long one on “How to view GPU and CPU temperatures in-game”. I would’ve done a video, but you may need more time and it is easier to follow along steps in an article, plus you can ask questions in comments and I can reply and help which isn’t as easy to do via video. You should know that we are going to do this in two parts, one for monitoring GPU temperature and a second for CPU temperature monitoring, so you can skip either one you’d like.
What’s Needed:
- MSI Afterburner
- HWinfo 32Bit or 64Bit depending on your OS.
Both software titles are free to use. For part one, where we’ll cover GPU only, you’ll only need MSI Afterburner , but for part two where we will cover CPU only, you’ll need both MSI Afterburner and HWinfo. So in case you want to leave the in-game monitoring for CPU, you don’t need HWinfo, but if you need only CPU monitoring, you’ll still need MSI Afterburner, or at least the Rivatuner Statistic Server which comes bundled with Afterburner but can be separately downloaded from here.
Part 1 (GPU Monitoring only)
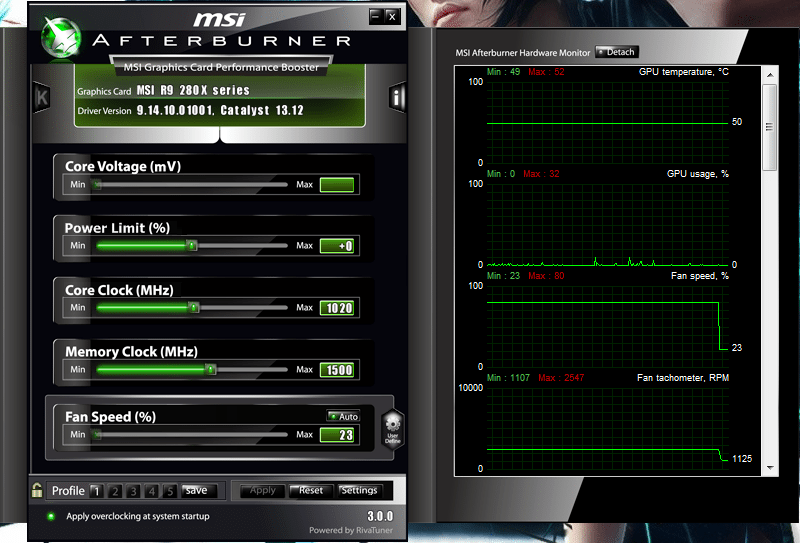
Once you’ve downloaded the MSI Afterburner, and are done installing it, it should look something like this (Pardon my catalyst driver version, latest is 14.4)
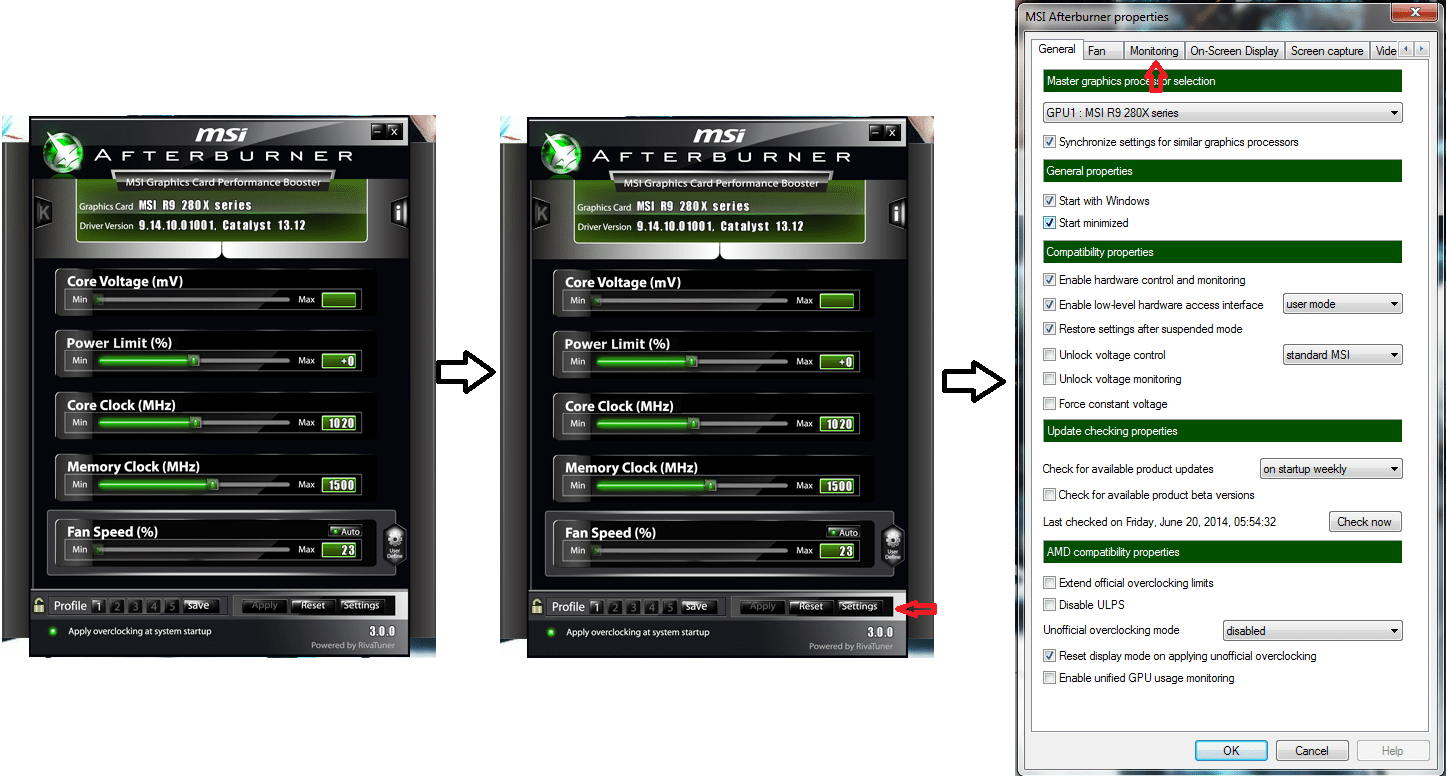
So this is where the lengthy part begins, and before proceeding you should know that the black arrow is for indication of a steps progression and the red arrow indicates where you need to click and we’ll follow this tradition throughout the article. So once the program has been opened, you need to click the settings button present at the bottom, and a new window shall open. The currently opened tab has no concern to what we are going to do, except you can tick the “start with windows” and “minimized” if you want it to load itself whenever you boot the system, minimized. The tab which is related to our task is “monitoring” so click on it and a new tab should open.
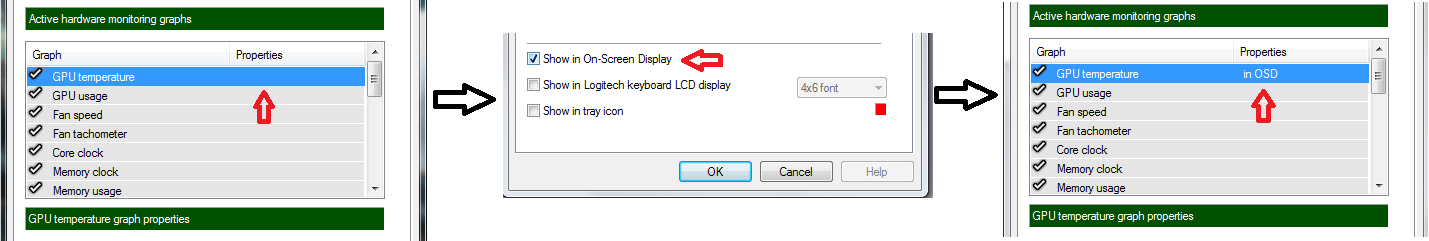
Once there you should see a table-like column under “Advance Hardware Monitoring Graph”. That is the place where we select what to see and not to see in-game. For this tutorial we are only going to use GPU Temperature and GPU Usage.
Click on GPU Temperature, and tick on the “Show On In-Screen Display” present at the bottom, once checked you should see that “In OSD” have been added to the properties of GPU Temperature.
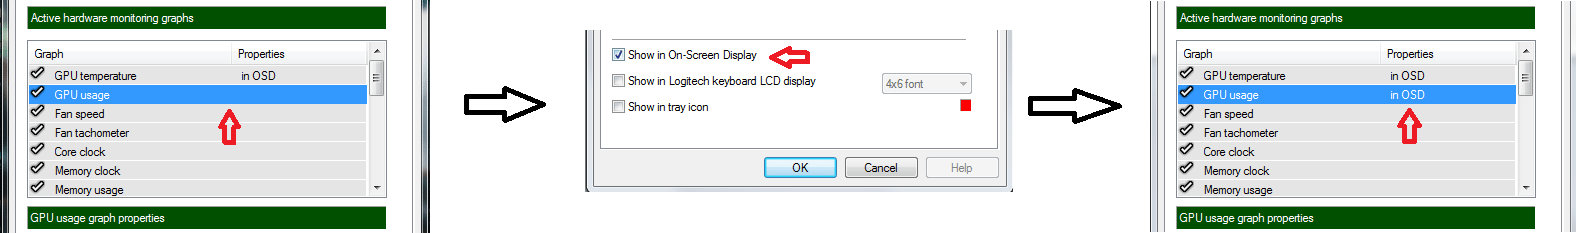
Almost same steps for GPU Usage. Click on GPU Usage, and tick on the “Show On In-Screen Display” present at the bottom, once checked you should see that “In OSD” have been added to the properties of GPU Usage also.
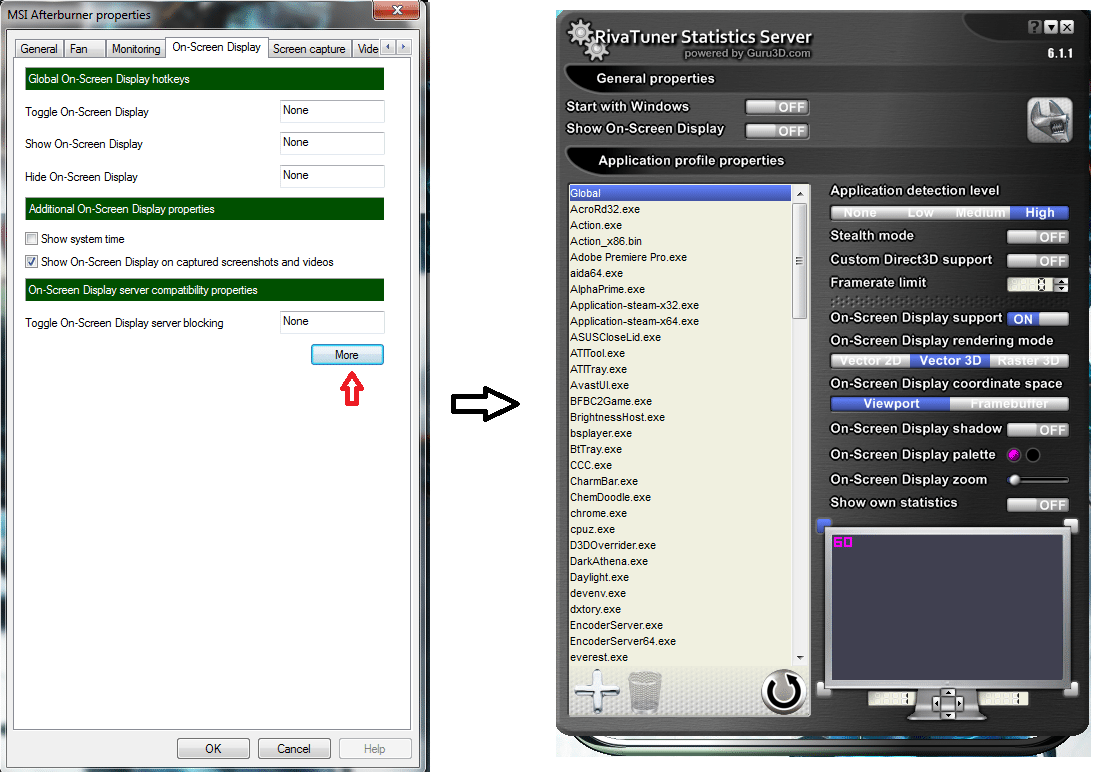
So moving on, our job is done in this tab also, now head over to the “On-Screen Display” tab and click on “more”. But before you do, you can also tick the “Show On-Screen Display on captured videos and screenshots” , I hopes it’s clear why and you can also assign some hotkeys. Once you’ve clicked the “more” button a new window should open which would looks like this:
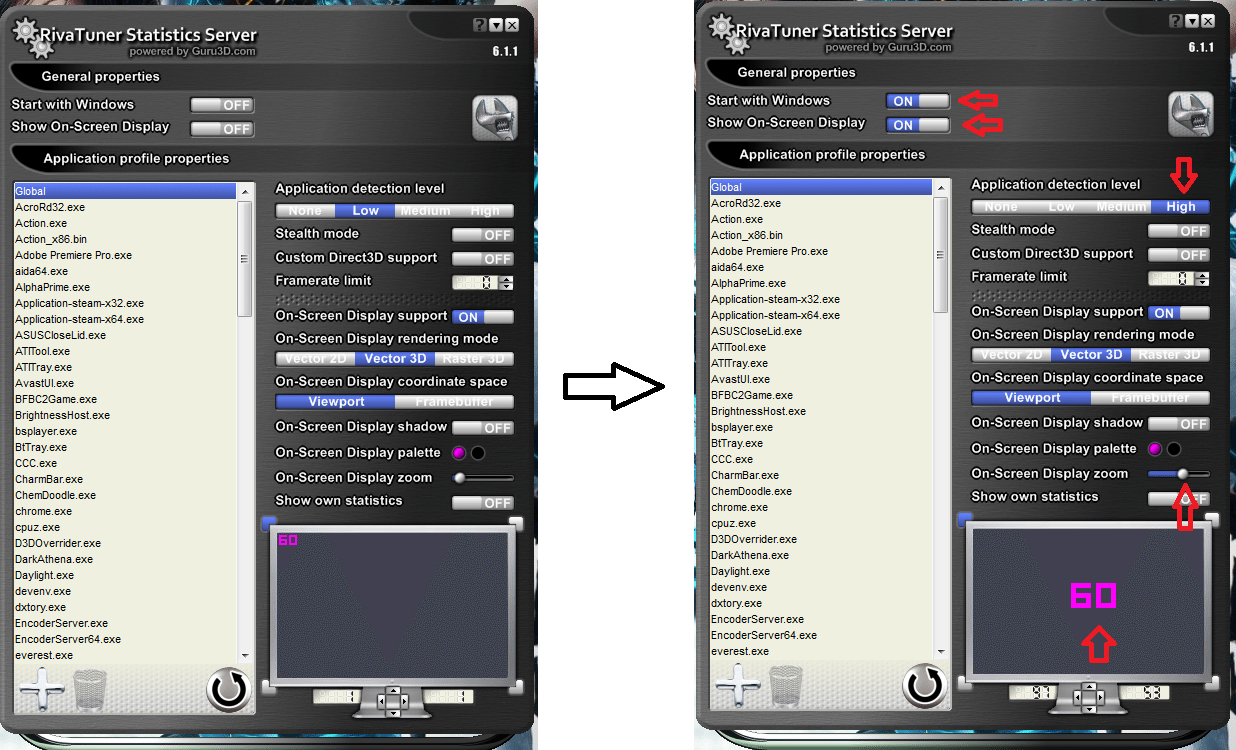
This new window which just opened is called Rivatuner Statistic Server which is used for showing the textual temperatures and stuff of GPU and CPU in-game or on-screen. This is like the base of on-screen display without which you can’t possibly see the textual temperature and usage of CPU/GPU. So once it is opened we need to switch the “Show On-Screen Display” button from Off to On. You can even switch the “start with windows” if you’d like, well I would. There are some other options that you can play with like changing the “Application detection level” from low to high so the calculation is more precise . You can even change the size of text and position of the text by sliding the “On-Screen Display Zoom” Slider and dragging the text within the mini-LCD image.
Well that is all for the in-game display of GPU temperature and usage so let’s have a look at the results.
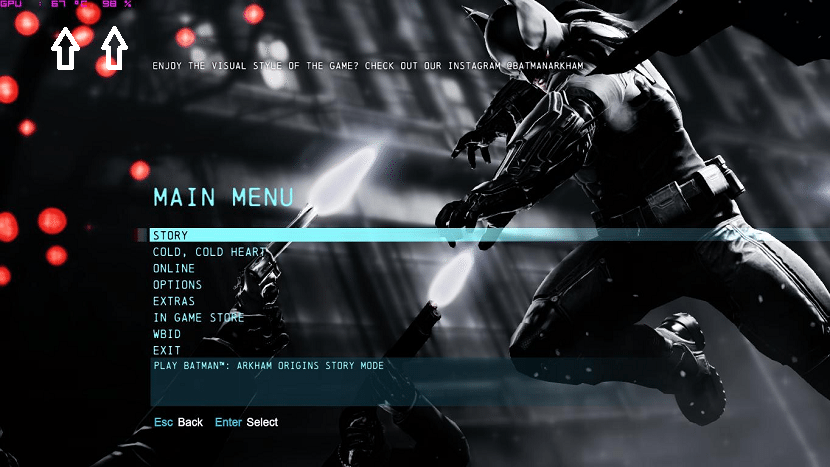
So now you have the GPU temperature and usage on screen, you should know that for this you must keep the MSI Afterburner and Rivatuner Statistic Server running, of course minimized would also do. So now that the GPU or you can say Part One is done, let’s move towards Part Two or CPU screening.
So once you’ve downloaded the HWinfo regarding to your OS bit-rate, open it. After opening, you would see something like this:
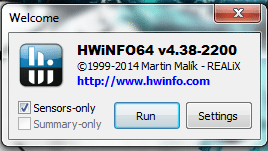
For our task we need the sensor-only, so put a check on it and press “run”.
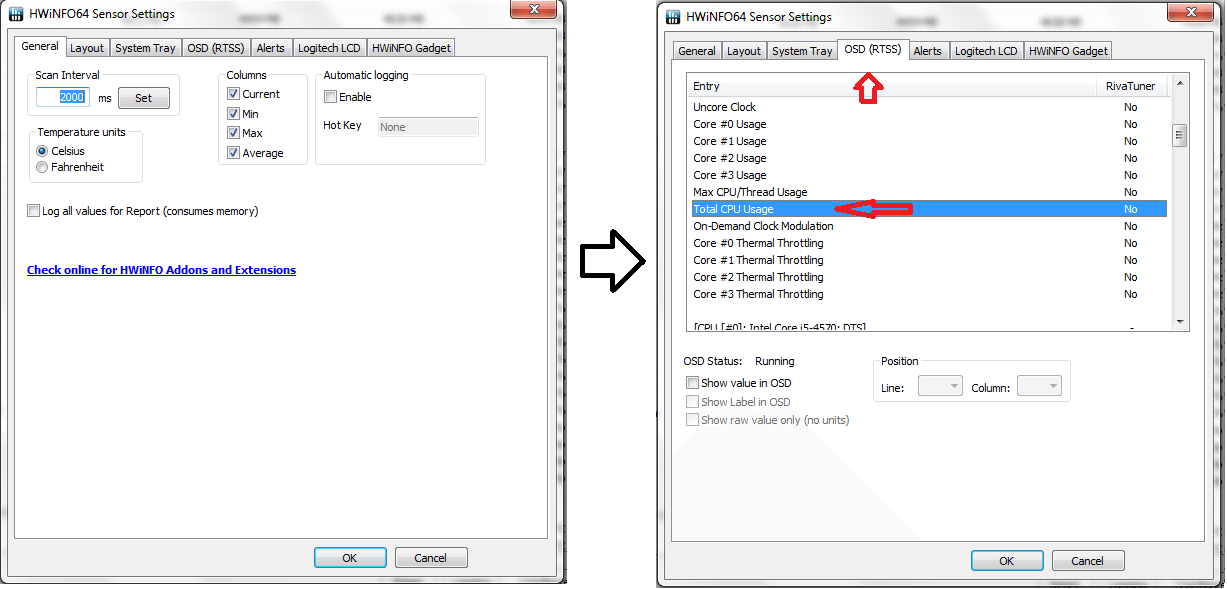
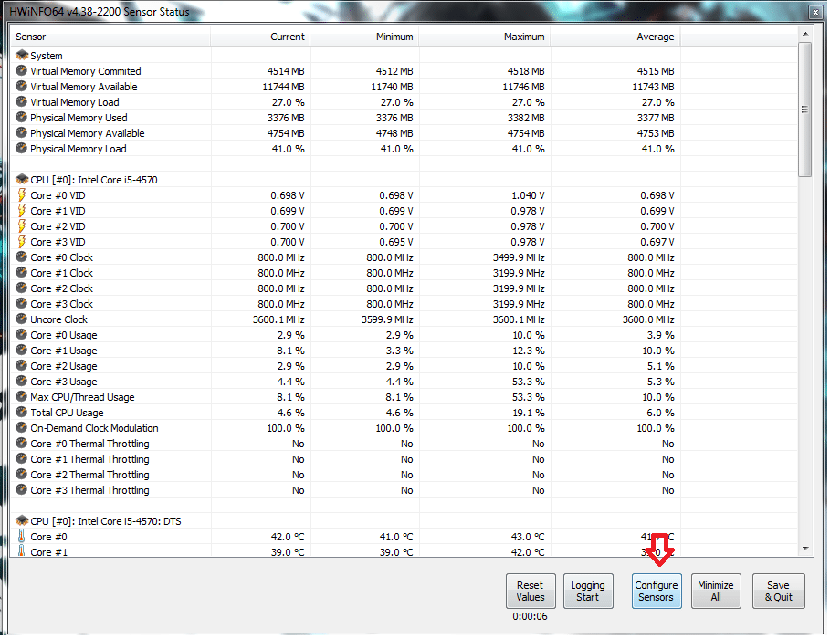
After loading a new window should open which would show the detailed information about your CPU. Well we don’t have to mess around with any other option than “Configure Sensor” so click it. Now another window shall open, head directly over to the “OSD (RTSS)” and find “Total CPU Usage” in the Entry table.
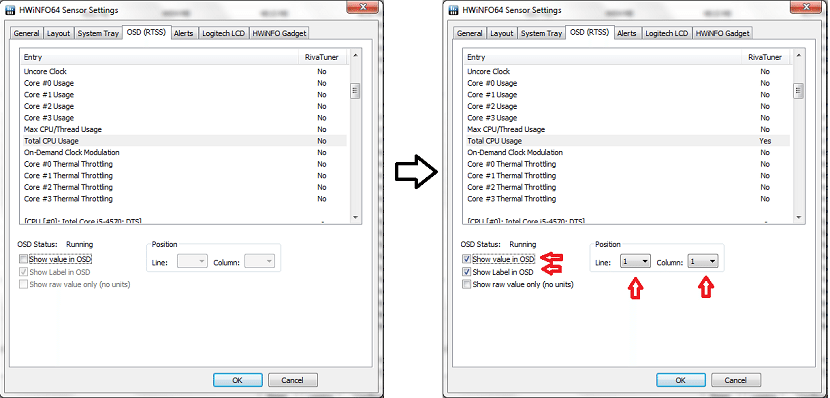
Once you’ve selected “Total CPU Usage” check the “Show value in OSD” and “Show Label in OSD”. Once checked, the portions named position should unlock. In the position section, as referred by name we are going to select the position of where the Total CPU Usage would be placed. Select line “1” and column”1″ which would place it directly under the GPU temperature and usage which we set using MSI Afterburner. You could give it different positions according to your comfort as well.
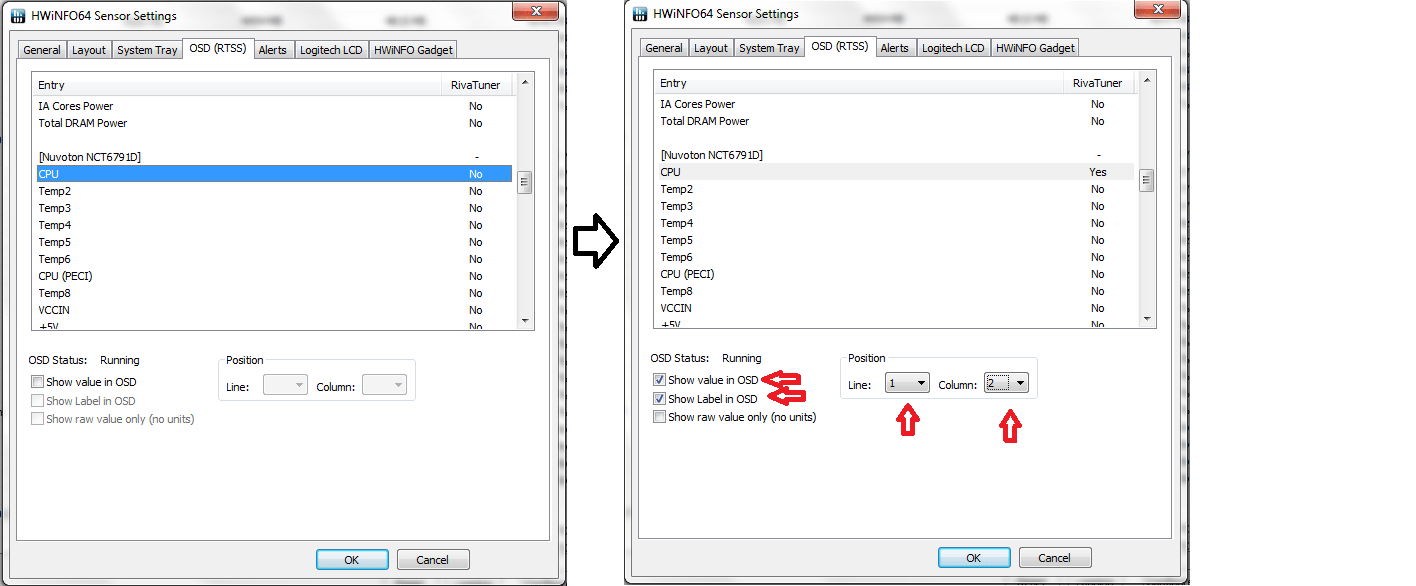
Now search “CPU” (referred for CPU temperature) which should be under “Nuvoton NCT#####” in the Entry Table. Once selected, again check the “Show value in OSD” and “Show Label in OSD”. Likewise select the position for CPU Temperature, let’s just place it at line “1” and column “2” which should place it right after the CPU Usage.
Once done press “OK” and you are all set, now you should be able to see both the temperature and usage of CPU and GPU. Result:
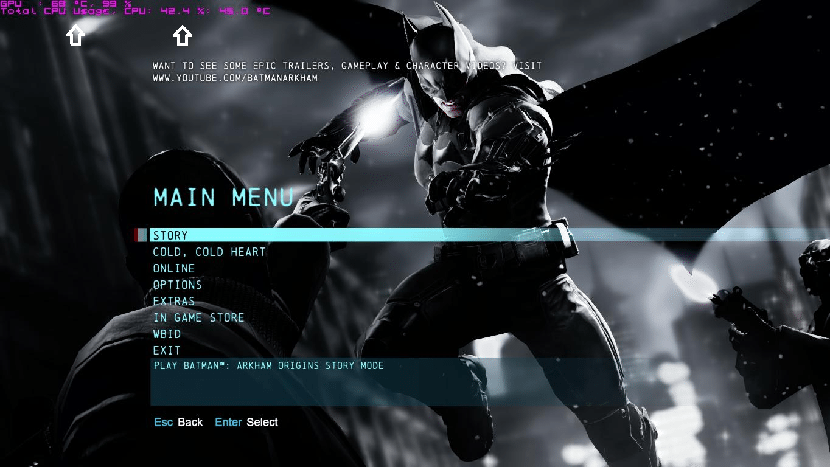
Looks so lengthy and awkward right?? Well what you can do and I have done is removed the checks from “Show Label in OSD” from both “CPU” and “Total CPU Usage”.
What it does is remove the names of both Total CPU Usage and CPU from the text and only shows the temperature and Usage of CPU. To remember that which line is for CPU and which one is for GPU just remember in most cases, CPU’s line comes under the GPU’s. And secondly GPU line already have “GPU” written in it, so you can’t mistake between both. Result:
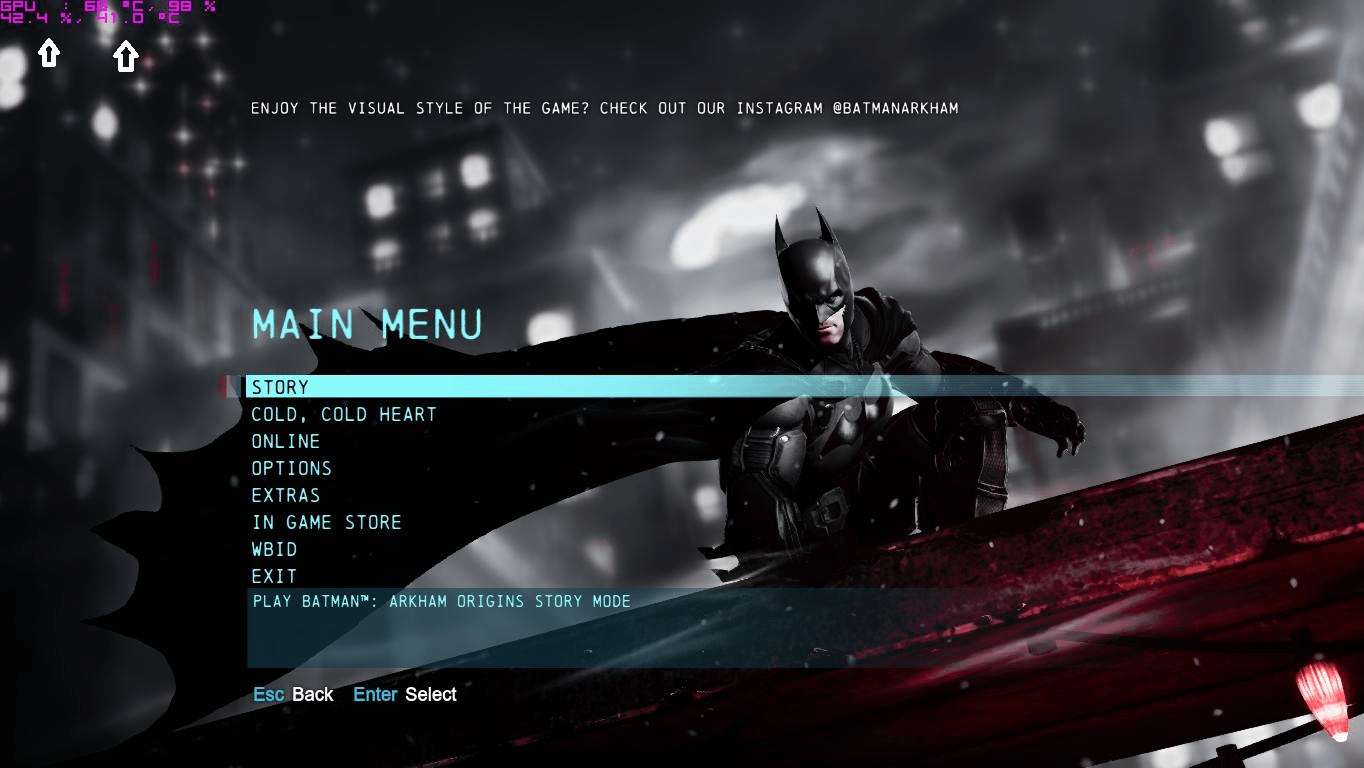
Better and comfy?? Well that is how you see the temperature and usage of CPU and GPU both at the same time while gaming, so no more need for pressing “Alt+TAB” while gaming and checking the temperatures manually. I hope this “How To” tutorial would be helpful for many so don’t forget to share among your friends. Need another tutorial or guide, let us know and we’ll try to produce it real quick. Got questions regarding any of the stuff mentioned, feel free to ask in comment sections.
We are influencers and brand affiliates. This post contains affiliate links, most which go to Amazon and are Geo-Affiliate links to nearest Amazon store.
Hi, I’m Ahmed Kazim and I’ve been a gaming freak since like 7-8. I’m also a geek-o-nerd who keeps looking around for latest development in hardware/tech/gadget industries so expect some quick news from me. I’m also interested in anime (Japanese animation) and can’t stand a day without music and gaming.