
We are influencers and brand affiliates. This post contains affiliate links, most which go to Amazon and are Geo-Affiliate links to nearest Amazon store.
A time comes when you need a video card, upgrading from on chip/die/bcrooard GPU, upgrading your existing video card or maybe replacing and existing video that might have died, the time comes for us all. The type of GPU/Video card you buy can depend on a few things like your budget, preference or functionality and I might have something that might fit on a few of those lists. Today I bring you my review of the Sapphire Radeon PULSE RX550 11268-01-20G video card.
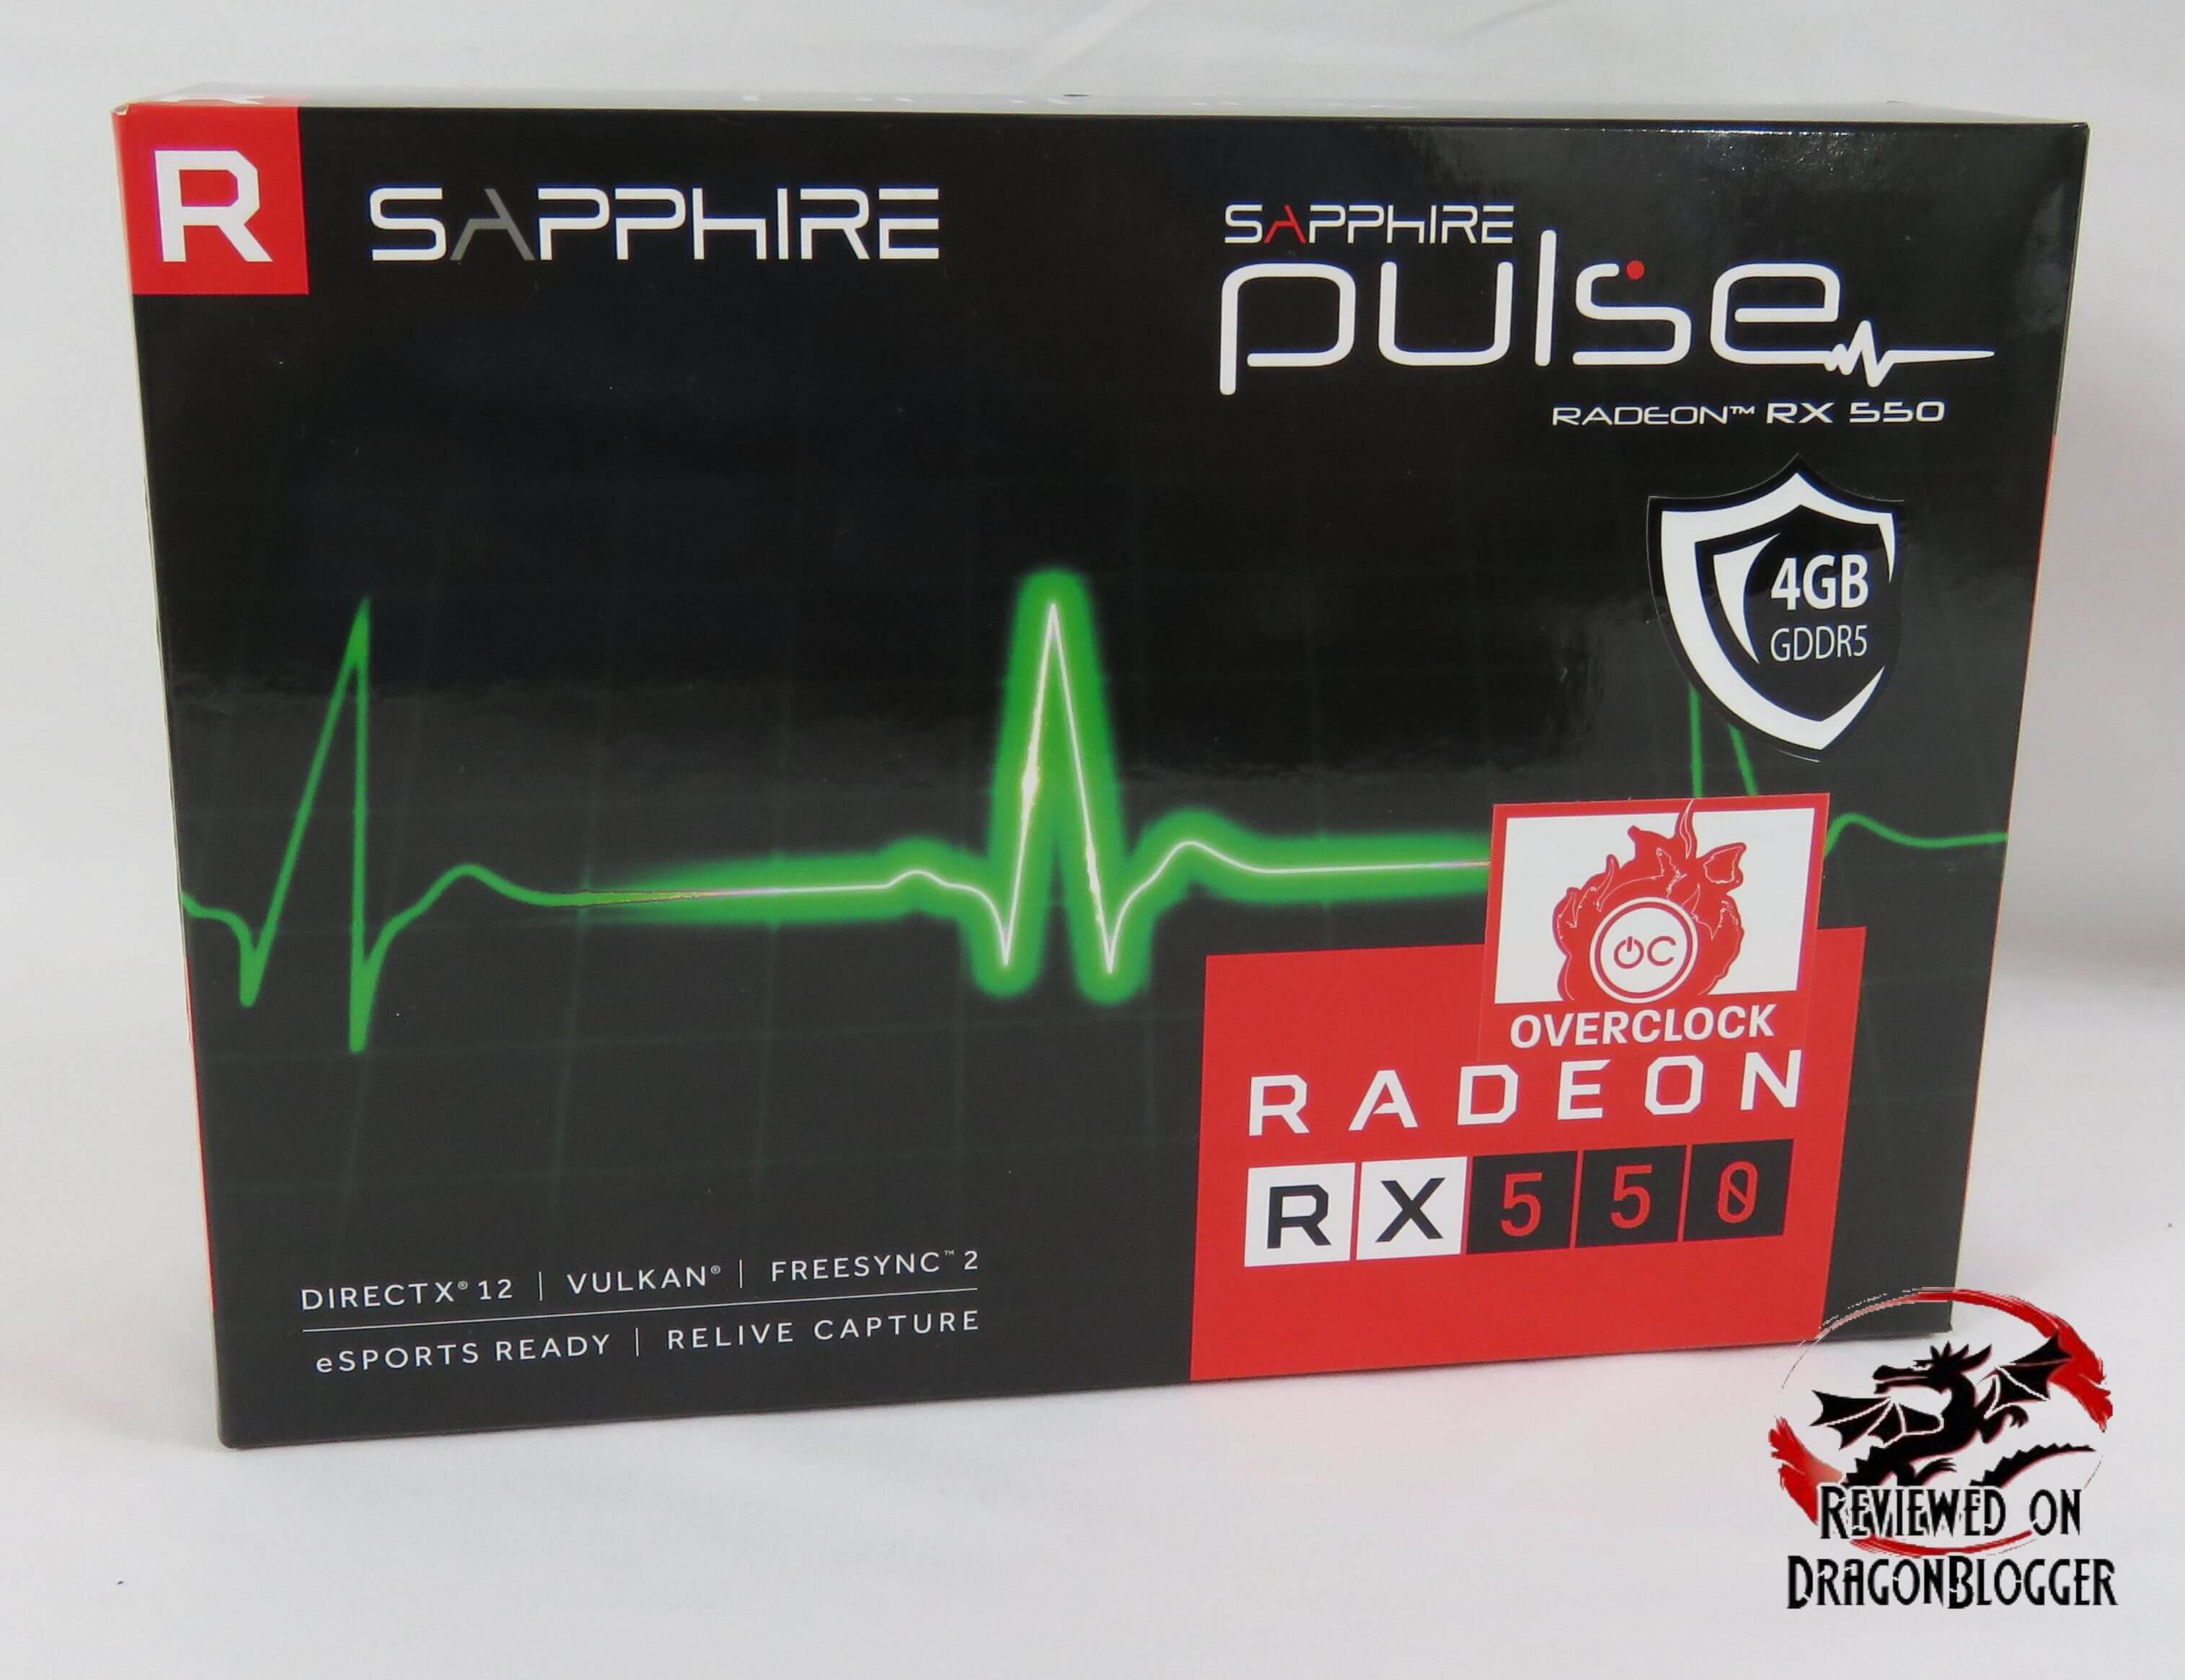
This is a budget video card from our friends at Sapphire based off AMD’s latest GPU series still on the Polaris line, though refined and evolved as AMD states. So let’s check out the features and specifications.
Specifications and Features
- Engine Clock: 1175Mhz
- Boost Engine Clock: 1206 (Seems to always run at this speed though)
- 4096MB GDDR5 128-bit RAM
- 1750Mhz
- 7000Mhz Effective Memory Frequency
- Compute Shaders: 512
- 3 Output Maximum
- 1 x DVI-D
- 1 x HDMI 2.0b
- 1 x Display Port 1.4
- Resolutions Supported
- DVD-D
- 2560 x 1600 (60Hz)
- HDMI 2.0b
- 3840 x 2160p (60Hz)
- Display Port
- 3840 x 2160 (120Hz)
- Supported API’s:
- OpenGL 4.5
- OpenCL 2.0
- DirectX 12
- Shader Model 5.0
- Vulkan API
- Supported Features
- Power Consumption: 65Watts
- System Requirements
- 400Watt Power Supply
- Windows 10, 8.1, 8 or 7
- Form Factor
- DVD-D
- Length: 6.22in
- Width: 4.41in
- Depth: 1.10in
- 1750Mhz
OK, before we talk anymore on the card, let’s check out an unboxing.
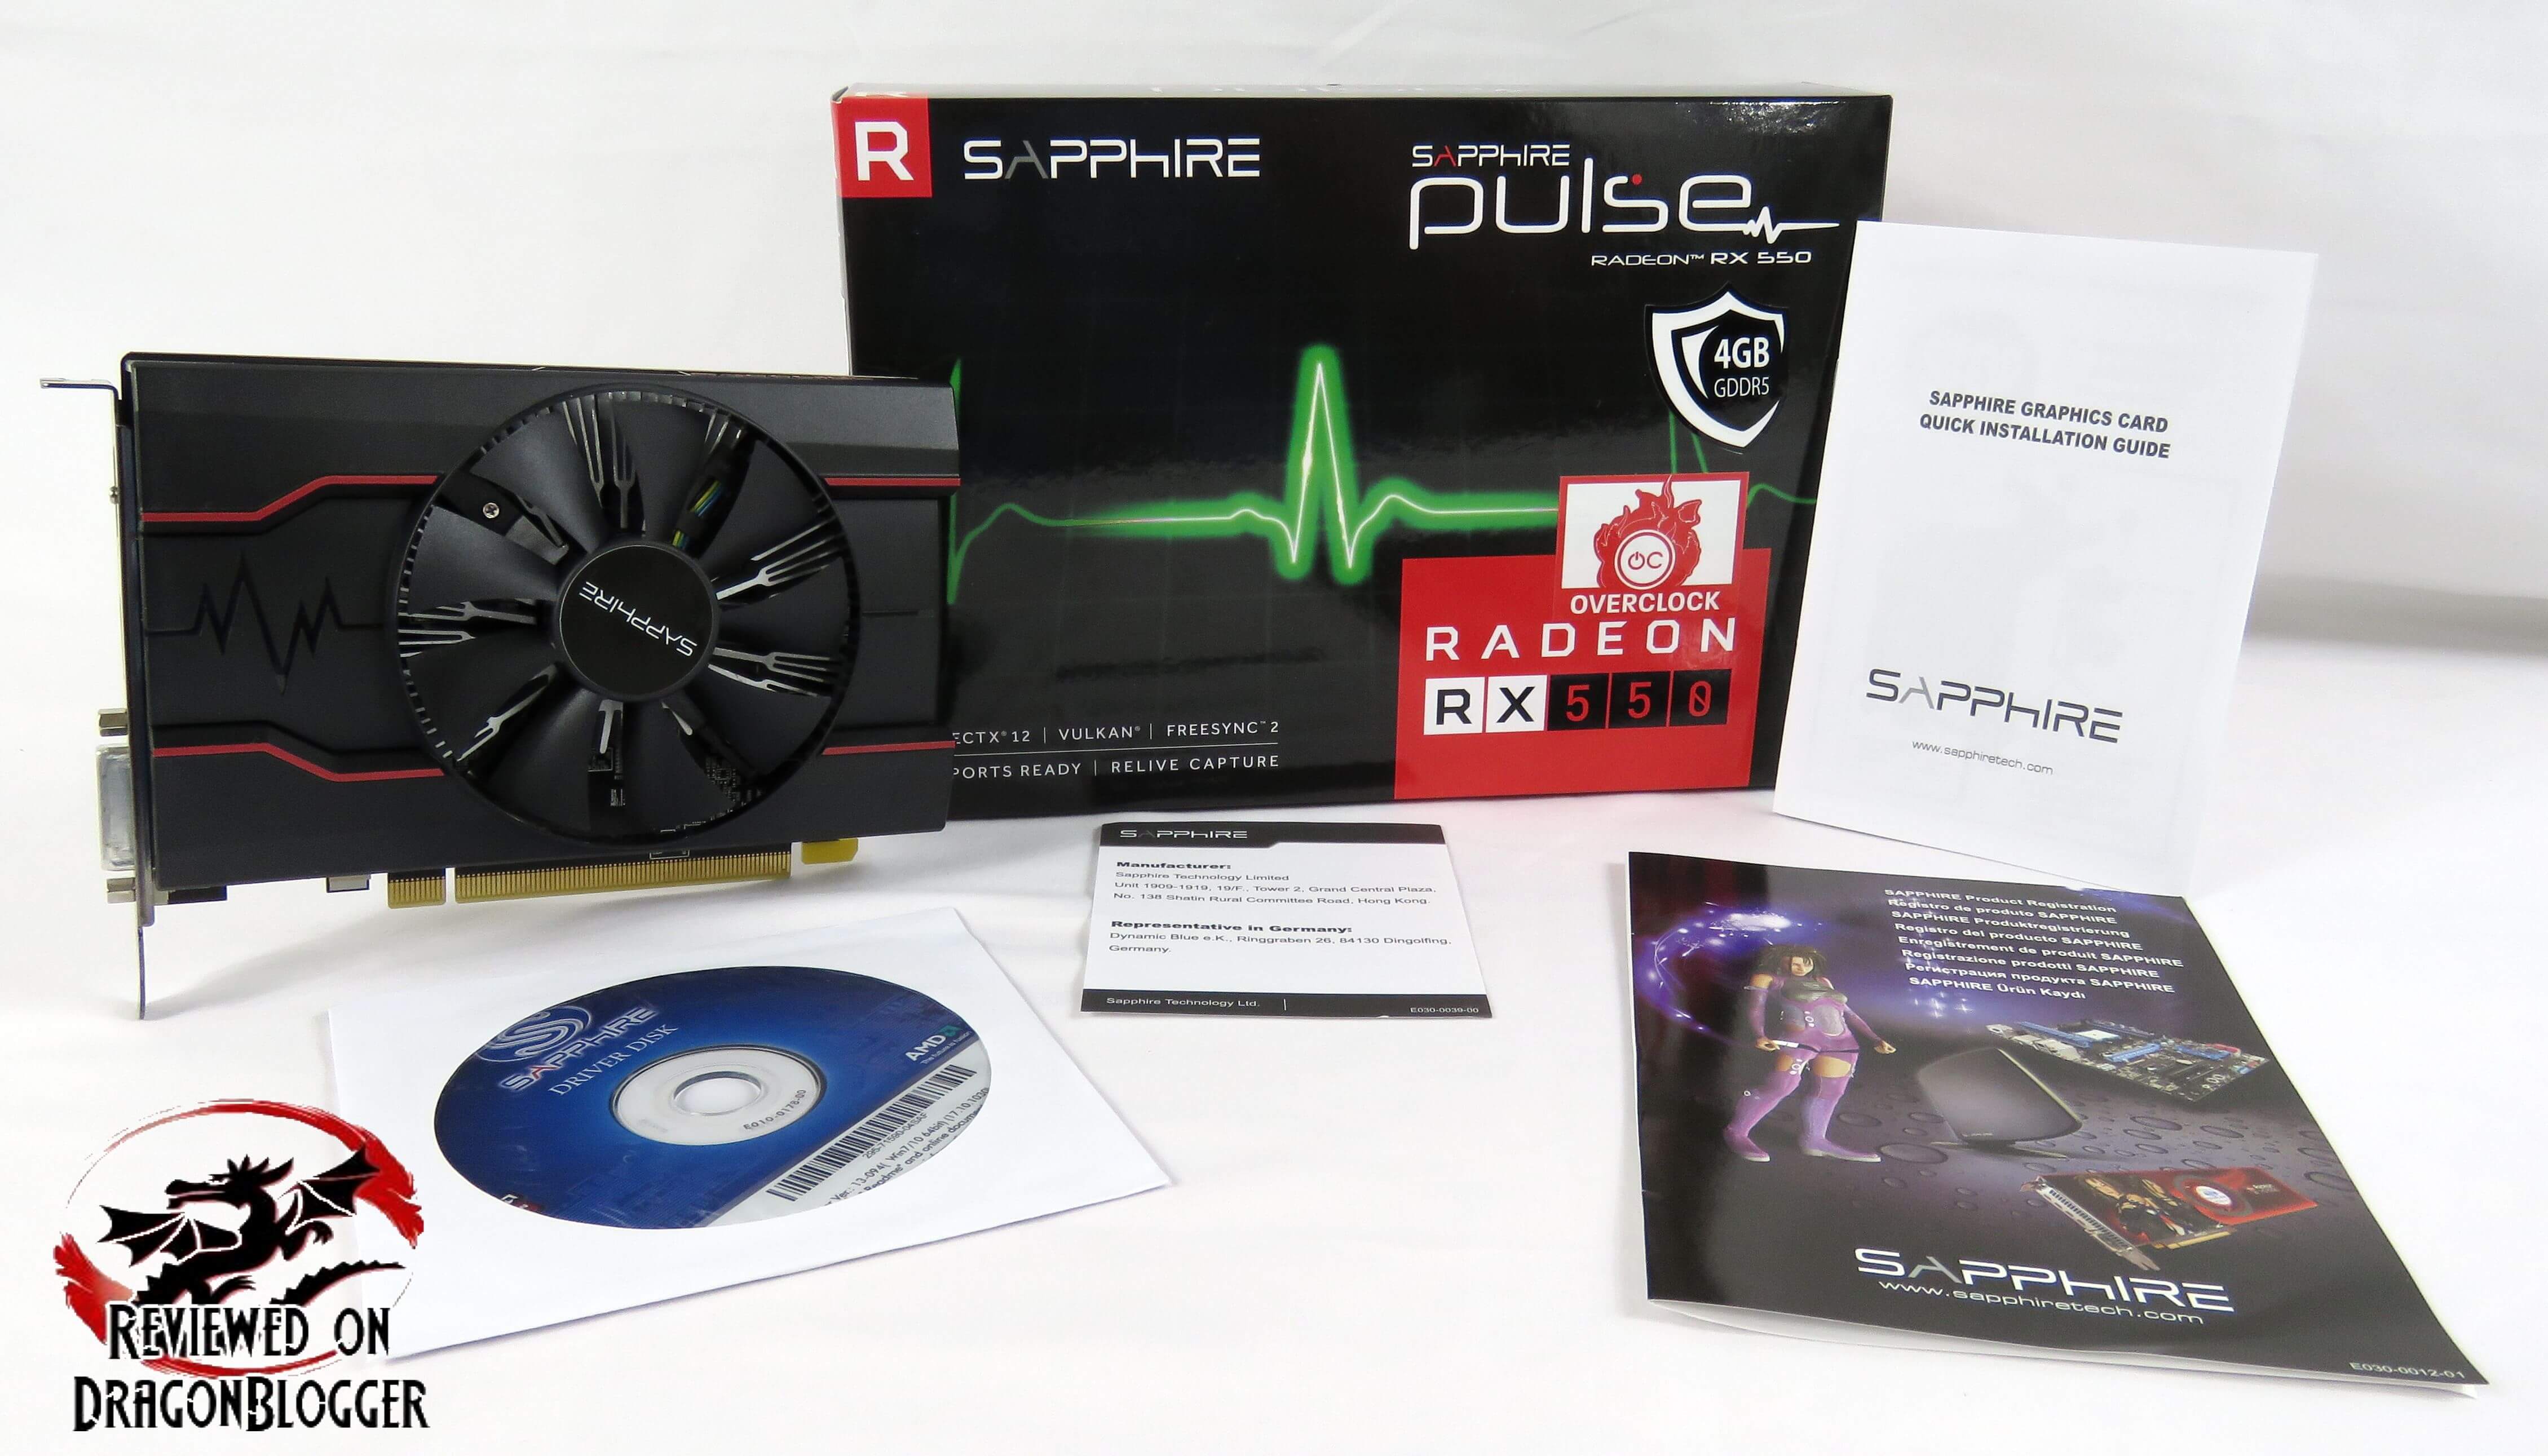
Before we get to the card, let’s check out what comes inside of the box.

This Quick Installation Guide shows you basics on how to install the card, though I will a little later on in this review have a video showing you how to install it.

In this pamphlet, we have the production registration card. Unlike most product registration cards, this actually has the serial number of your card already pasted in there so if something happens, you don’t have to take the card out to look for it.

This sheet gives you manufacturer information.
Lastly, the drivers disc. I only recommend using this if you do not have an internet connection or maybe a very slow one if you are excited to jump into it. I state this because the minute this disk is printed, the drivers are outdated, and the updates greatly improve performances and gameplay within games.
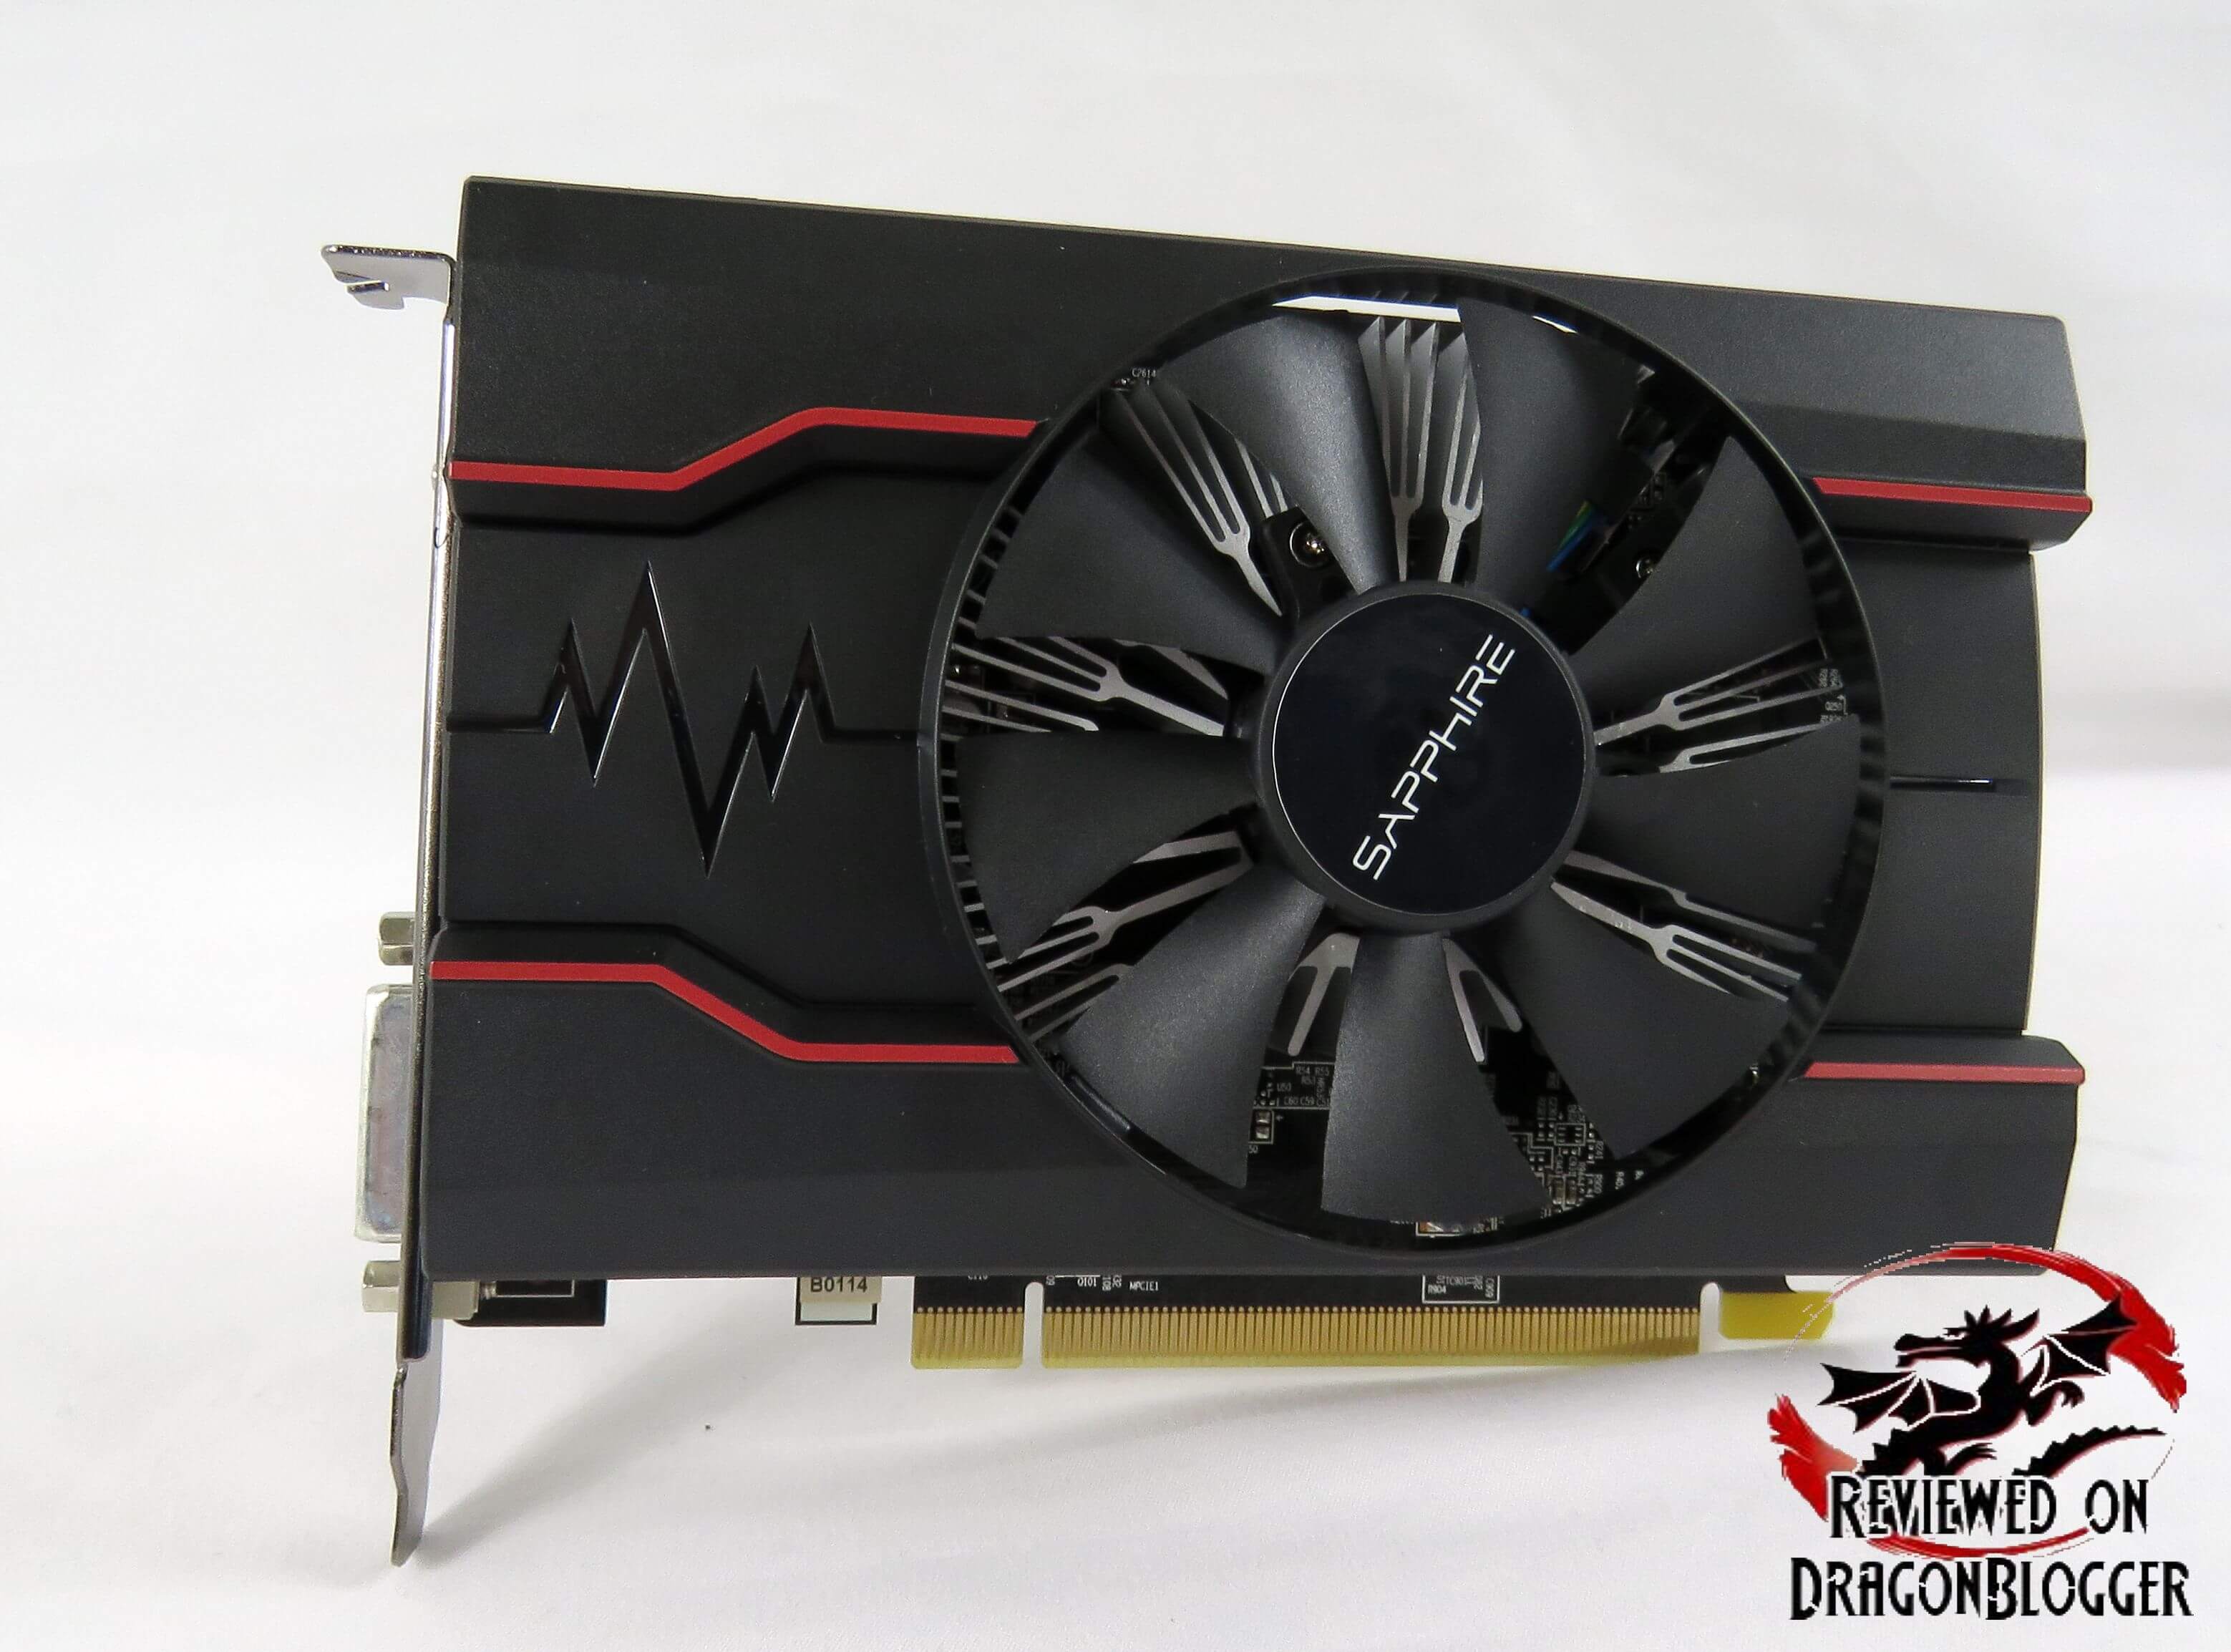
And here is the card itself. It is a tiny little thing, only 6.22 inches long, but don’t worry it’s not about the size of the card but how you use it.
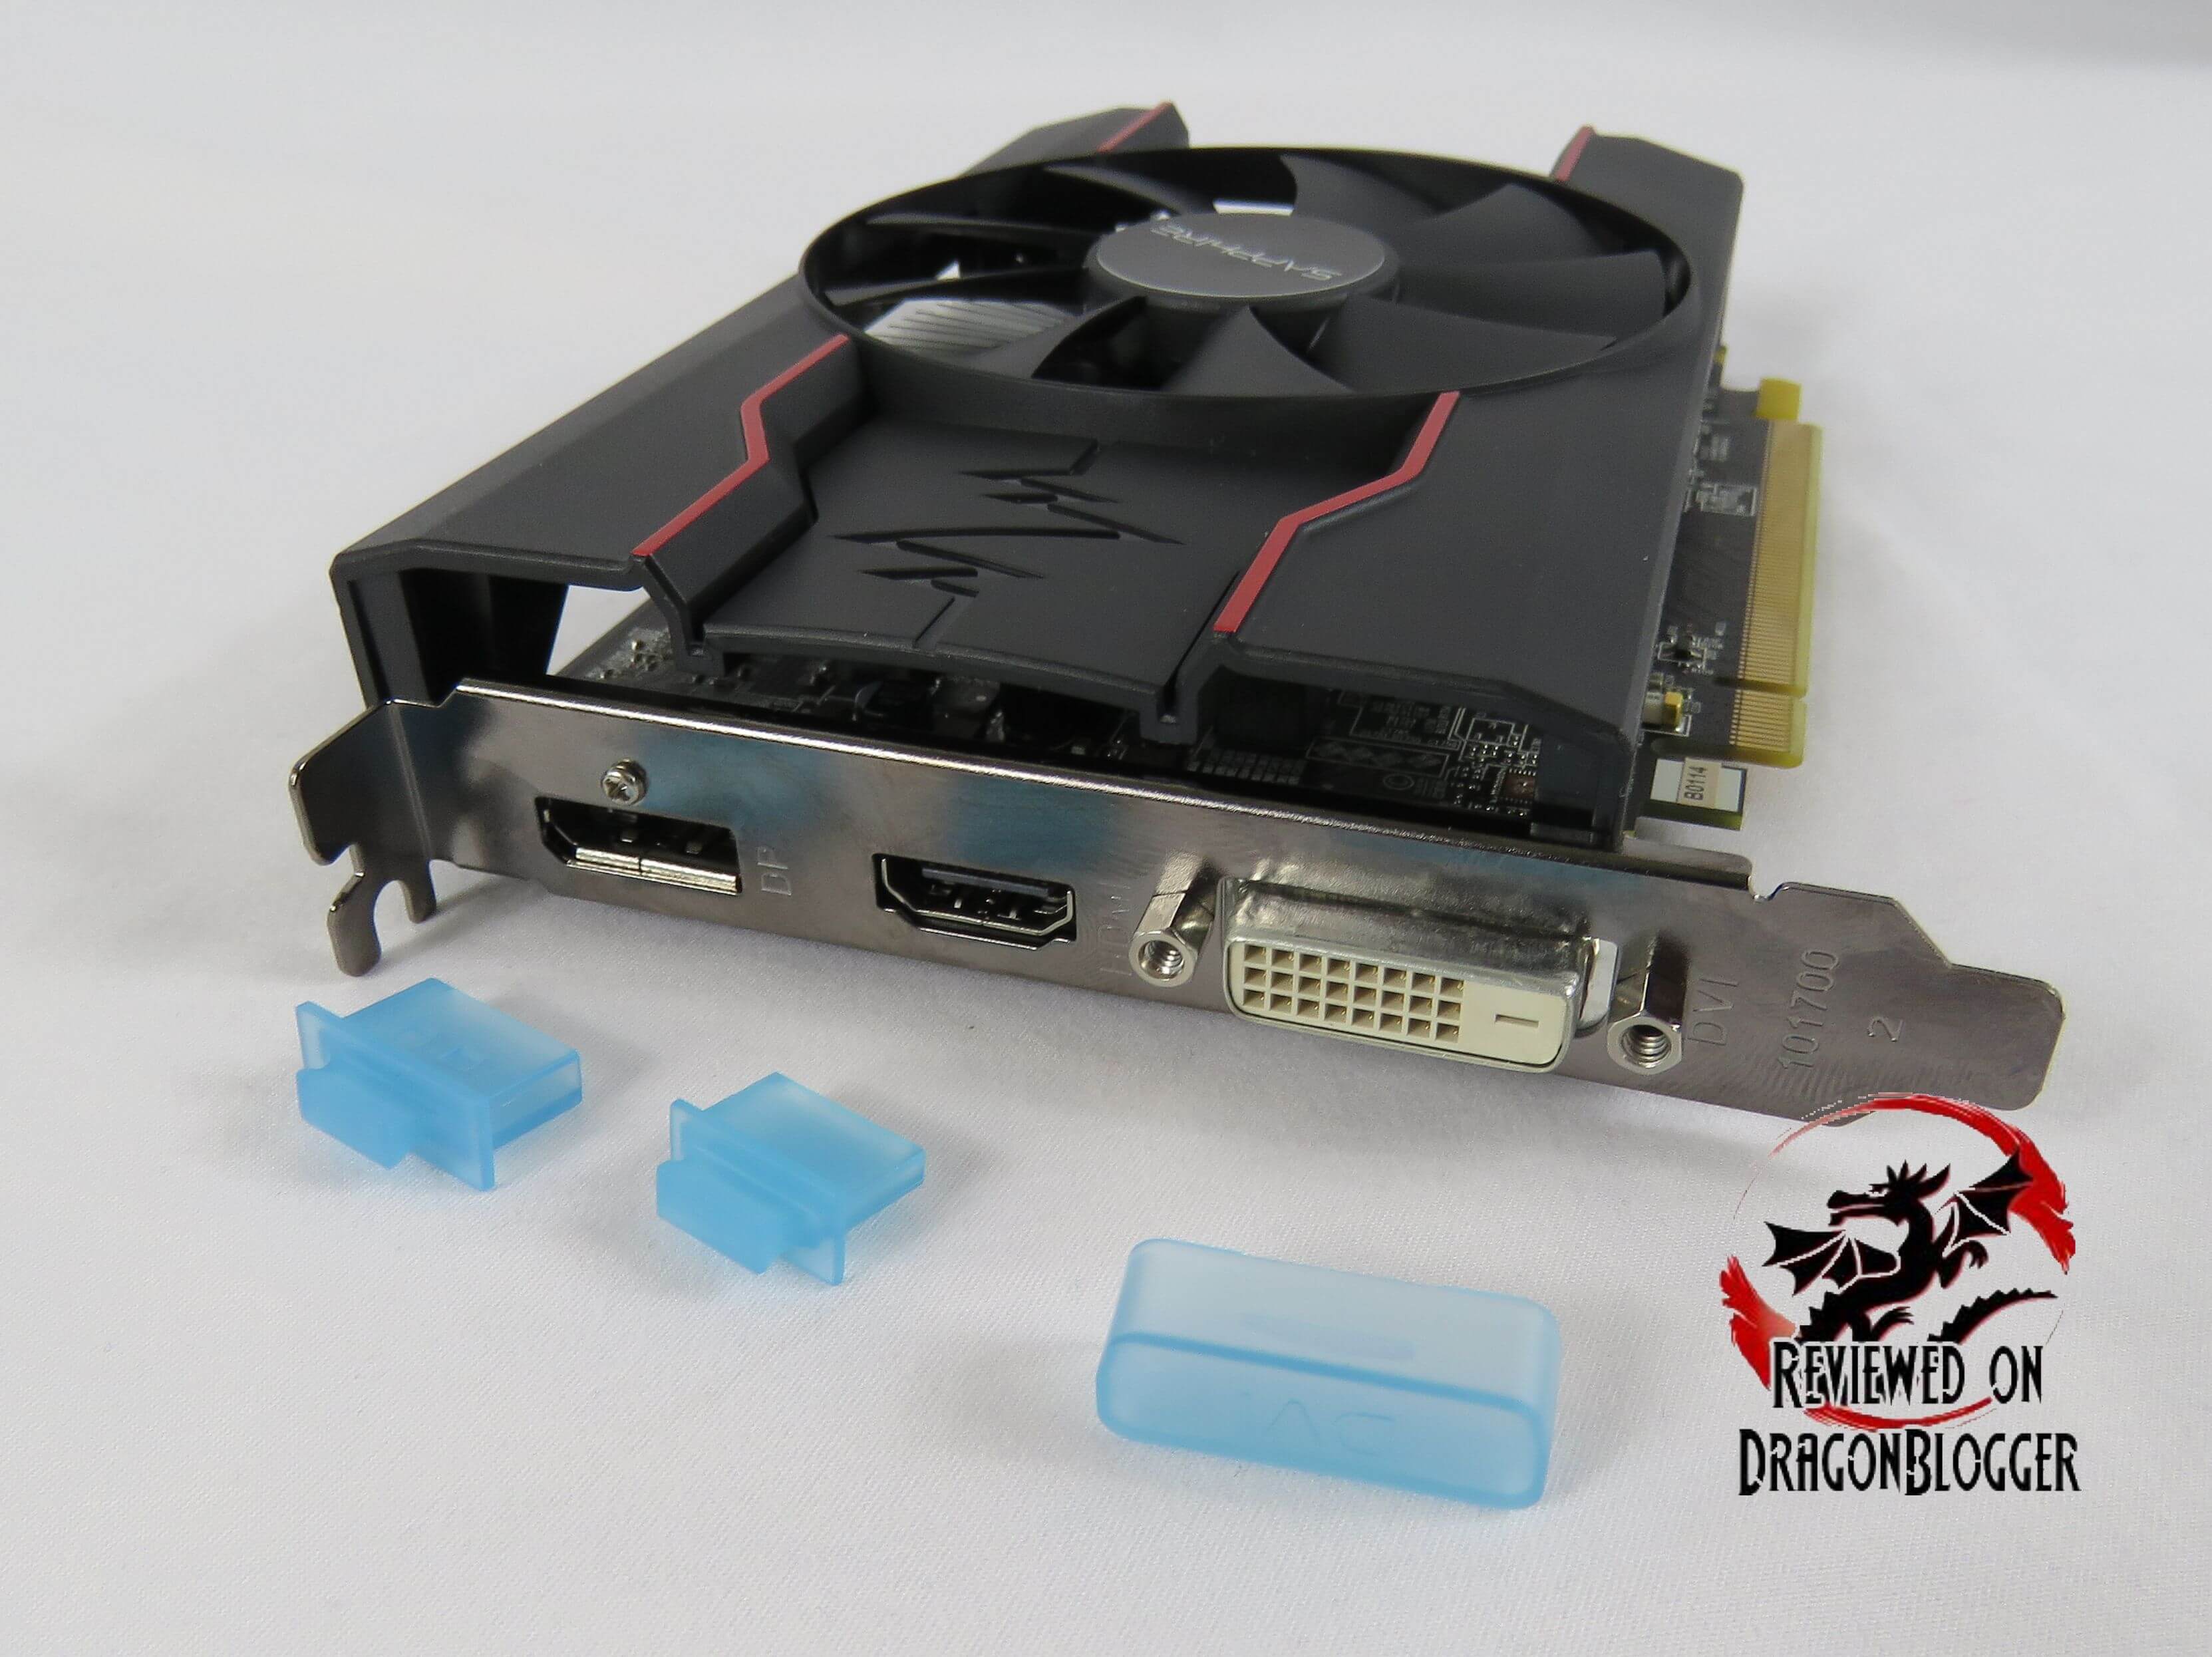
Here we can see the outputs, 1 x Display Port (DP), 1 x HDMI and 1 x DVI. There are no VGA ports which may not be a bad thing for many, and it also does not bring an adapter.
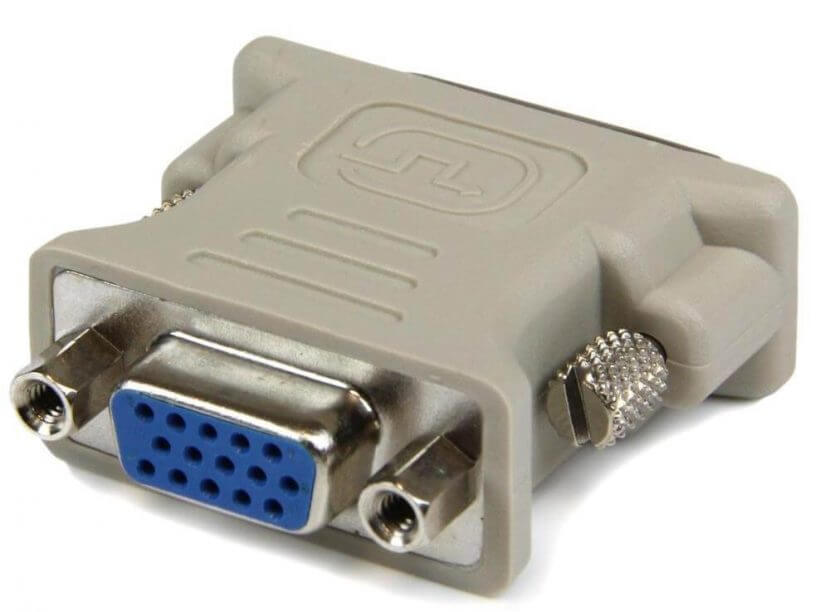
If you do need an adapter, you can click on the adapter pictured above and it will take you to Amazon’s site where you can get one.
Now let’s get to discovering the card a little more
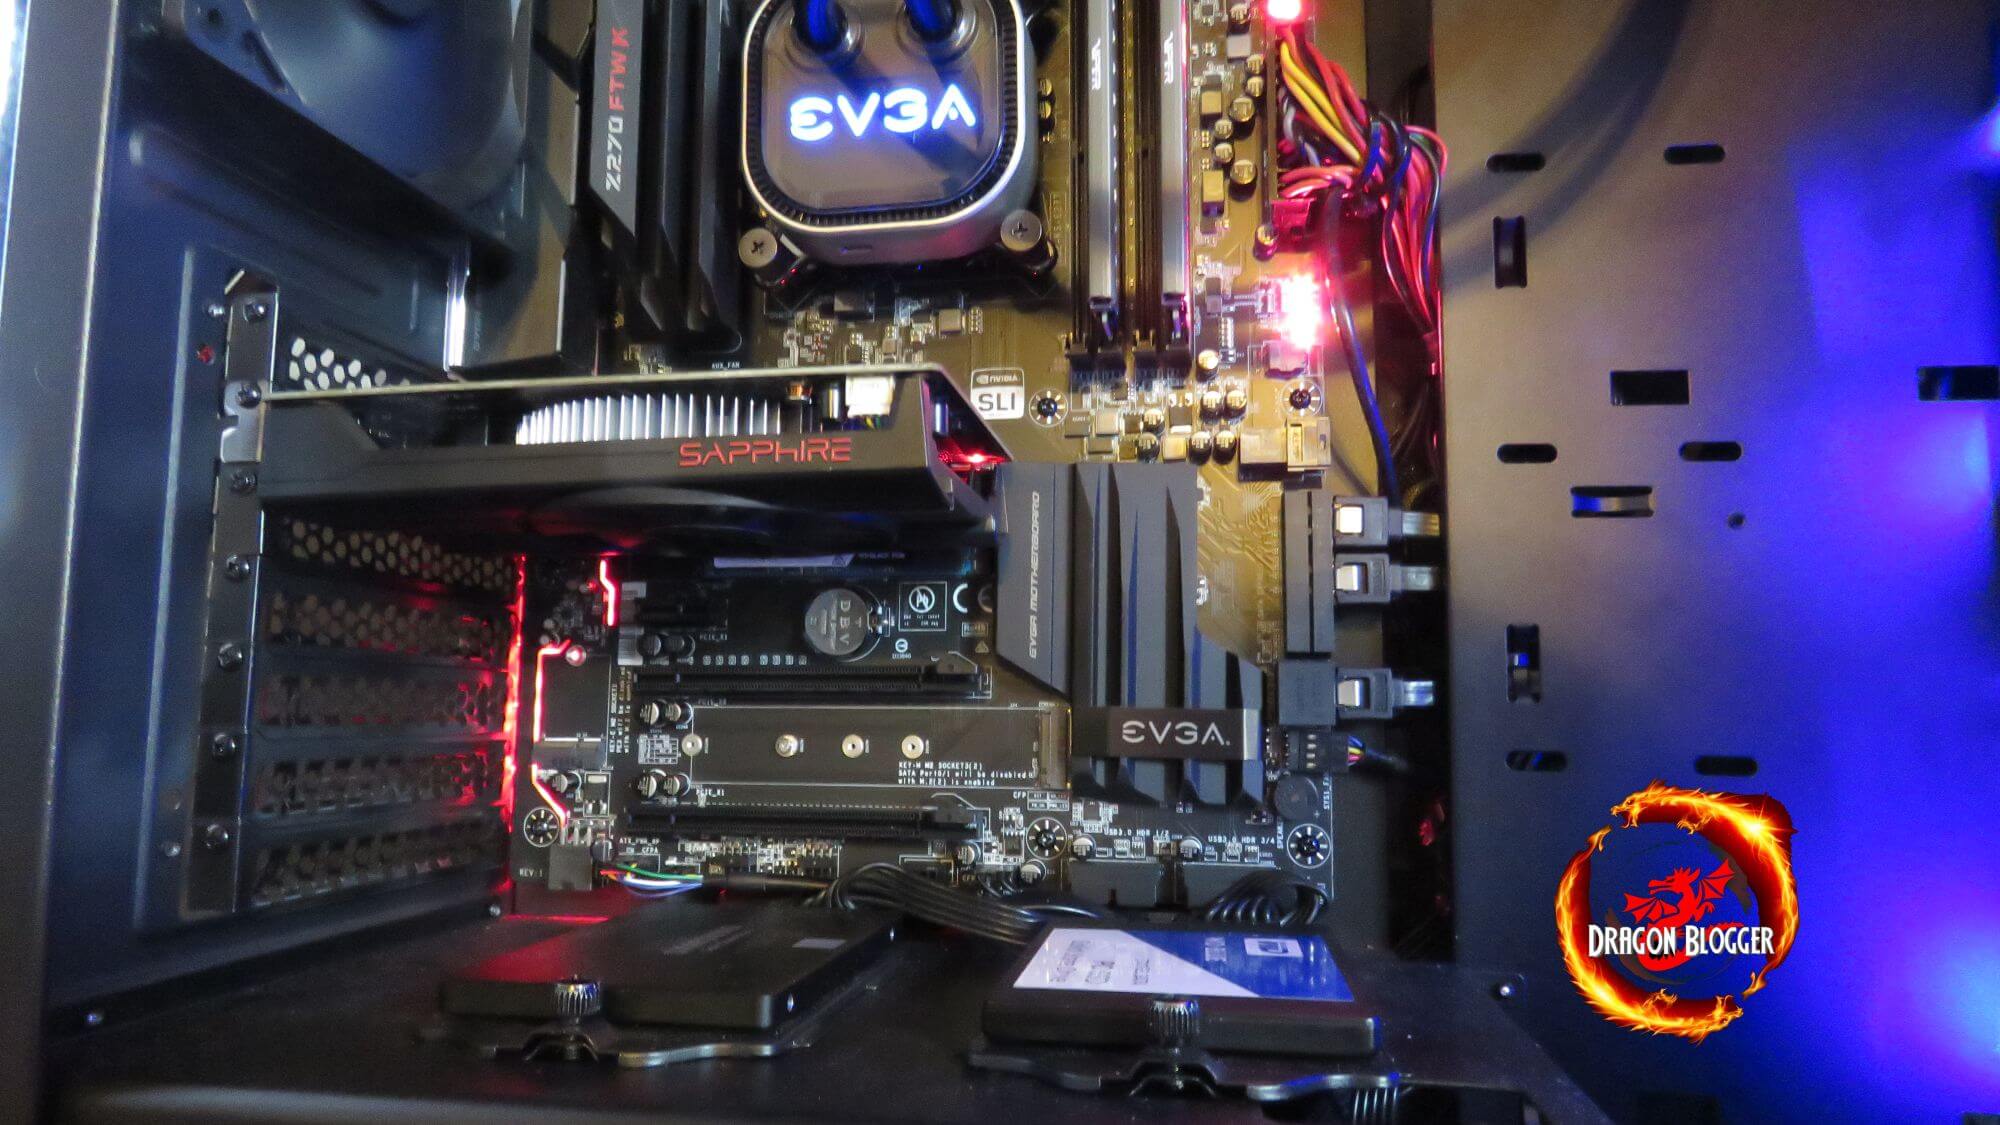
Coming around to the right, we can see the front of the card (even though it is the side). While the card does have a plastic housing, it is almost completely opened on the side so it will be expelling all of the heat into the case. Mostly if you have a system that has remotely decent cooling, you will be fine with this. You can see the SAPPHIRE logo on the bottom right hand corner, and just above that the 4 PIN connection that powers the GPU fan.
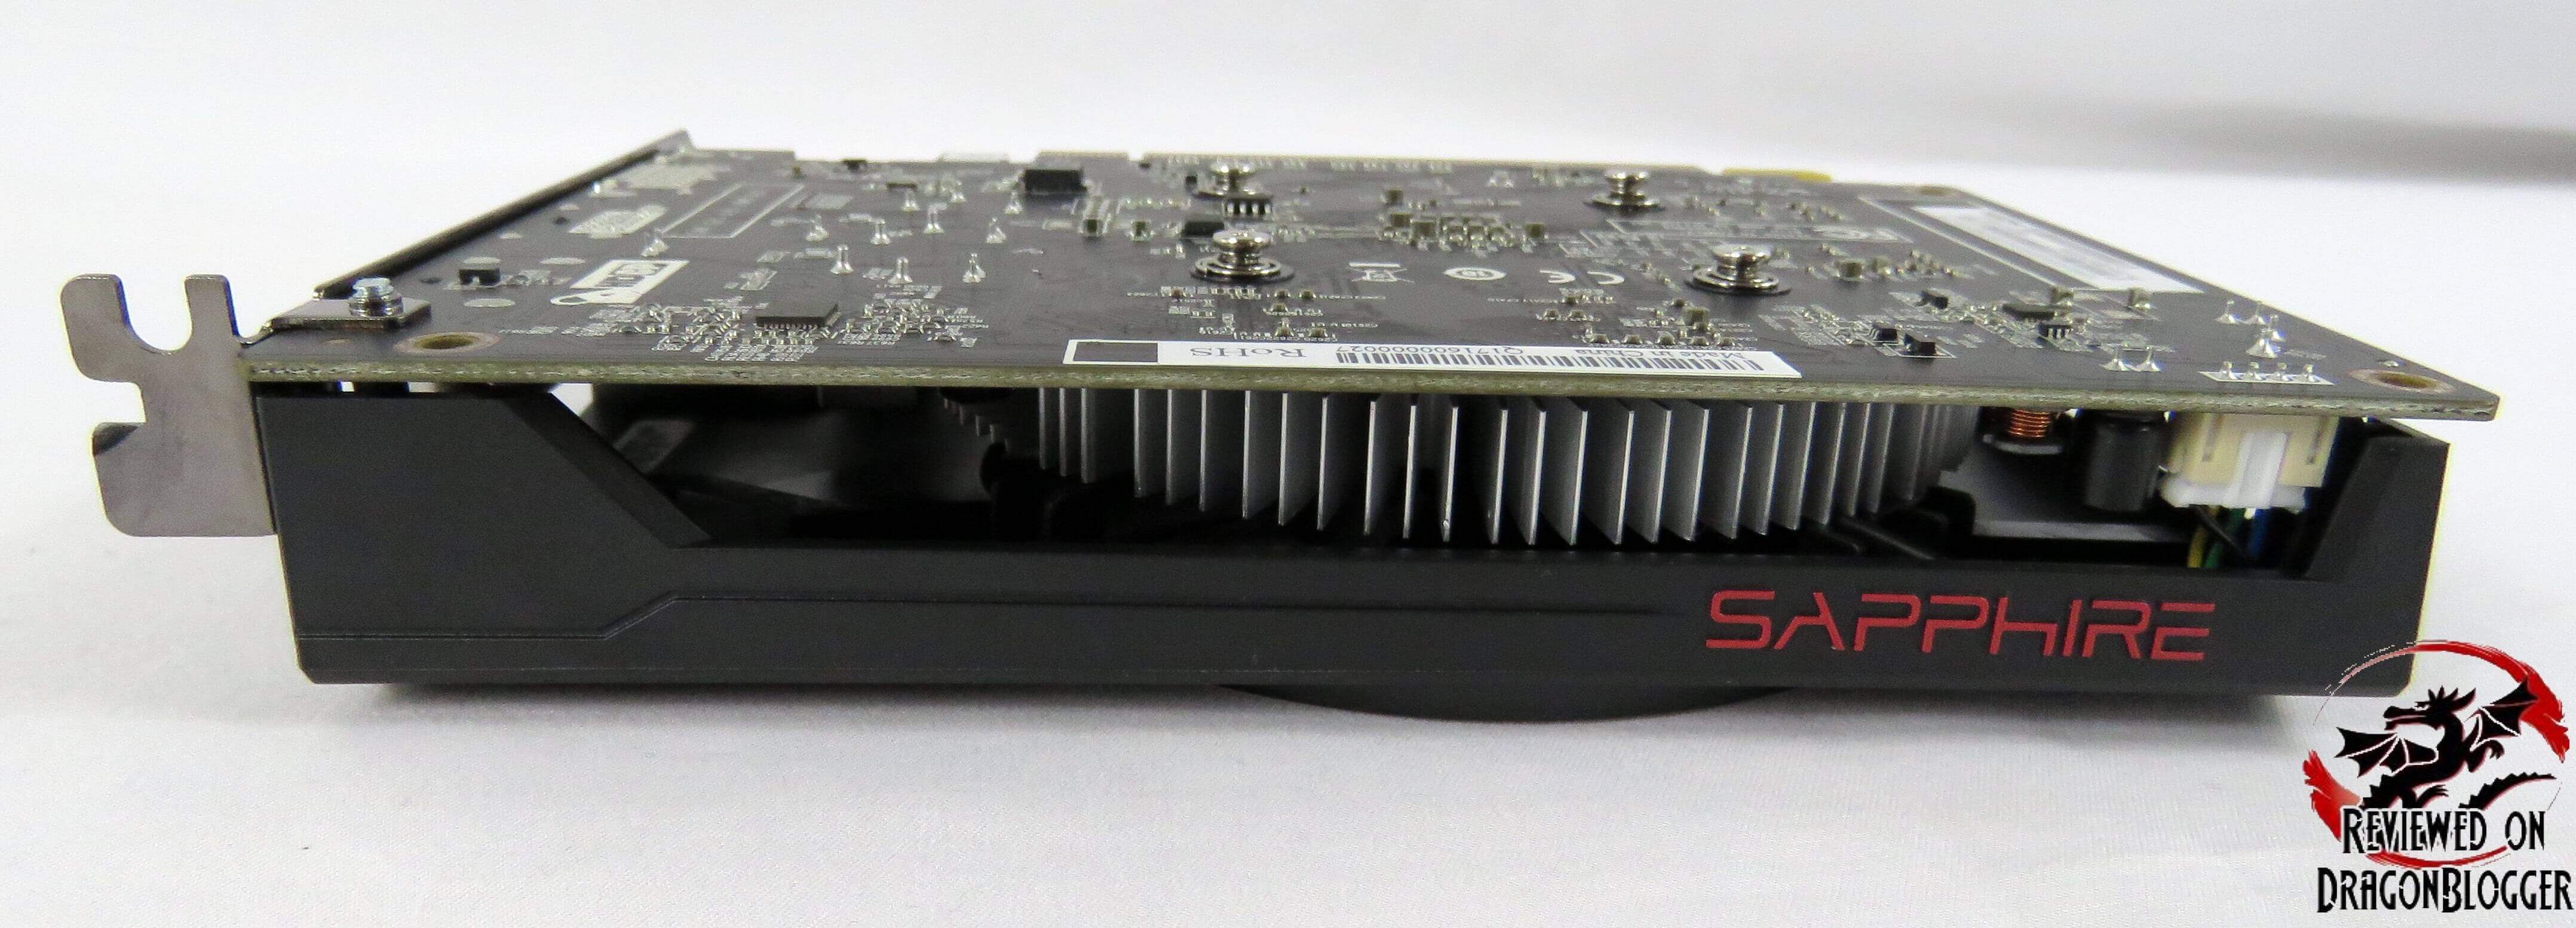
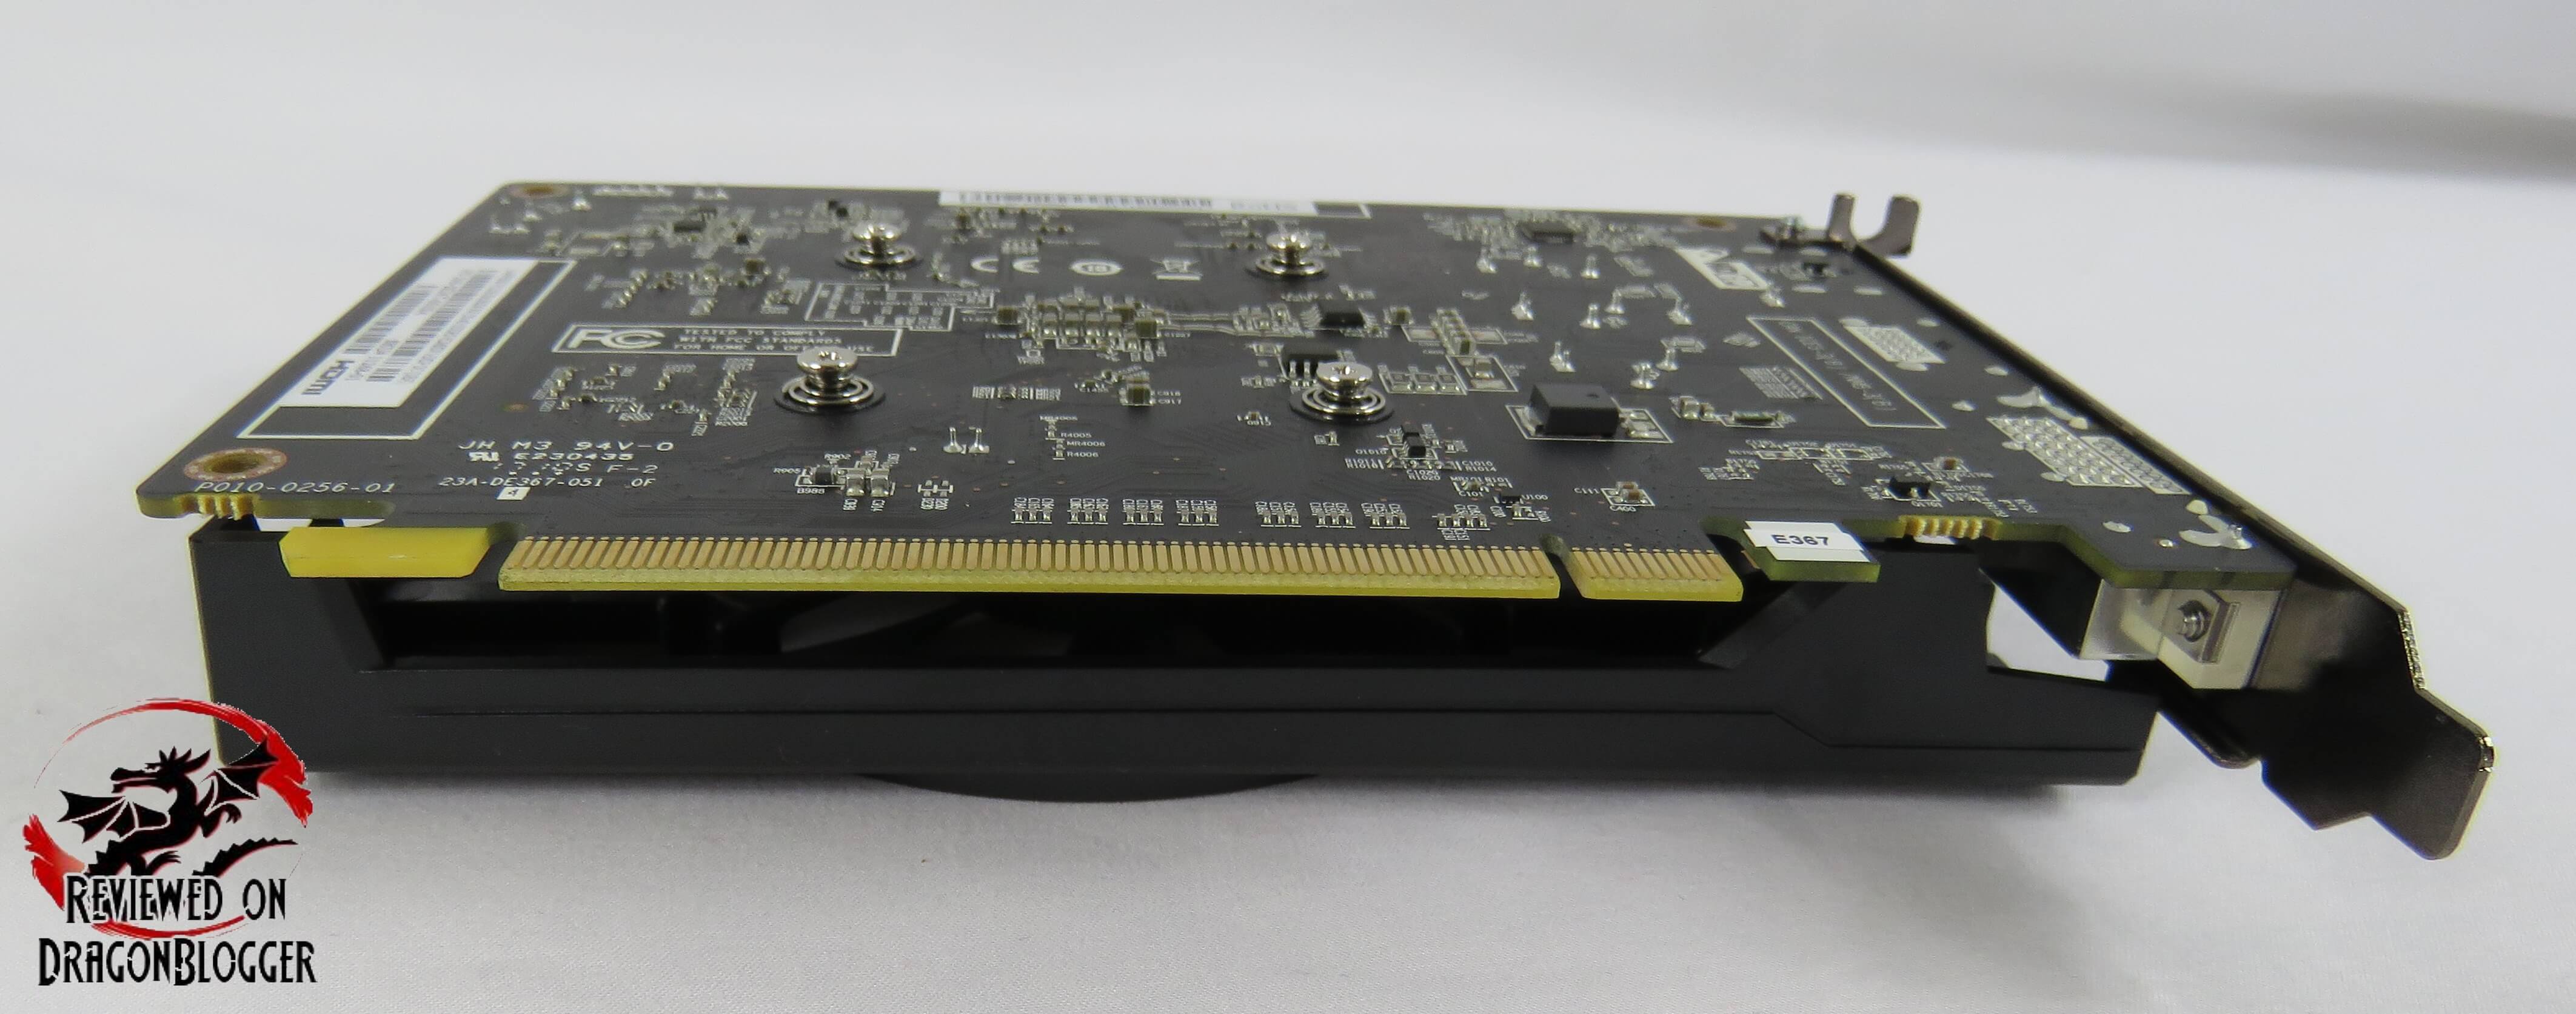
Around the back of the card, we can see there is no additional power connector. There is no 6Pin or 8Pin connector, so that means it is using the PCI-e slots power, all 75Watts. Well, not completely true, while the PCIe slot does provide 75Watts, the card only utilizes 65Watts which is why it only requires a 400Watt power supply, the rest of for your entire system.
The rear of the card, like the side is also opened up to allow heat to expel from the rear.
A little more to the right, we find the PCIe connection.
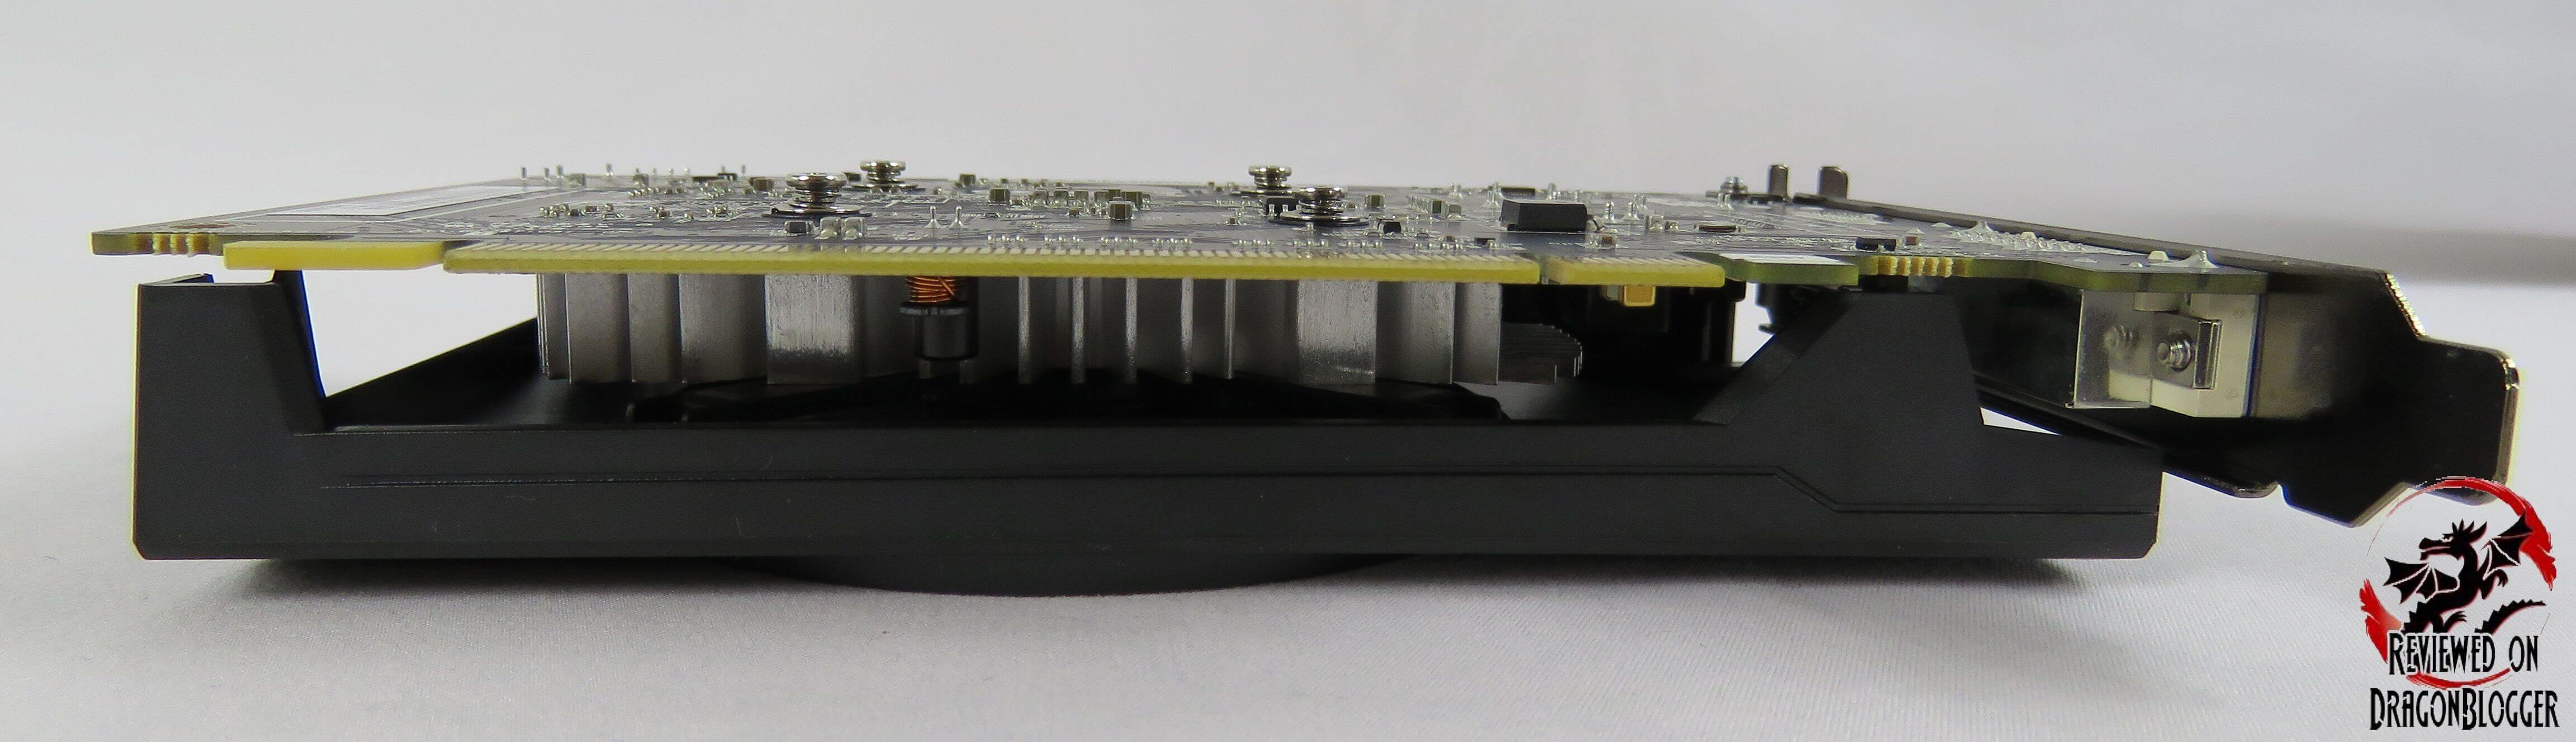
We can also see this side is also exposed. So the card expels heat from all sides of the card.
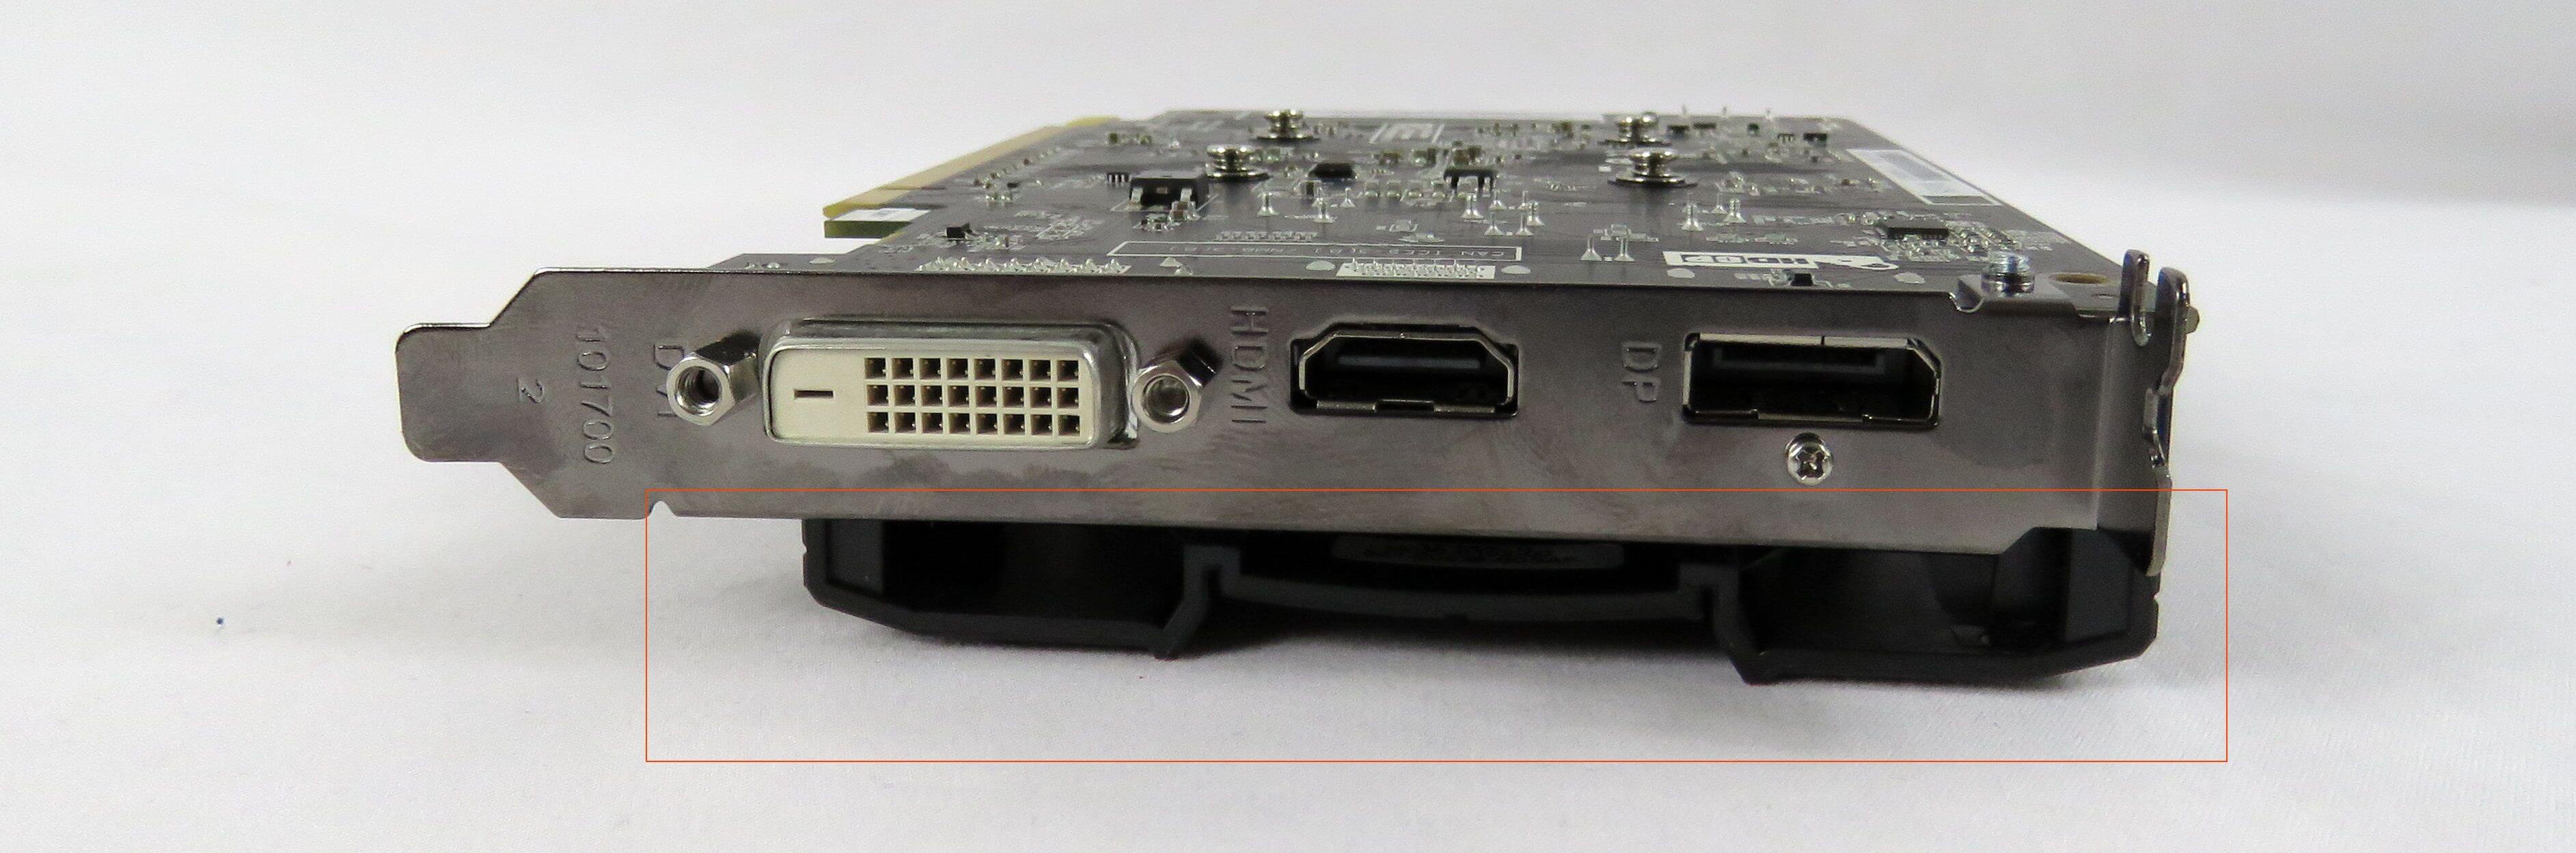
Around the front of the card, where you plug in the monitors, you can see highlighted in red that this also expels heat, so there is no real pressure but it may not be needed. The fact that it does not build pressure also helps to achieve Sapphires Cool & Quiet technology but we don’t know just yet how cool and quiet it really is, but we will see soon.
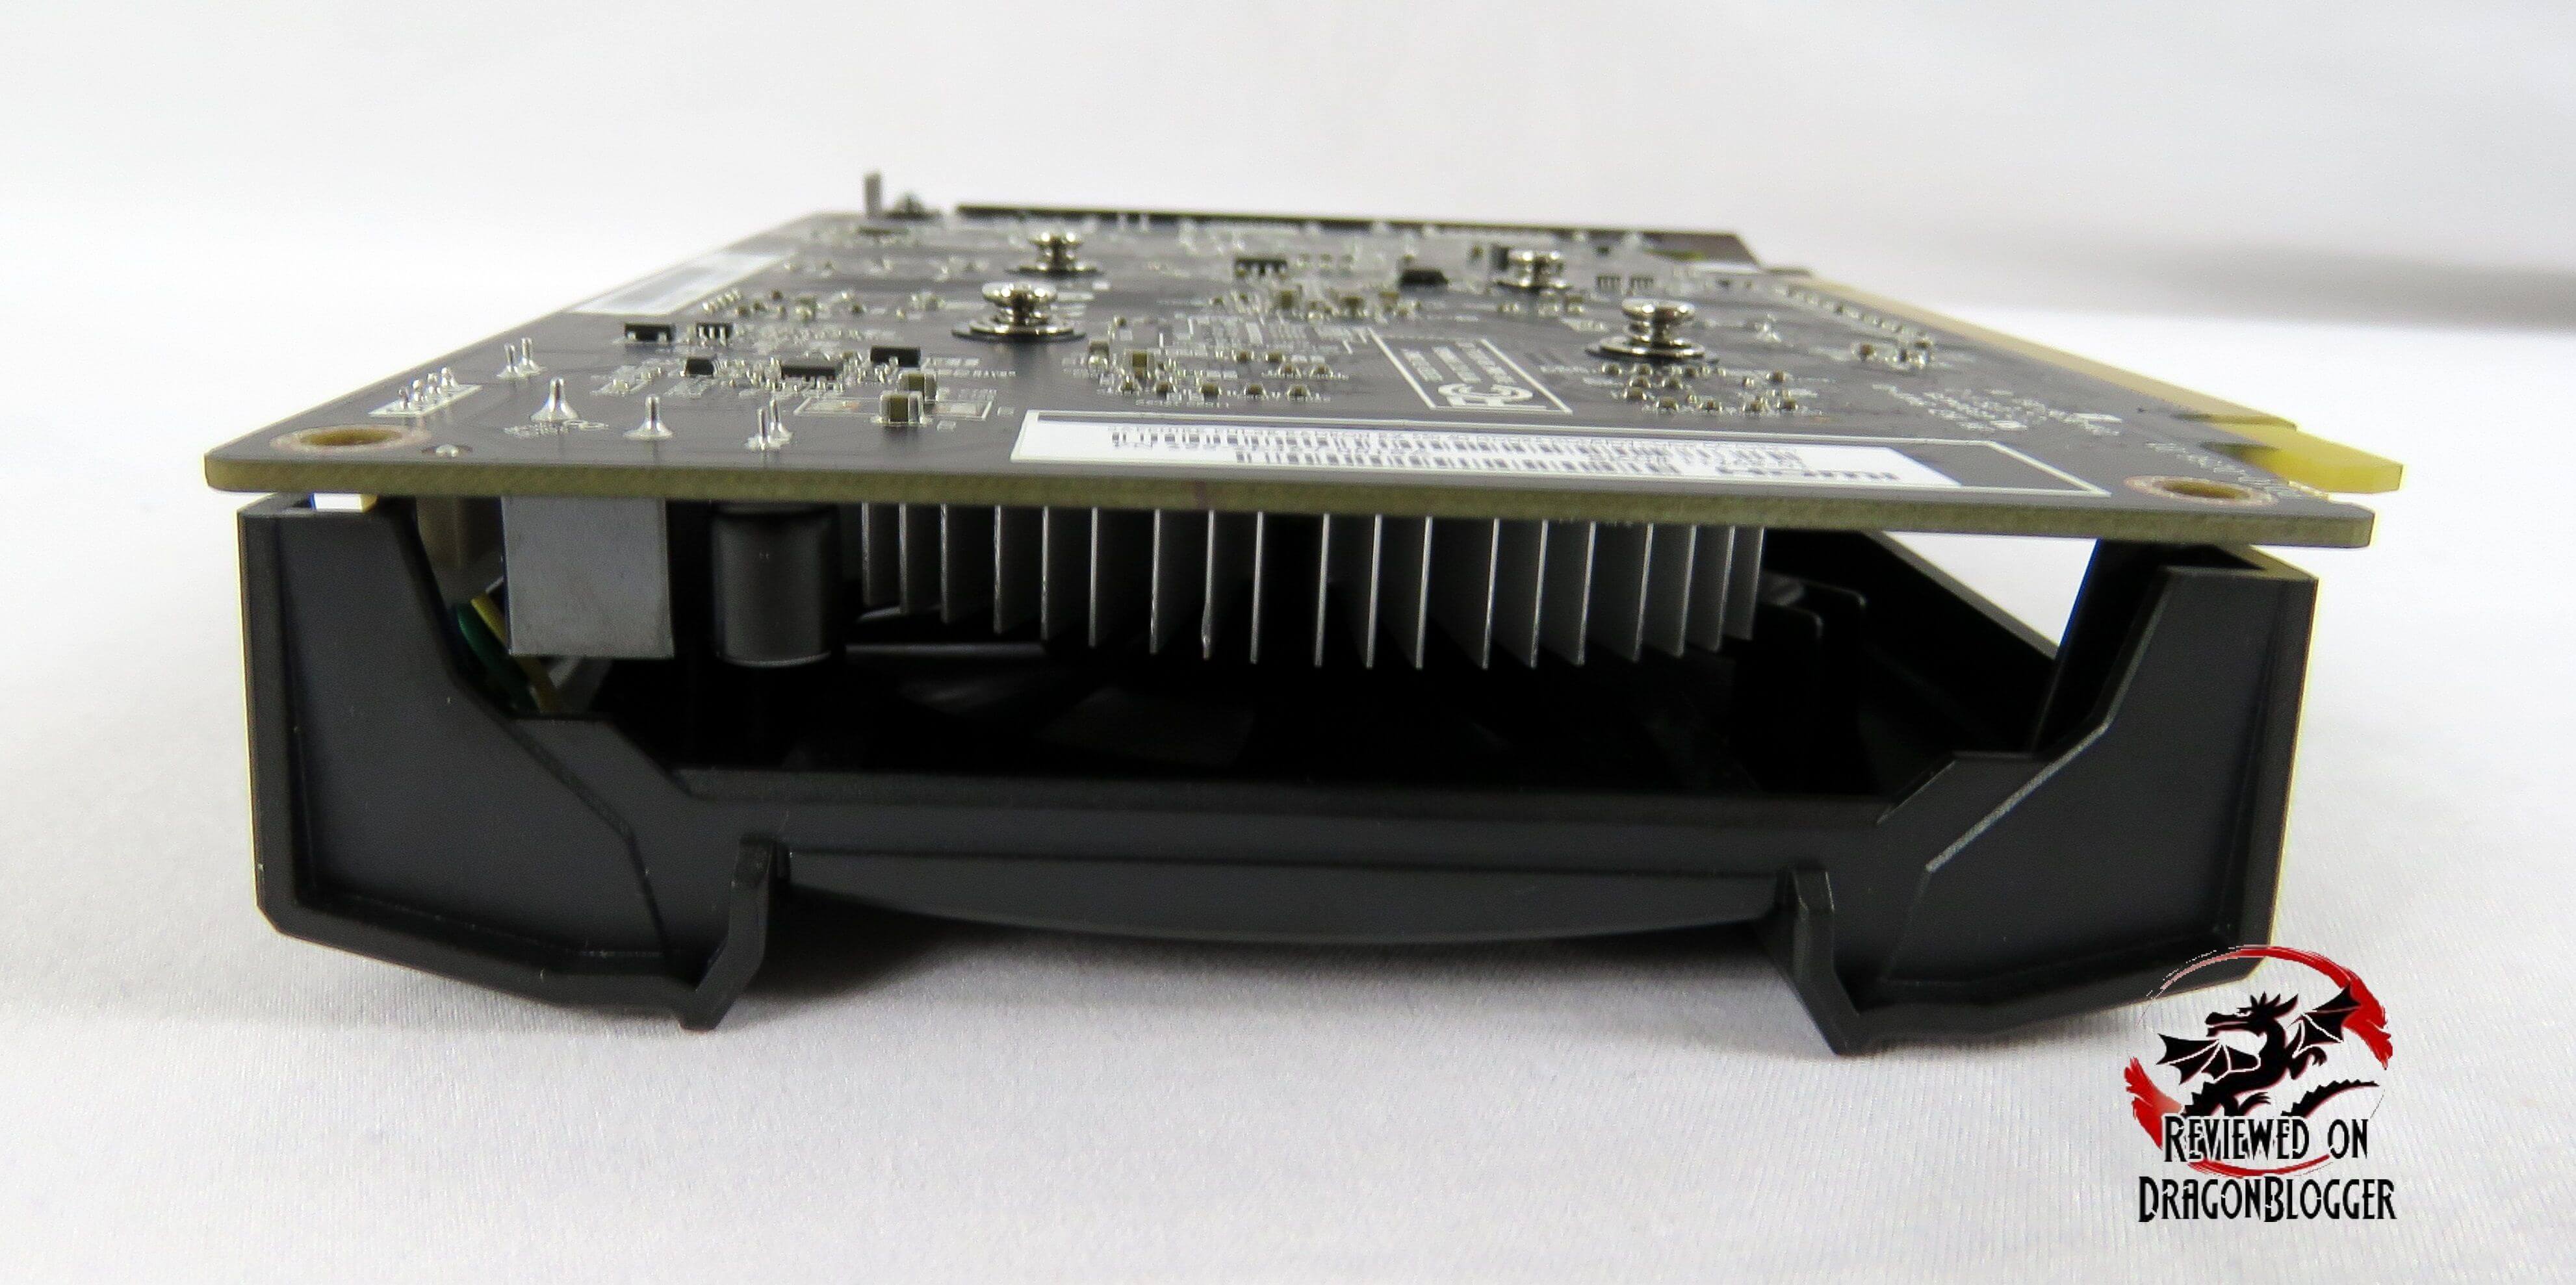
Also to note, even though this is a single height card at least on the PCI slot side, it actually takes up a little of the second slot, so it essence it is a dual height card.
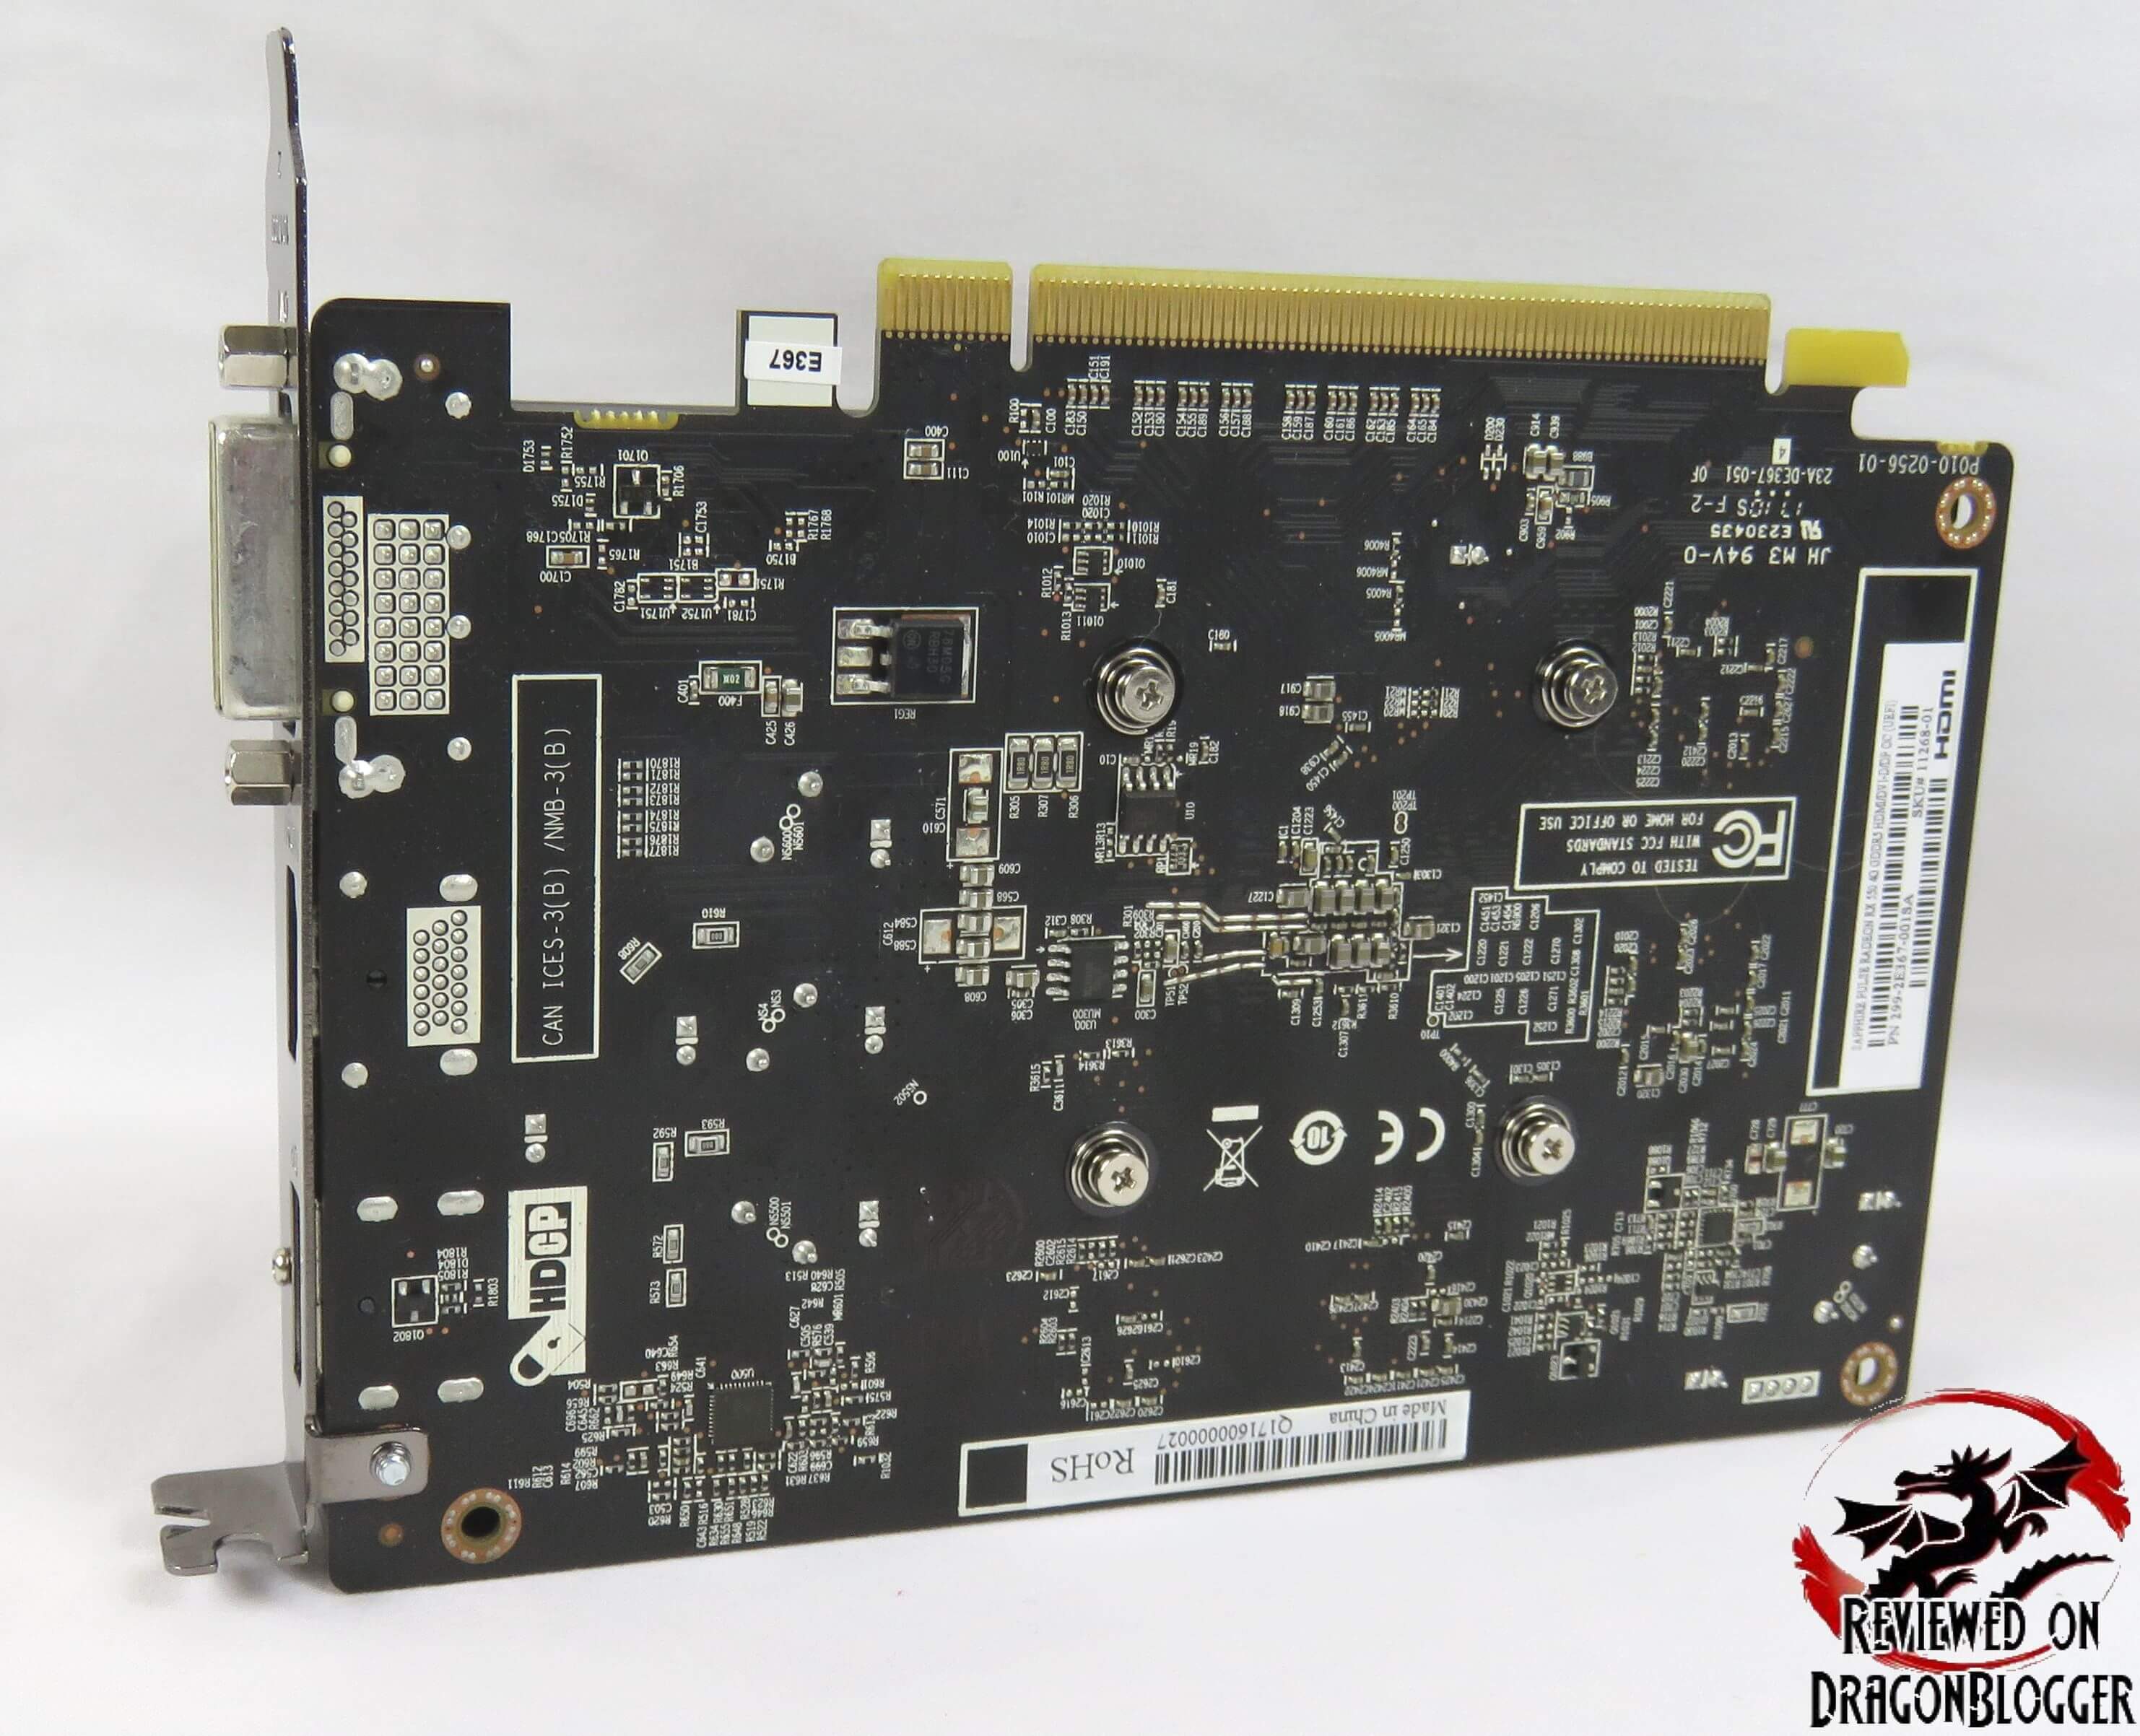
On the back of the card, we can see that there is no cover here, it is a plain PCB. The PULSE line of Sapphire is not meant to be sexy, it is a no frills video card and that helps in the card coming in at such a low price. Does no frills though mean it’s a bad card, that it can’t perform well. We will also find out a little later in the review.
Before we get onto the performance though, let’s see how to install it. This next page will show you how to do so.
[nextpage title=”Installing the Sapphire Radeon PULSE RX550 4GB”]
Every single one of us at one point, did not know how to install a video card, so we have all been noobs at some point and that is OK. In this video I will show you just how to install the Sapphire Radeon PULSE RX550 4GB video card which will save you some money, help provide a little more confidence and maybe even make you some money as well.
Please remember to uninstall the older drivers, whatever they may have been before you install the new card. If you don’t, don’t worry your computer wont die but it could be a little more difficult though not impossible to get the newer drivers installed.
So let’s get to installing the video card.
So here is the final product, the Sapphire Radeon PULSE RX5500 4GB card installed, pretty simple, right? Now after the card has been installed, remember to download and install the latest video drivers.
Now that we have the card installed and the latest drivers installed, let’s go ahead and check out the performance of the card.
[nextpage title=”Benchmarks, Performance, Temperatures and Power Consumption”]
OK, so that you have a reference point, check out my system specifications.
- EVGA CLC 280 Liquid CPU Cooler: https://geni.us/6NAIJBN?m4F6
- Sapphire Radeon Pulse RX550: https://geni.us/6NAIJBN?Zq25
- Intel Core i7-7700K Kaby Lake BX80677I77700K Processor: https://geni.us/6NAIJBN?5e87
- EVGA Z270 FTW K, 132-KS-E277-KR Motherboard: https://geni.us/6NAIJBN?xNpK
- Patriot Viper Elite Series DDR4 32GB 2800MHz: https://geni.us/6NAIJBN?iGZs
- COUGAR Panzer ATX Case: https://geni.us/6NAIJBN?U5dr
- Windows 10 Professional: https://geni.us/6NAIJBN?GYbBRY
- WD Black 512GB PCI-E NVMe M.2: https://geni.us/6NAIJBN?9H46
- WD Blue 500GB SSD WDS500G1B0A: https://geni.us/6NAIJBN?udvK
- Samsung 850 EVO 500GB SSD: https://geni.us/6NAIJBN?1gf0fs
- Kingston HyperX 240GB SSD: https://geni.us/6NAIJBN?8leEDW
- Patriot Ignite 2.5″ 480GB SATA III MLC SSD PI480GS25SSDR: https://geni.us/6NAIJBN?eoPVsG
- Cooler Master Silent Pro Gold 1200W Power Supply: https://geni.us/6NAIJBN?Umwm
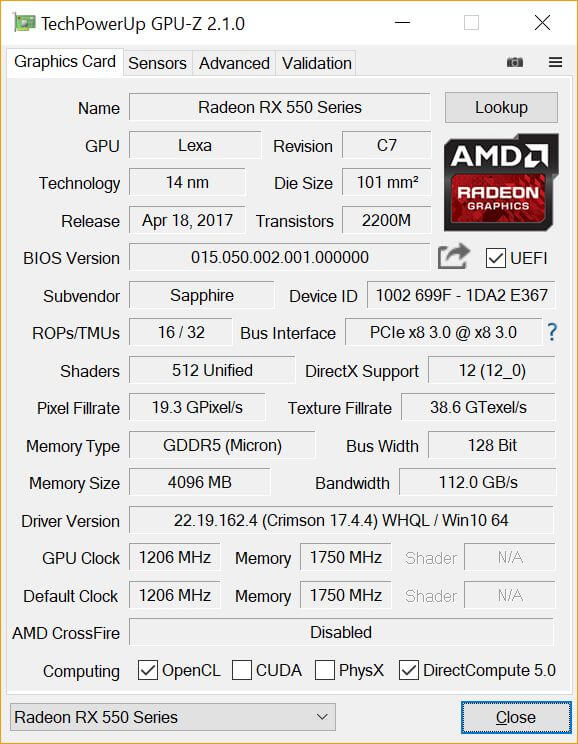
Aside from the specifications I provided earlier, here are the GPU-Z readings on the card.
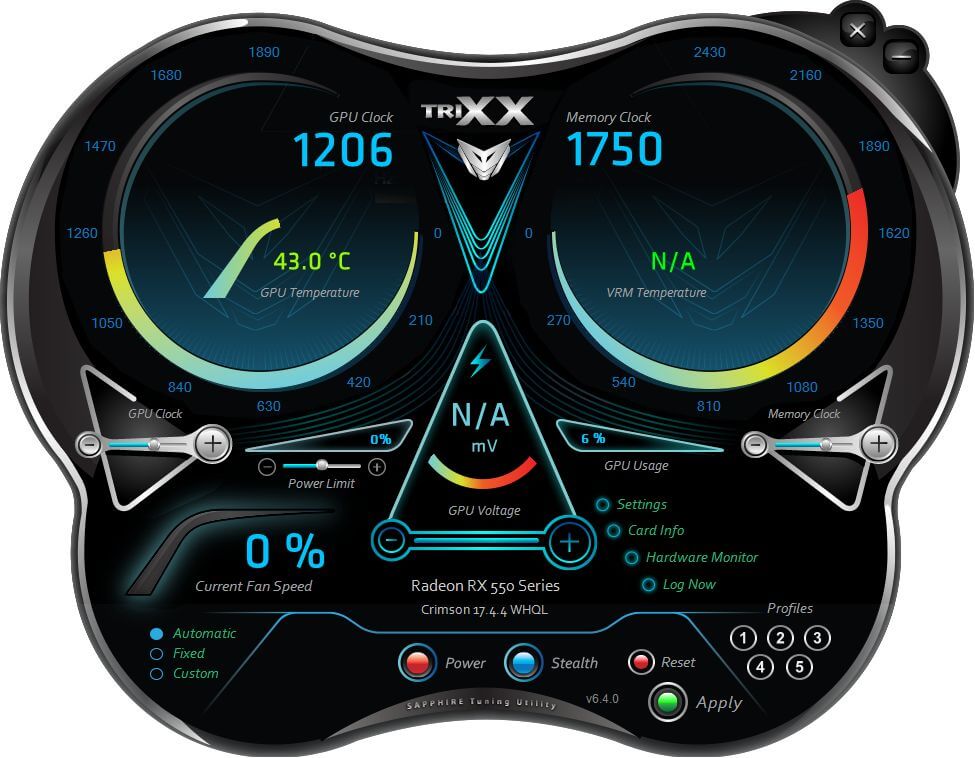
Here is much of the same from Sapphires own utility TRIXX.
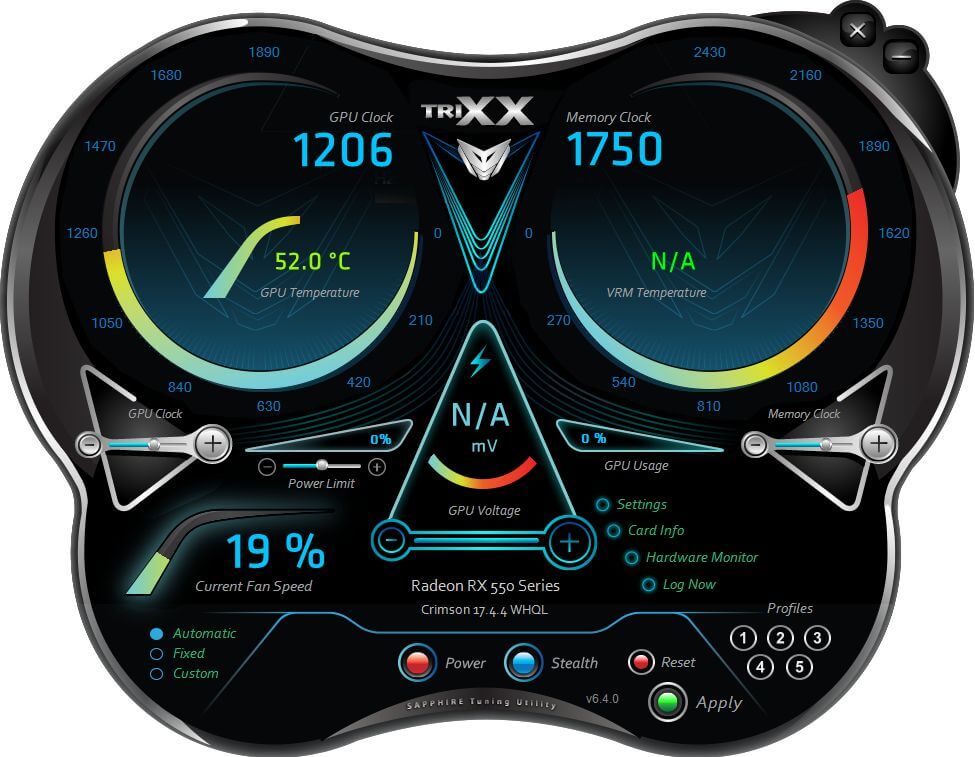
I will utilize this program a little later to unlock some extra performance a little later in the review, so stay tuned. You can grab a copy of Sapphire’s TRIXX 3.0 here: http://www.sapphiretech.com/catapage_tech.asp?cataid=291&lang=eng
You can see that the Sapphire Radeon PULSE RX550 4GB is based off of the Lexa chipset, part of the Polaris line.
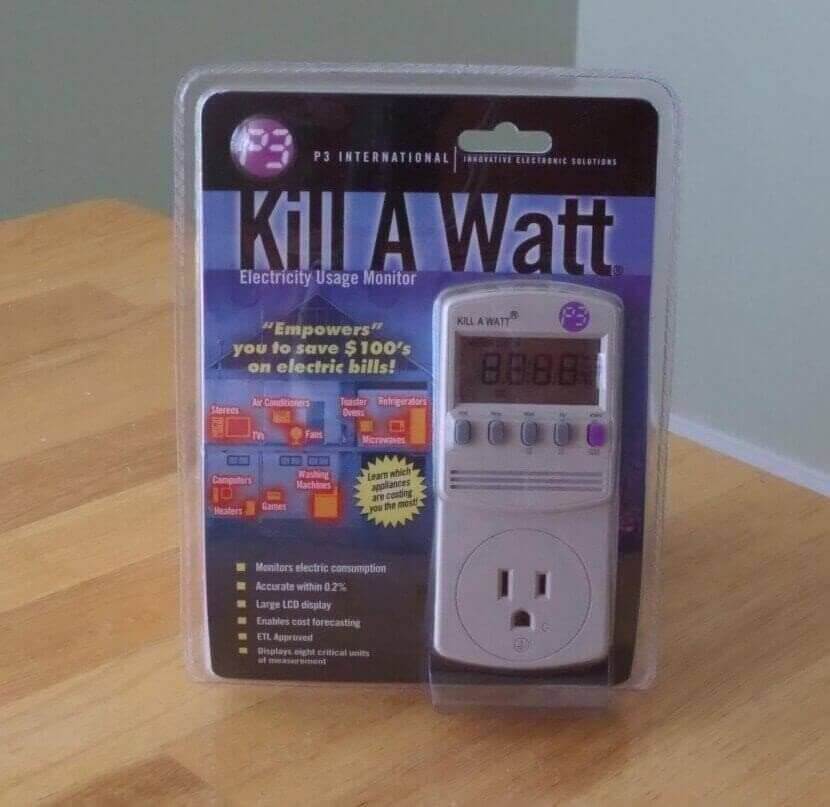
Before I get started with the benchmark, I wanted to show you how my testing process goes. First off, during all of my benchmarks, I capture the power consumption of the entire system. For these tests I capture the minimum power used, average power used and the maximum power consumed. To get all of these readings, I use “Kill A Watt” by “P3 International“.
I use the following applications to benchmark
- FutureMark’s 3DMark Fire Strike
- FutureMark’s TimeSpy 2.0
- Metro Last Light
- Thief
- Tomb Raider
- Tom Clancy’s The Division
OK, let’s get started benchmarking


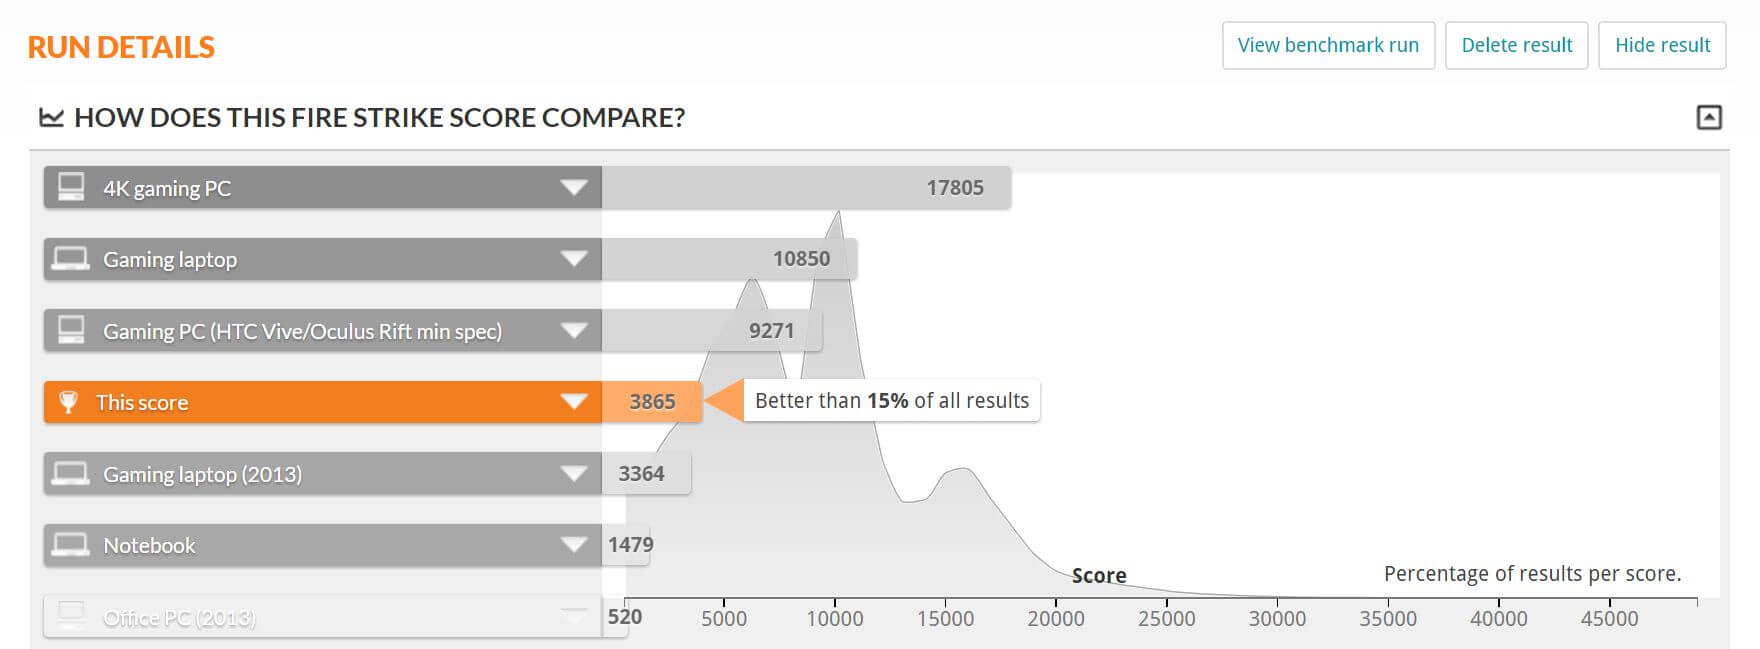
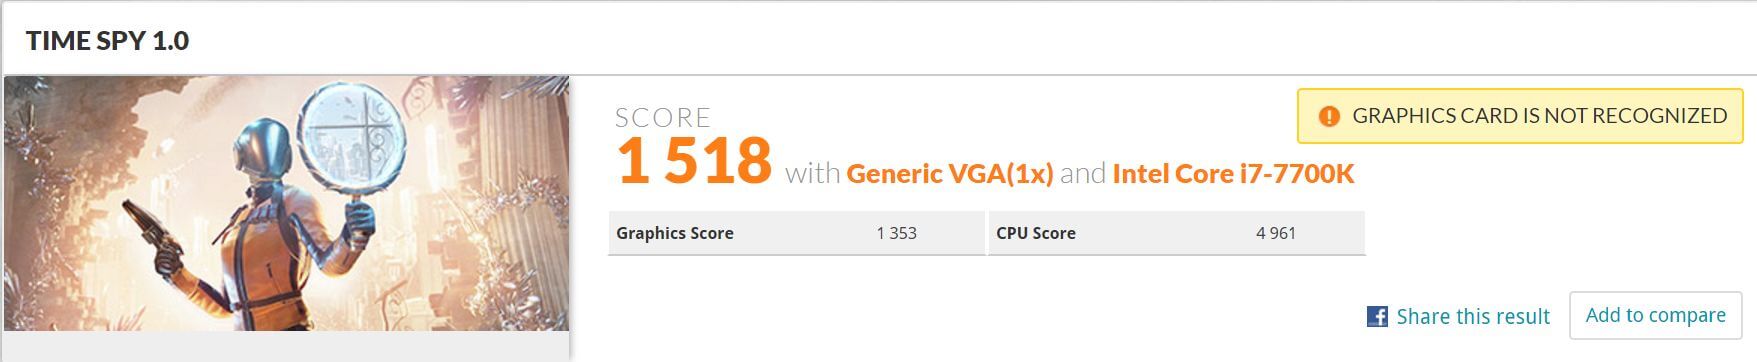
Now, I did mention early on that this is a budget GPU, but it still does relatively well under the “Gaming PC” section of the Run Details. Sadly, the card has not yet been entered into FutureMark’s database, so I entered it myself, but I guess it takes a while to register.
During this test, the lowest amount of power consumed by the PC was 71.1 Watts, that is amazingly low, for an entire PC with the specs listed previously, I am very surprised honestly. The hottest the video card got in this test was 54°C.
Part of the 3DMark Suite, let’s see what TimeSpy says.


Well, not really high but again, think budget here. How does it compare to other results?

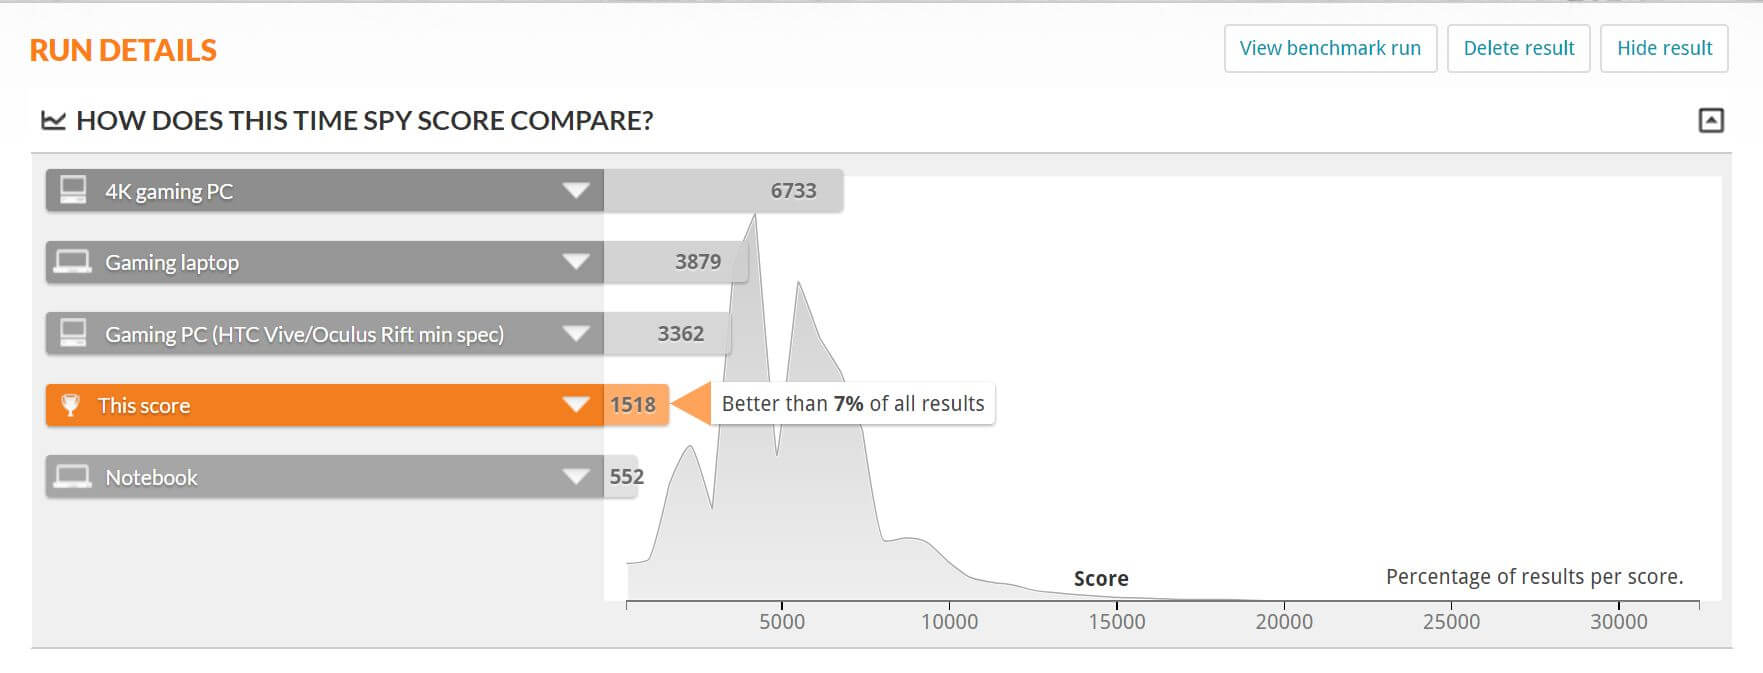
Performing better than 7% of all other results. TimeSpy heated up the card to 68°C at an average of 105 Watts consumed. Keep in mind, 3DMark and TimeSpy are only benchmarks, not games, so let’s check out this card performs in games.
For the rest of benchmarks, I have adjusted the settings a little different than I usually do for the higher end video cards. I will use this benchmarking method for all budget video cards moving forward and of course I will be listing below all the settings I have made. For performance cards, I would use ULTRA settings, for budget PC’s I will use Medium/Normal settings which might be a little more realistic for more people.
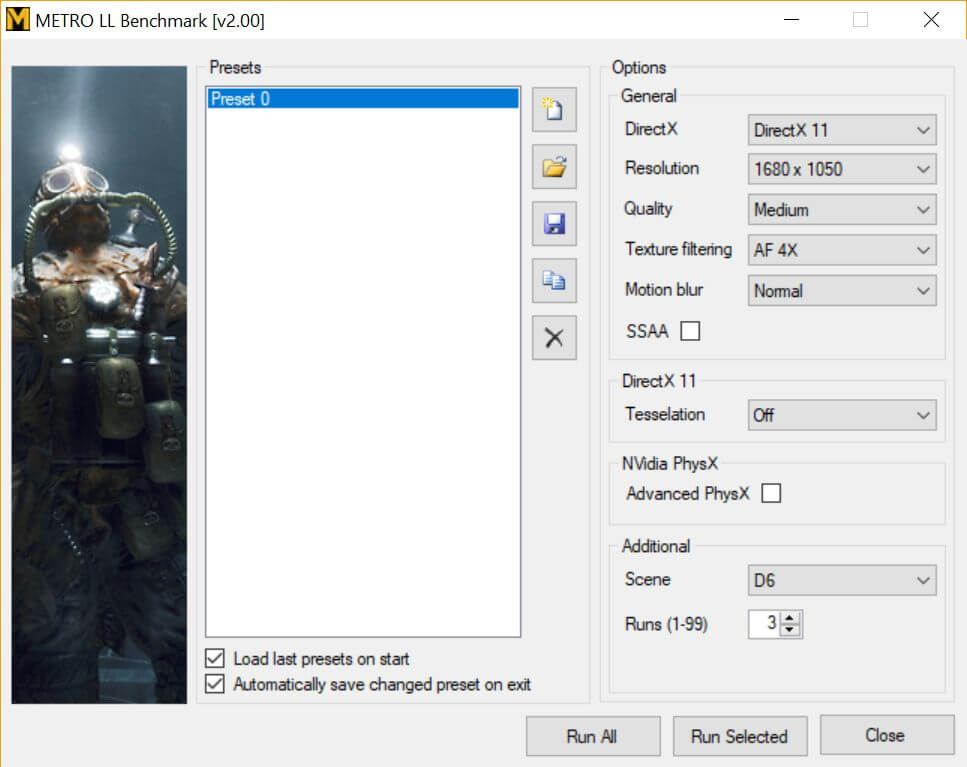
So now let’s get on to Metro Last Light.

Here are my presets for Metro Last Light. The only thing I will change for each test is the resolution and each test will be run in 1680×1050, 1920×1080 and 2650×1440 and presenting you with the results, power consumption and temperatures.
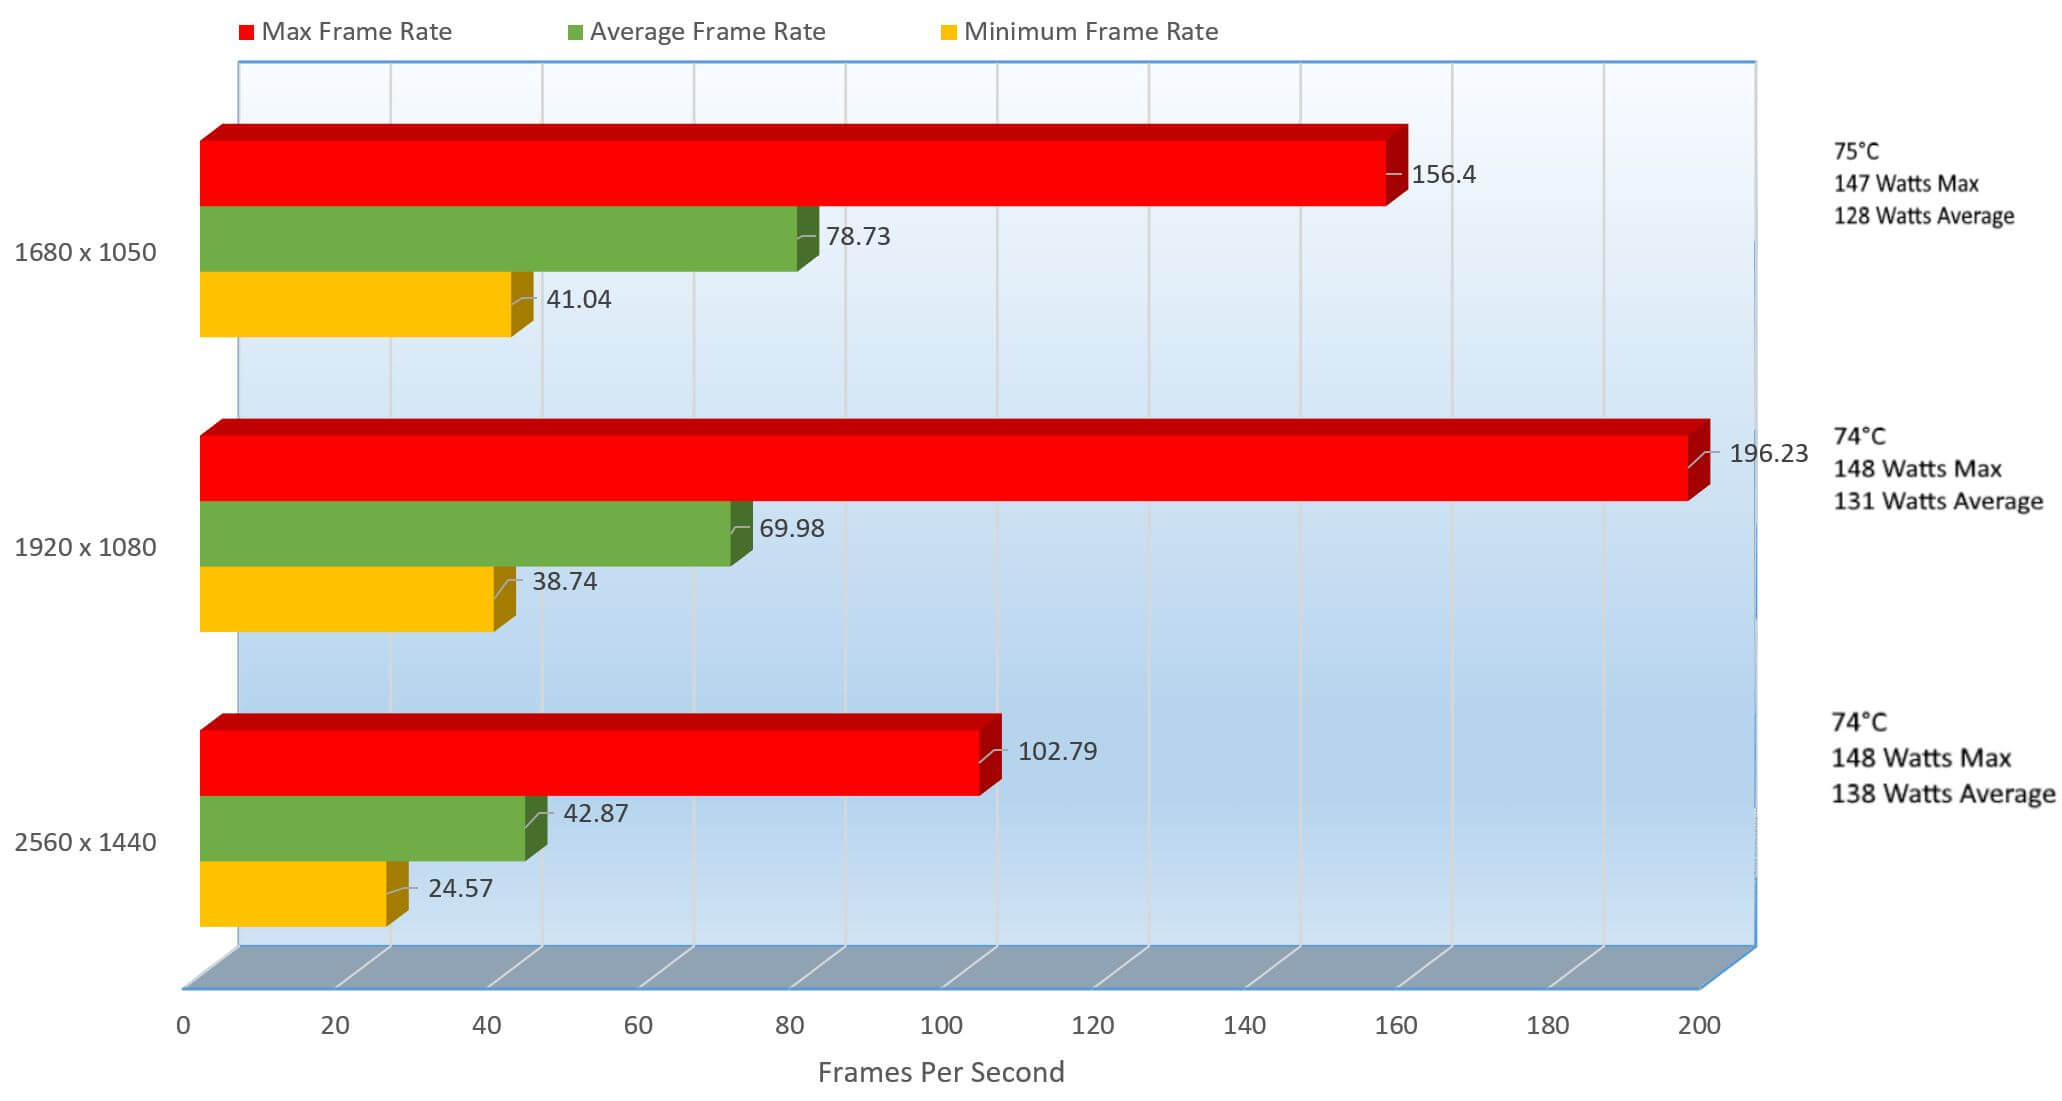
For a budget GPU, this really does amazingly well at 1080P, 14.26% above the almighty 60FPS and best of all at normal settings. At 6850 x 1050, the FPS count was very high at 78.73FPS and I have that in there just in case you don’t have a 1080P monitor, but know that you can turn up the eye candy just a tiny bit more. At 2K though, it was a bit rough at 42.87FPS though kept on par with the 1080P’s thermals at 74°C and only slight higher power consumption at 138Watts over 1080Ps 131Watts. The sweet spot here is 1080P, and there is nothing wrong with that.
I am a bit surprised how well this card handled Metro, again with the newer settings, but now let’s see how Thief handles.

Here are the settings I used throughout the benchmark, only changing the resolution in between.
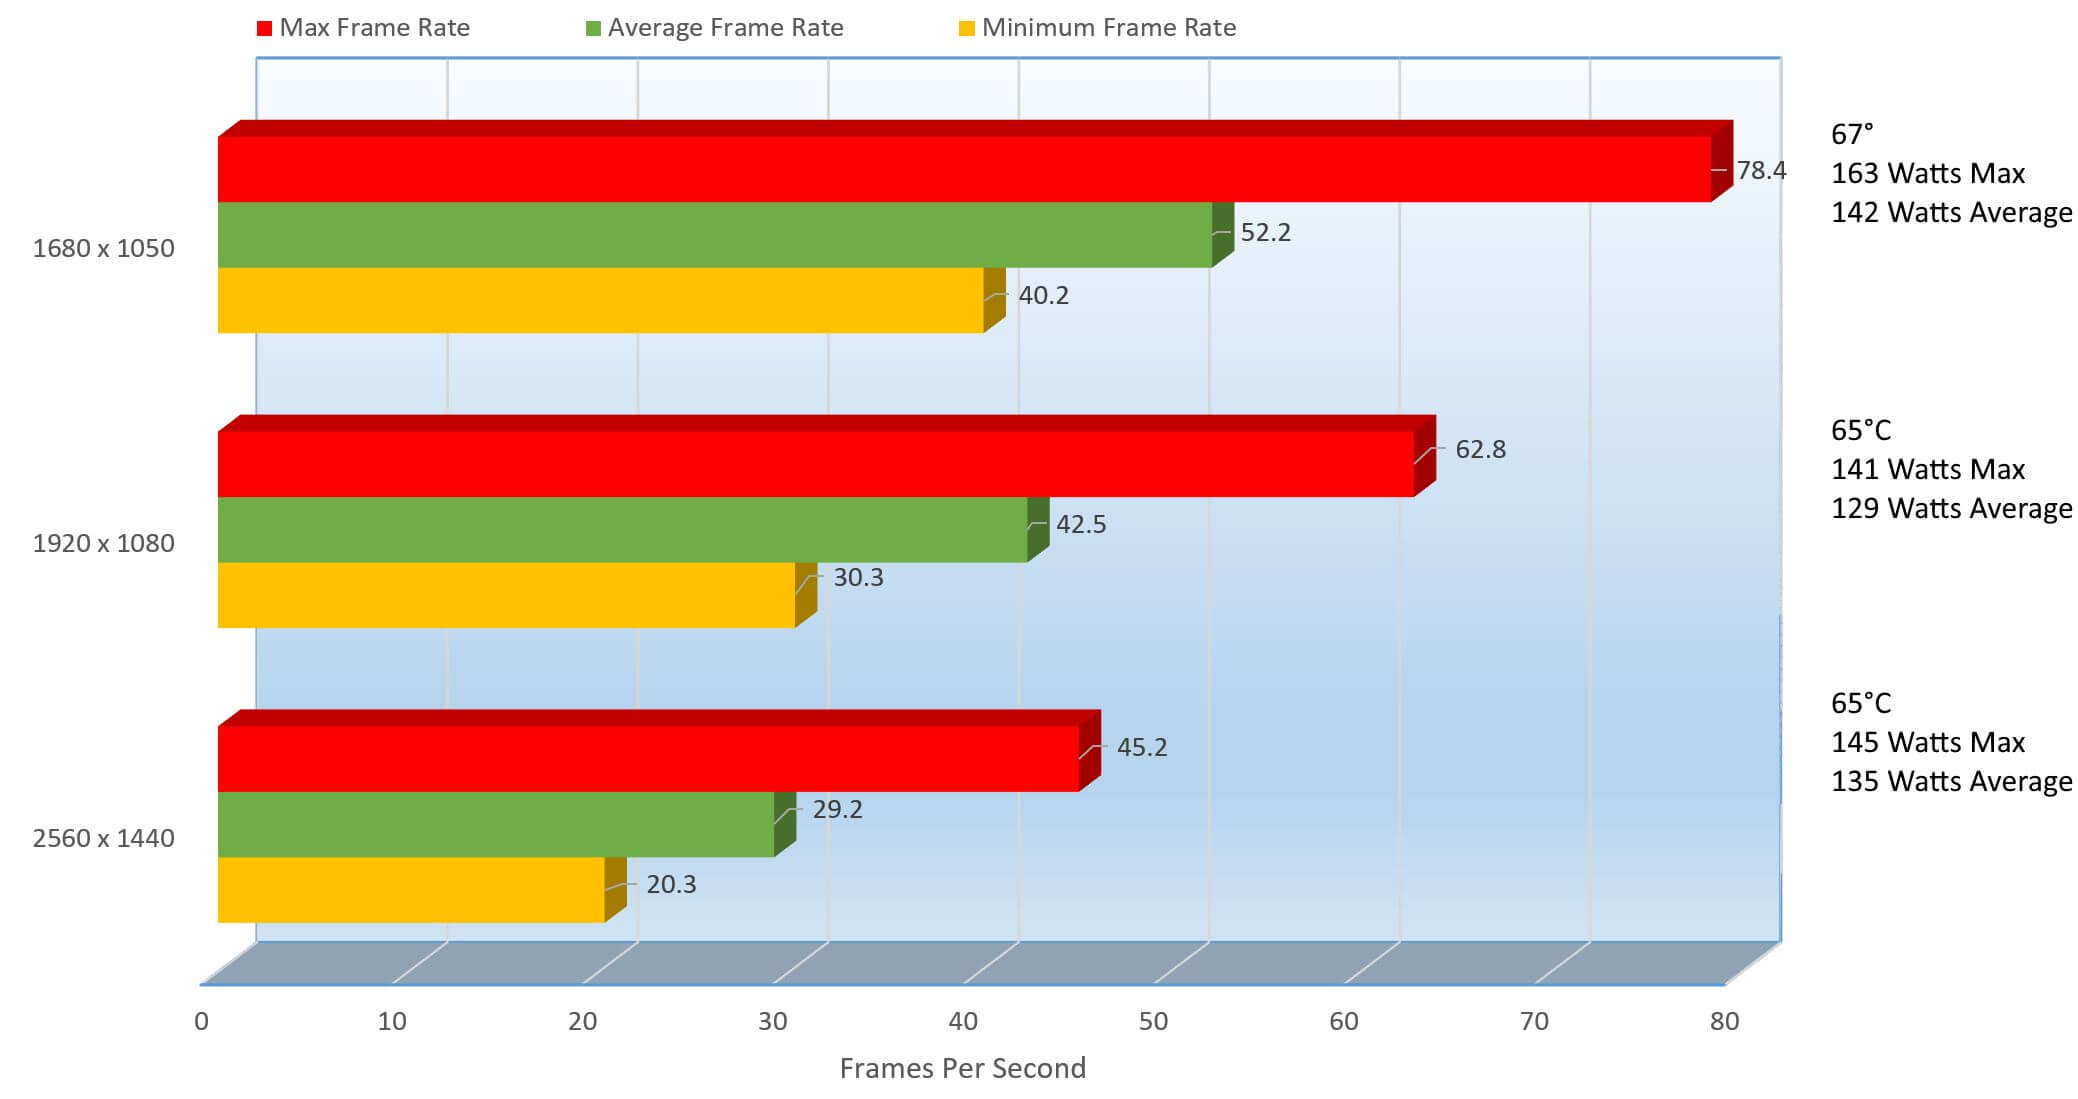
It looks like Thief is having no part of this card, chugging a bit even at 1680 x 1050 coming in at 52.2 frames per second at a chilly 67°C. Bumping up the resolution somewhat at 1920 x 1080 we drop down to 42.5 FPS, performance dropping by 18.58% though the wattage did drop 9.15% which is always welcoming.
In Thief, the “Normal” preset leaves some things on High and Default and leaves Tessellation enabled, which would explain the performance degradation but I don’t want to change the presets. The only thing I do change on presets is the disable v-sync.
Well, I hope Laura can help a little here.

The settings look very similar to that of Thief, but the normal preset is a bit different, but let’s see what the results tell us.
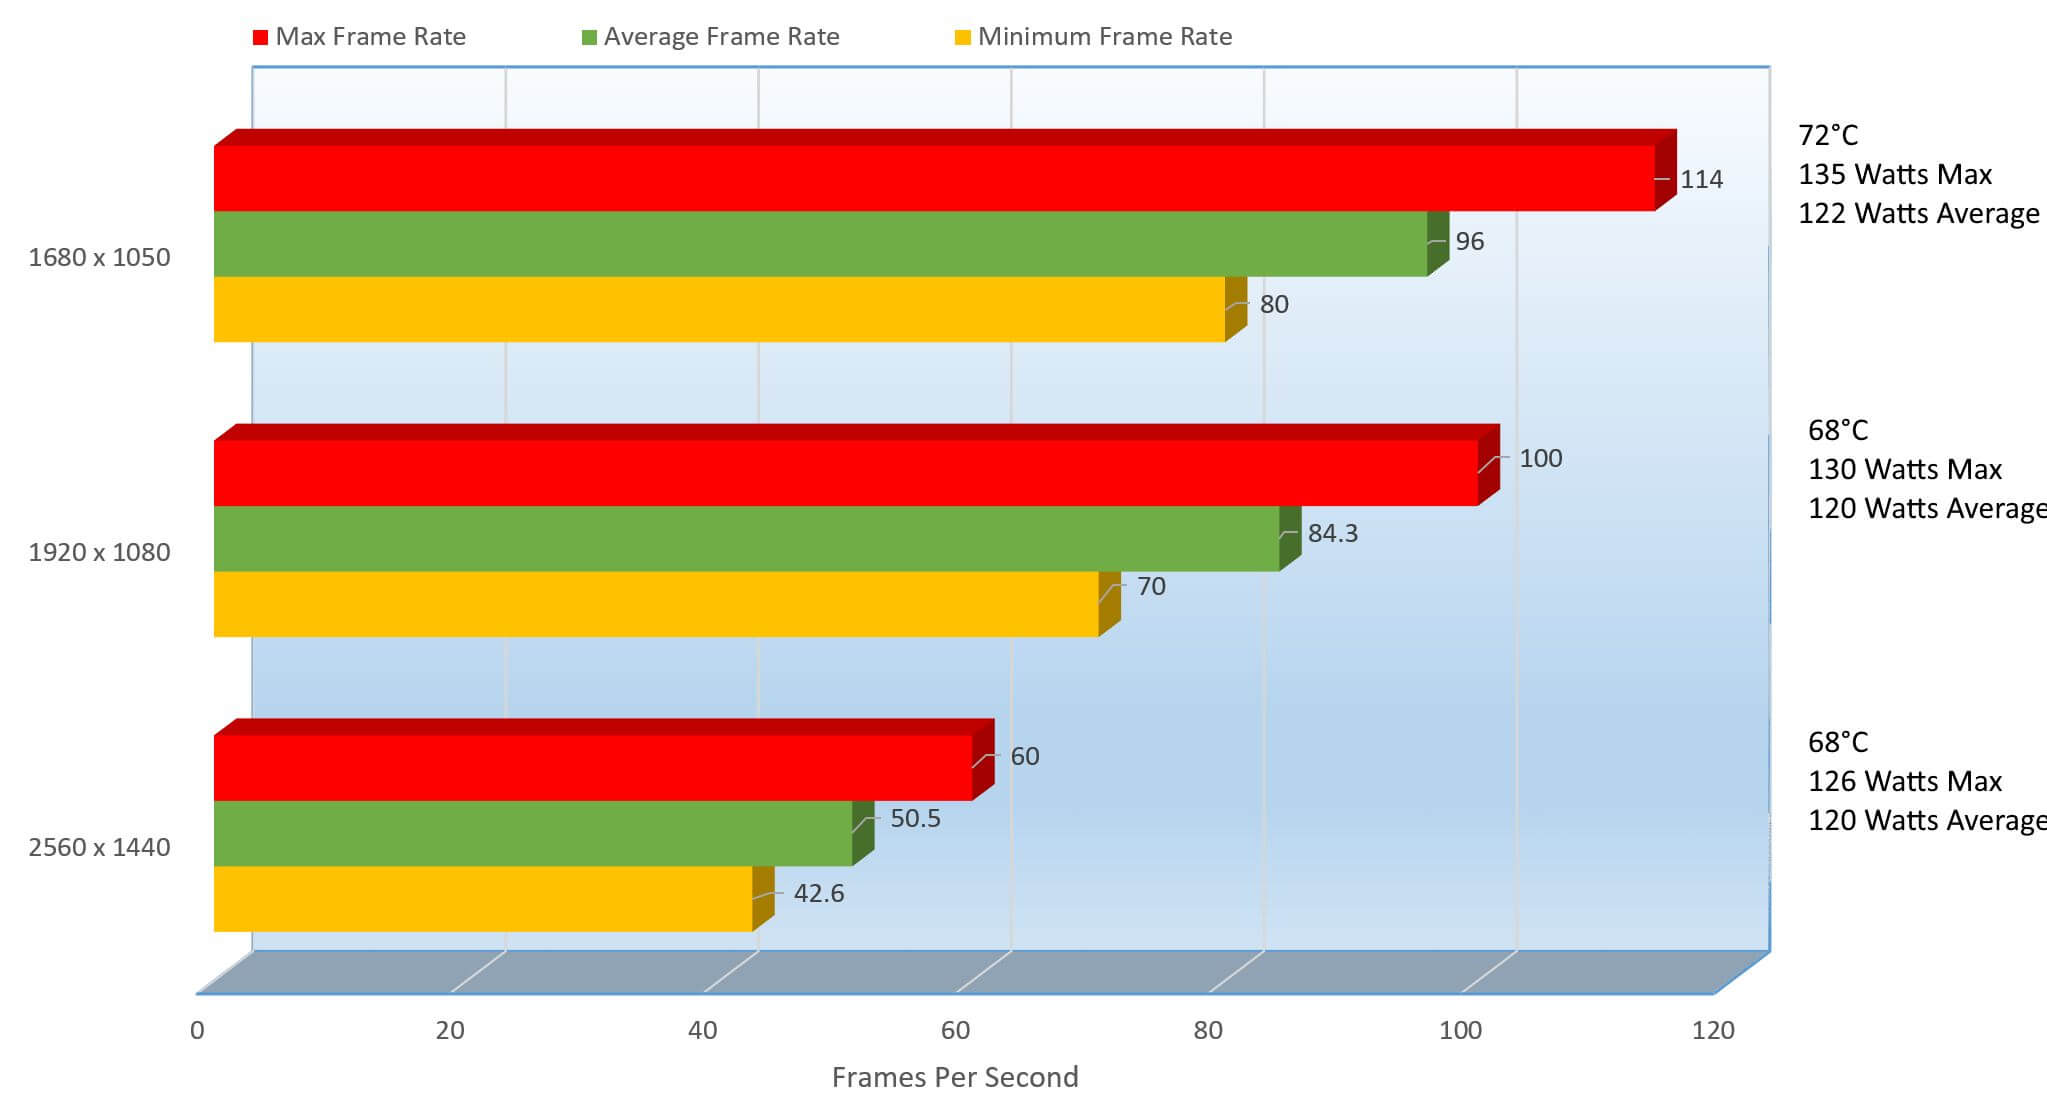
Wow, Laura took the power back here, stole it out of Garret’s hands, see what I did there? So at 1920 x 1080, we see an Average FPS of 84.3, 12.19% lower than that of 1680 x 1050 performance, and at a 1.63% decrease in power consumption oddly enough and the temperature dropped by 4 degrees. At 50.5 FPS on 2560 x 1440, it was almost at the magic number… what can we do to make that score improve? I will get to that in a little bit, but let’s make a pit stop over to New York in “Tom Clancy’s” “The Division”.

Here are the newer presets
The only thing I changed from the Medium default was to disable V-sync, just in case it does pass 60 frames per second. So let’s see the results.
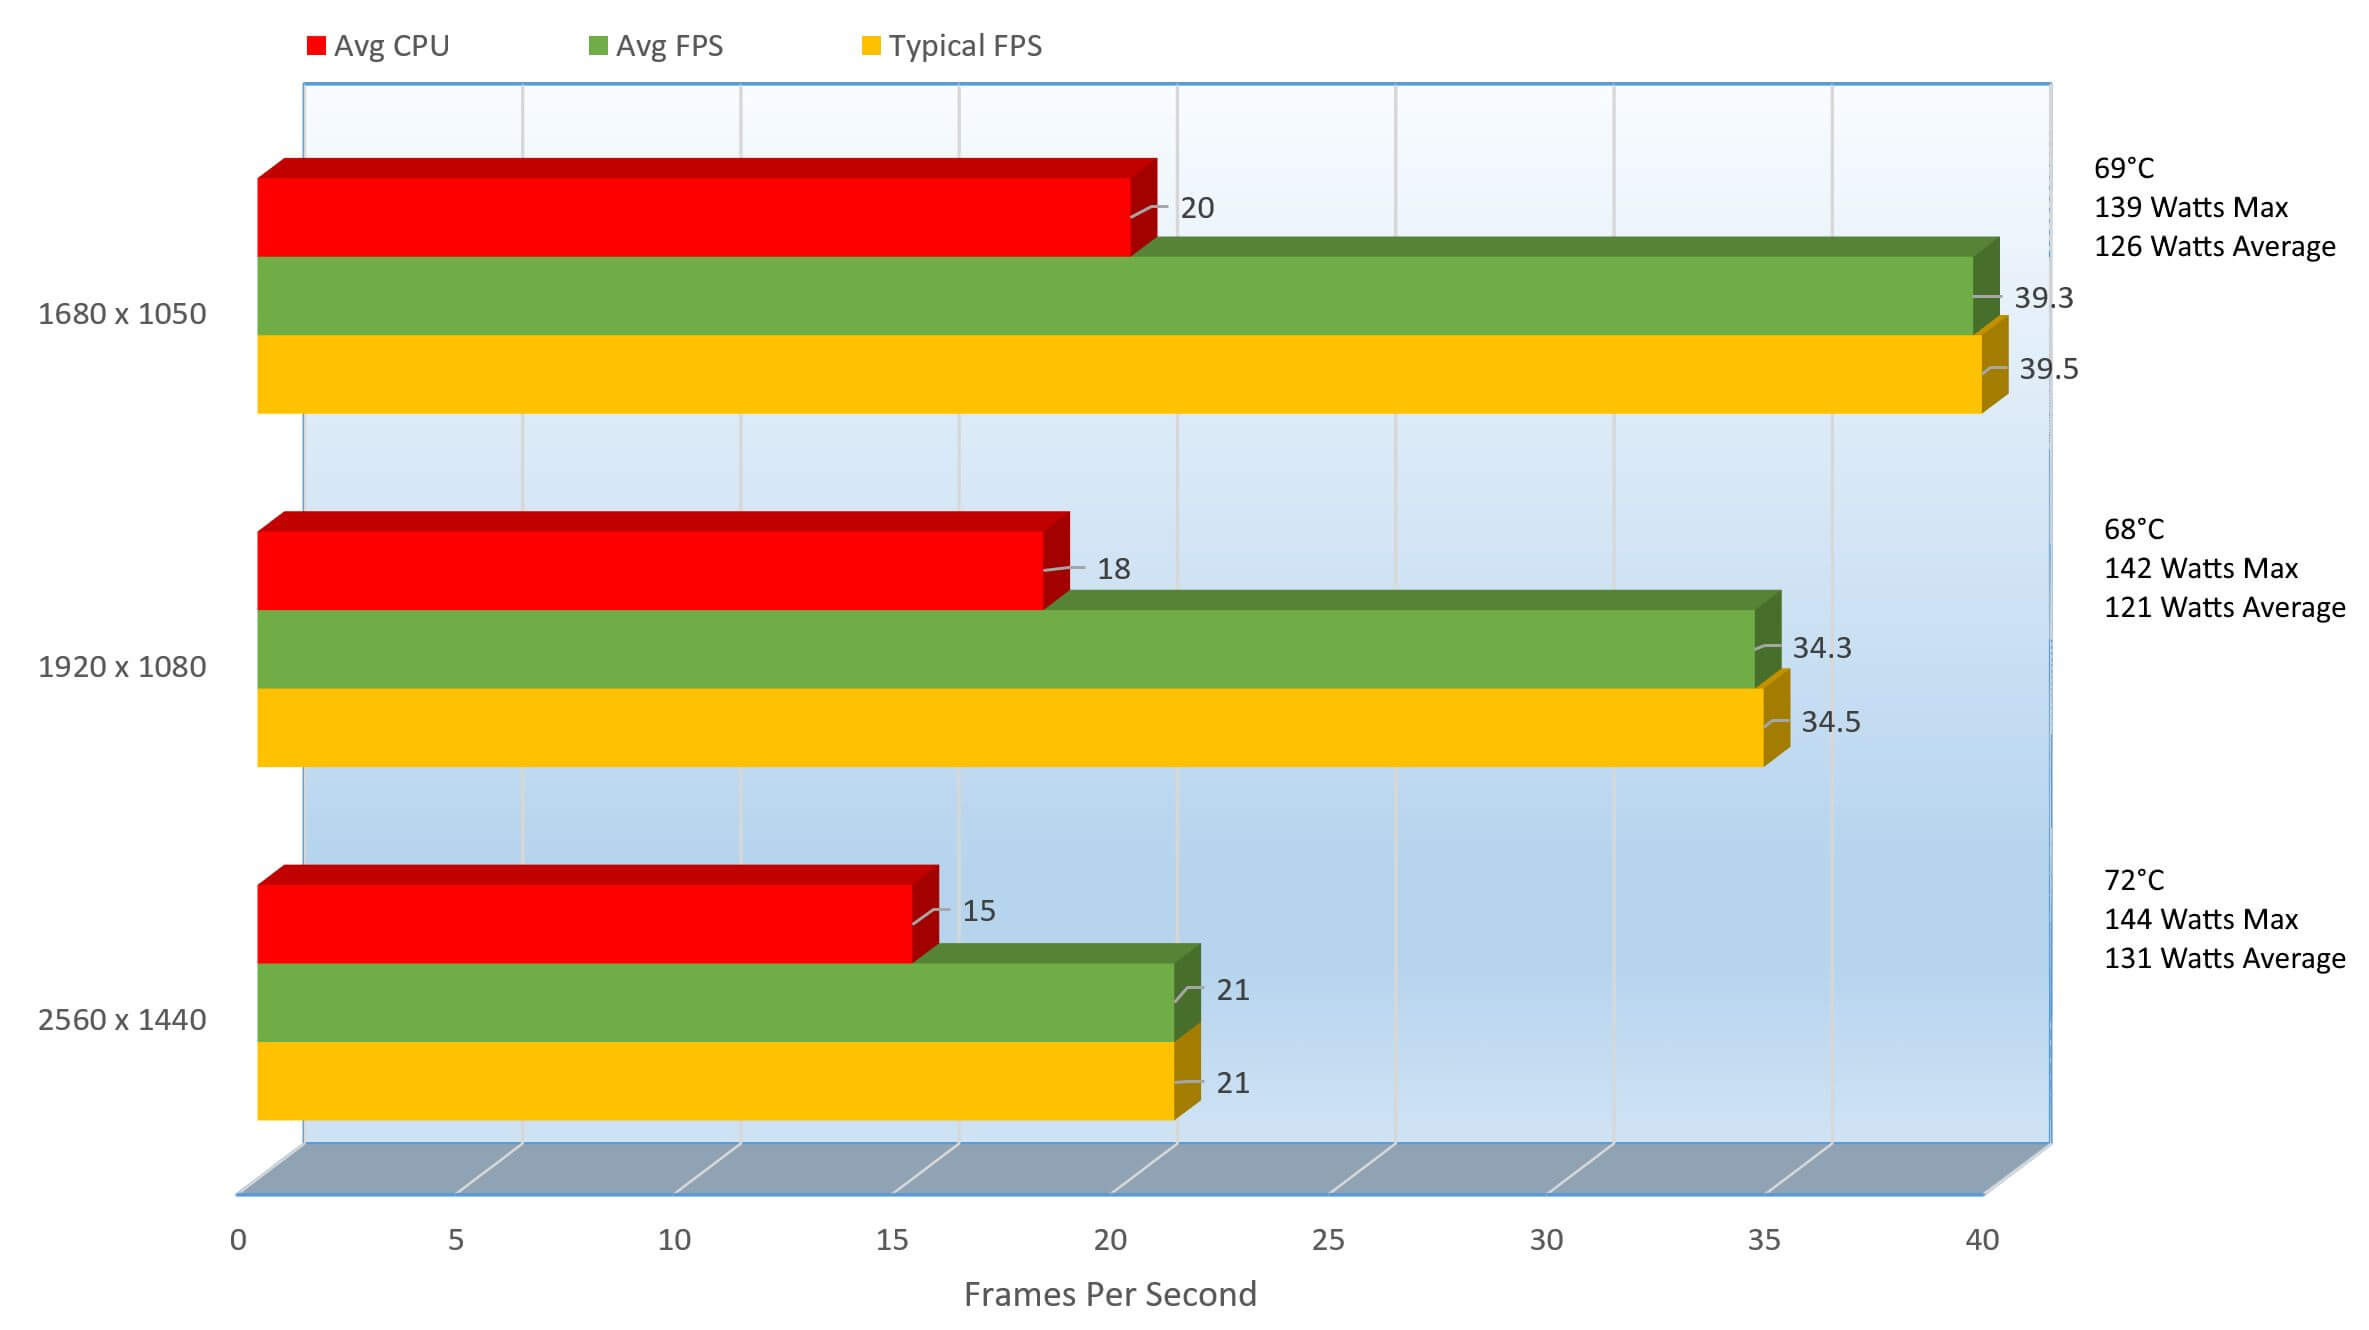
Well, it doesn’t look like this card is cut for The Division, though I had high hopes for it. At 1080P, we can see the average FPS is 34.3, a 12.72% decrease from the FPS on 1680 x 1050 which was 39.3 FPS. 1080P did come in 1 degree cooler and consumed 5 Watts less on average. At 2560 x 1440 though, it was very choppy coming in at 21 FPS, that’s a 38.76% decrease from 1080P’s and came in consuming 10 Watts more as well.
I will work on getting this to run better with those settings I have listed above, but let’s see how the card runs on a few other popular games. Those games are League of Legends, Quake Champions, Counter Strike: Global Offensive and Paragon. Check out the next page.
[nextpage title=”Gameplay and Performance”]
This is the time I look forward to in all of my reviews,… taking a break and kicking it back to a few games. As I mentioned before, the games I will be playing are League of Legends, Quake Champions, Counter Strike: Global Offensive and Paragon.
So let’s start off with Quake Champions:
Quake Champions
That game actually performed amazingly well, though the graphics were turned down a bit it still looked nice. I remember the days of playing Quake I and Quake II on my Creative Savage 4 and then my Geforce 3 TI 550, and surely some more,… but that was too long ago. Anyway, let’s checkout Counter Strike: Global Offensive.
Counter Strike: Global Offensive
This is an older game, but I was able to play at 2560 x 1440 at over 60 frames per second, and on high too. It was a bit smoother at 1920 x 1080, but still I was over 60 FPS on 2K. So now let’s check out League of Legends.
League of Legends
Wow, 4K gaming at very high and she was getting above 80 frames per second, in the upper 90’s as well. League of Legends is a pretty fun game too. Let’s check out Paragon now.
Paragon
At 1920 x 1080 the card was seeing over 60 frames per second, though with the settings on low. If you are playing an online competition, or are just a serious online game, you will always configuring your settings very low anyway, so this works out perfectly.
The problem with recording is that the framerate will drop a bit while recording, usually between 10 and 30 frames per second, on this card I only experience about a 5 frame per second drop. Thankfully that is relatively low, but still it can mean anyway between under 60 FPS and below.
The program I used for this was Action Screen Recording software and the hardware acceleration used on these tests under Action! was AMD APP.

Sadly, this is always a very short session but now I was talking about eeking a little better performance out of the cards, and I will. In this next chapter I will be overclocking the card some and the performance improvement is very surprising.
[nextpage title=”Overclocking Performance, Benchmarks, Temperatures and Power Consumption”]
When I first got this card, I was thinking that this was going to be such a boring review because well, it shouldn’t be able to do much right? I mean, it has not been horrible, but can it get better?
Turns out this card is an overclockers dream, it can overclock incredibly high and I went kind of high, but I did not want to spent too much time on it. Check out my overclock below.
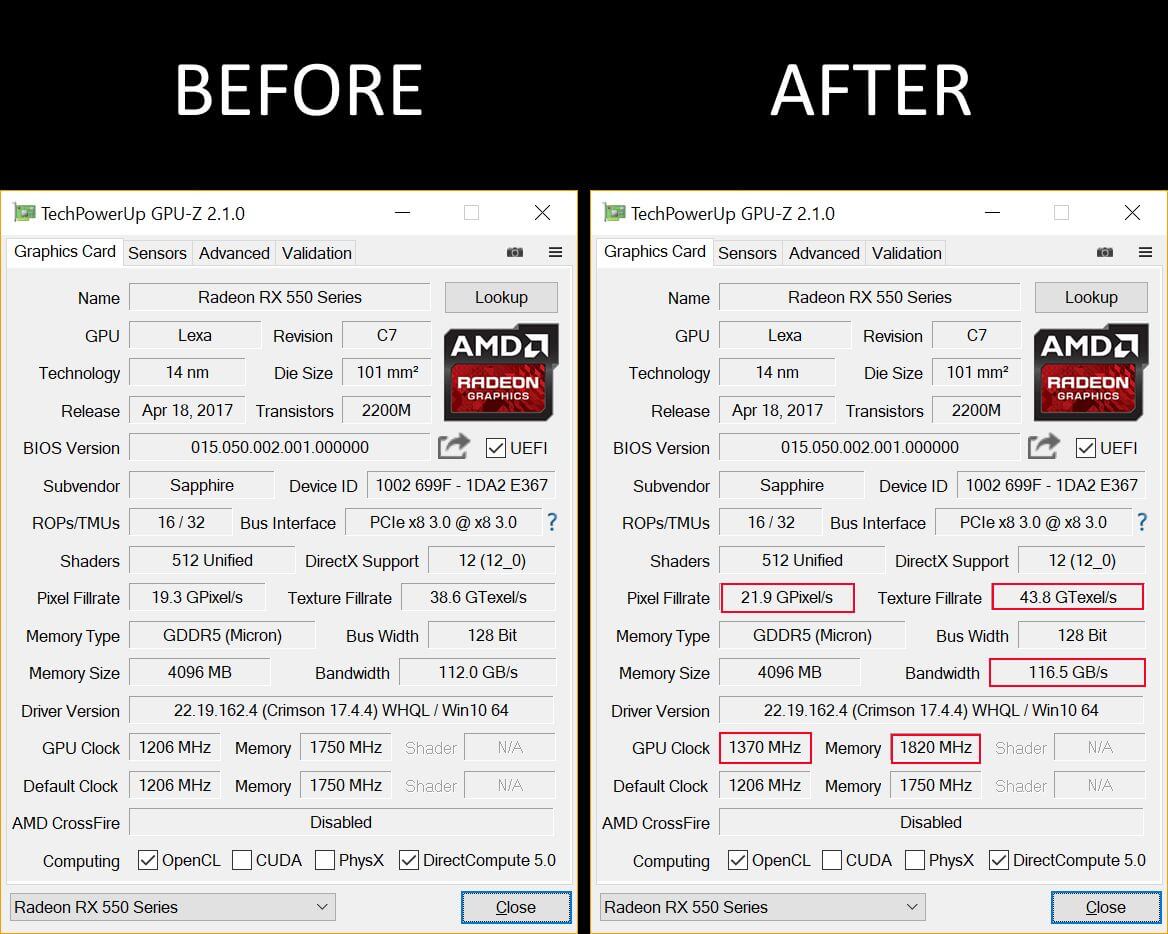
You can see here that I have overclocked the GPU by 164Mhz and the memory by 70Mhz. Now a byproduct of overclocking the GPU and the memory is that the Pixel Fillrate increase by 2.6GigaPixels, 5.2GigaTexels and the memory bandwidth improved by 4.2GigaBytes per second. How did I achieve this, well I am not telling! Haha, no I am just kidding.
To overclock the card, I used Sapphires own TRIXX. Here are the default settings
And now the overclock
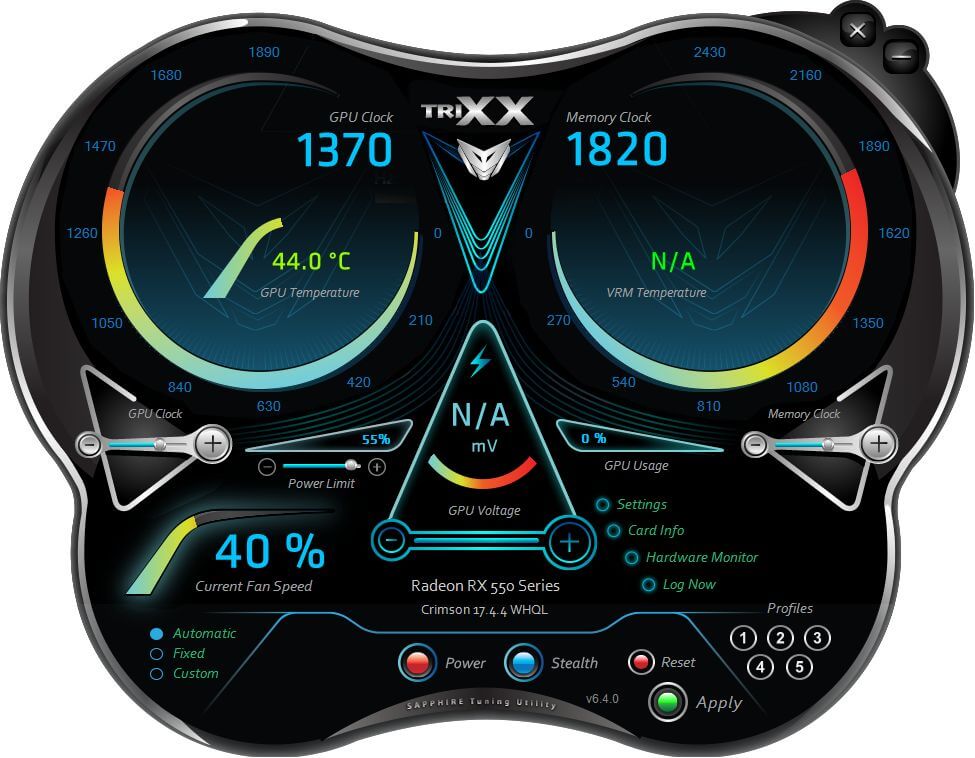
This was one of the easiest overclocks and most effective I have done in quite sometime, I am by no means a professional overclocker, though I am pretty good at it. So what I did here was I raised the GPU Clock by 10Mhz at a time until I hit the comfortable 1370, raising the “Power Limit” settings to 51% (I know it is higher here and I will get to that in a sec). I could have gone higher but I did not want to waste too much time on this.
After that, I raised the memory clock a bit, each time on both while I tested, running a pass of TimeSpy and Metro Last Light until everything was perfect. By perfect, I mean no artifacting and no crashing. The heat, this time I left to automatic and it took care of itself nicely.
Now back to the 51% versus the 55% Power Limit setting you see there. At 51%, everything was working fine, until I started recording the results. I got through 3DMark and TimeSpy with no issues, and the 1680 x 1050 in Metro Last Light but when I got to 1920 x 1080, it would freeze. I knew it could only be the Power limit, so I raised it 1 point each time testing afterwards until I reached 55% and everything worked fine. This of course meant I had to go back and retest everything, so here are my results.

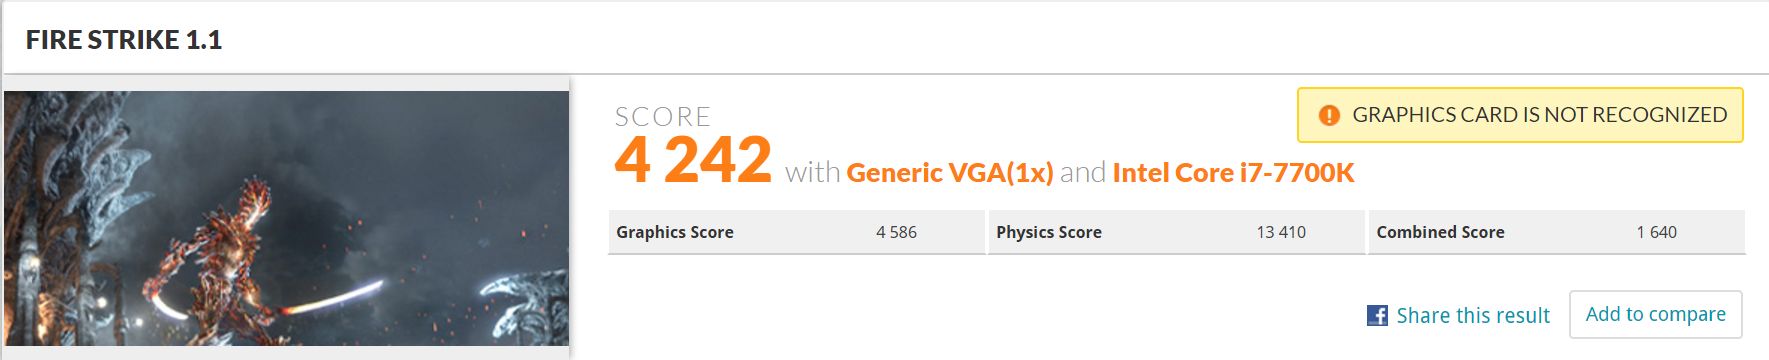
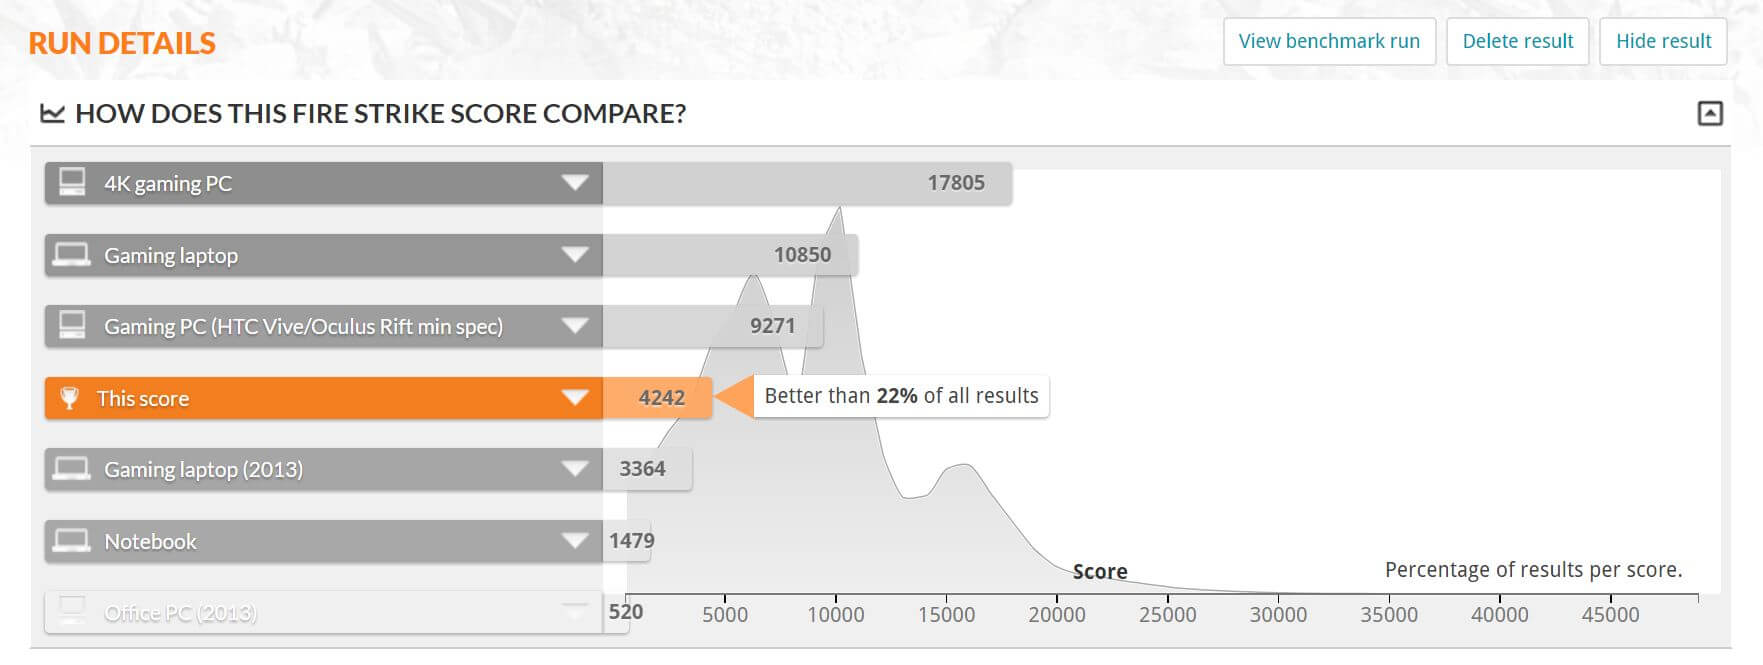
A very nice improvement in performance here receiving 4,242 whereas before we got a score of 3,865, an increase of 8.89%. We also went up a few rankings now receiving 22% above all other results whereas before we only saw 15%, a 38.82% bump in results.
Since there was an increase in performance, as we can expect our average power consumption went up to 136 Watts where before we saw 113 Watts on average. This was a 16.91% increase in power usage and with that the temperature went up to 70°C up from the stock 67°C, a temperature increase of 4.29%, but the fans were still set to automatic.
Now the total score is not the only thing that went up, so let’s do some more comparison and break down how that score came to be.
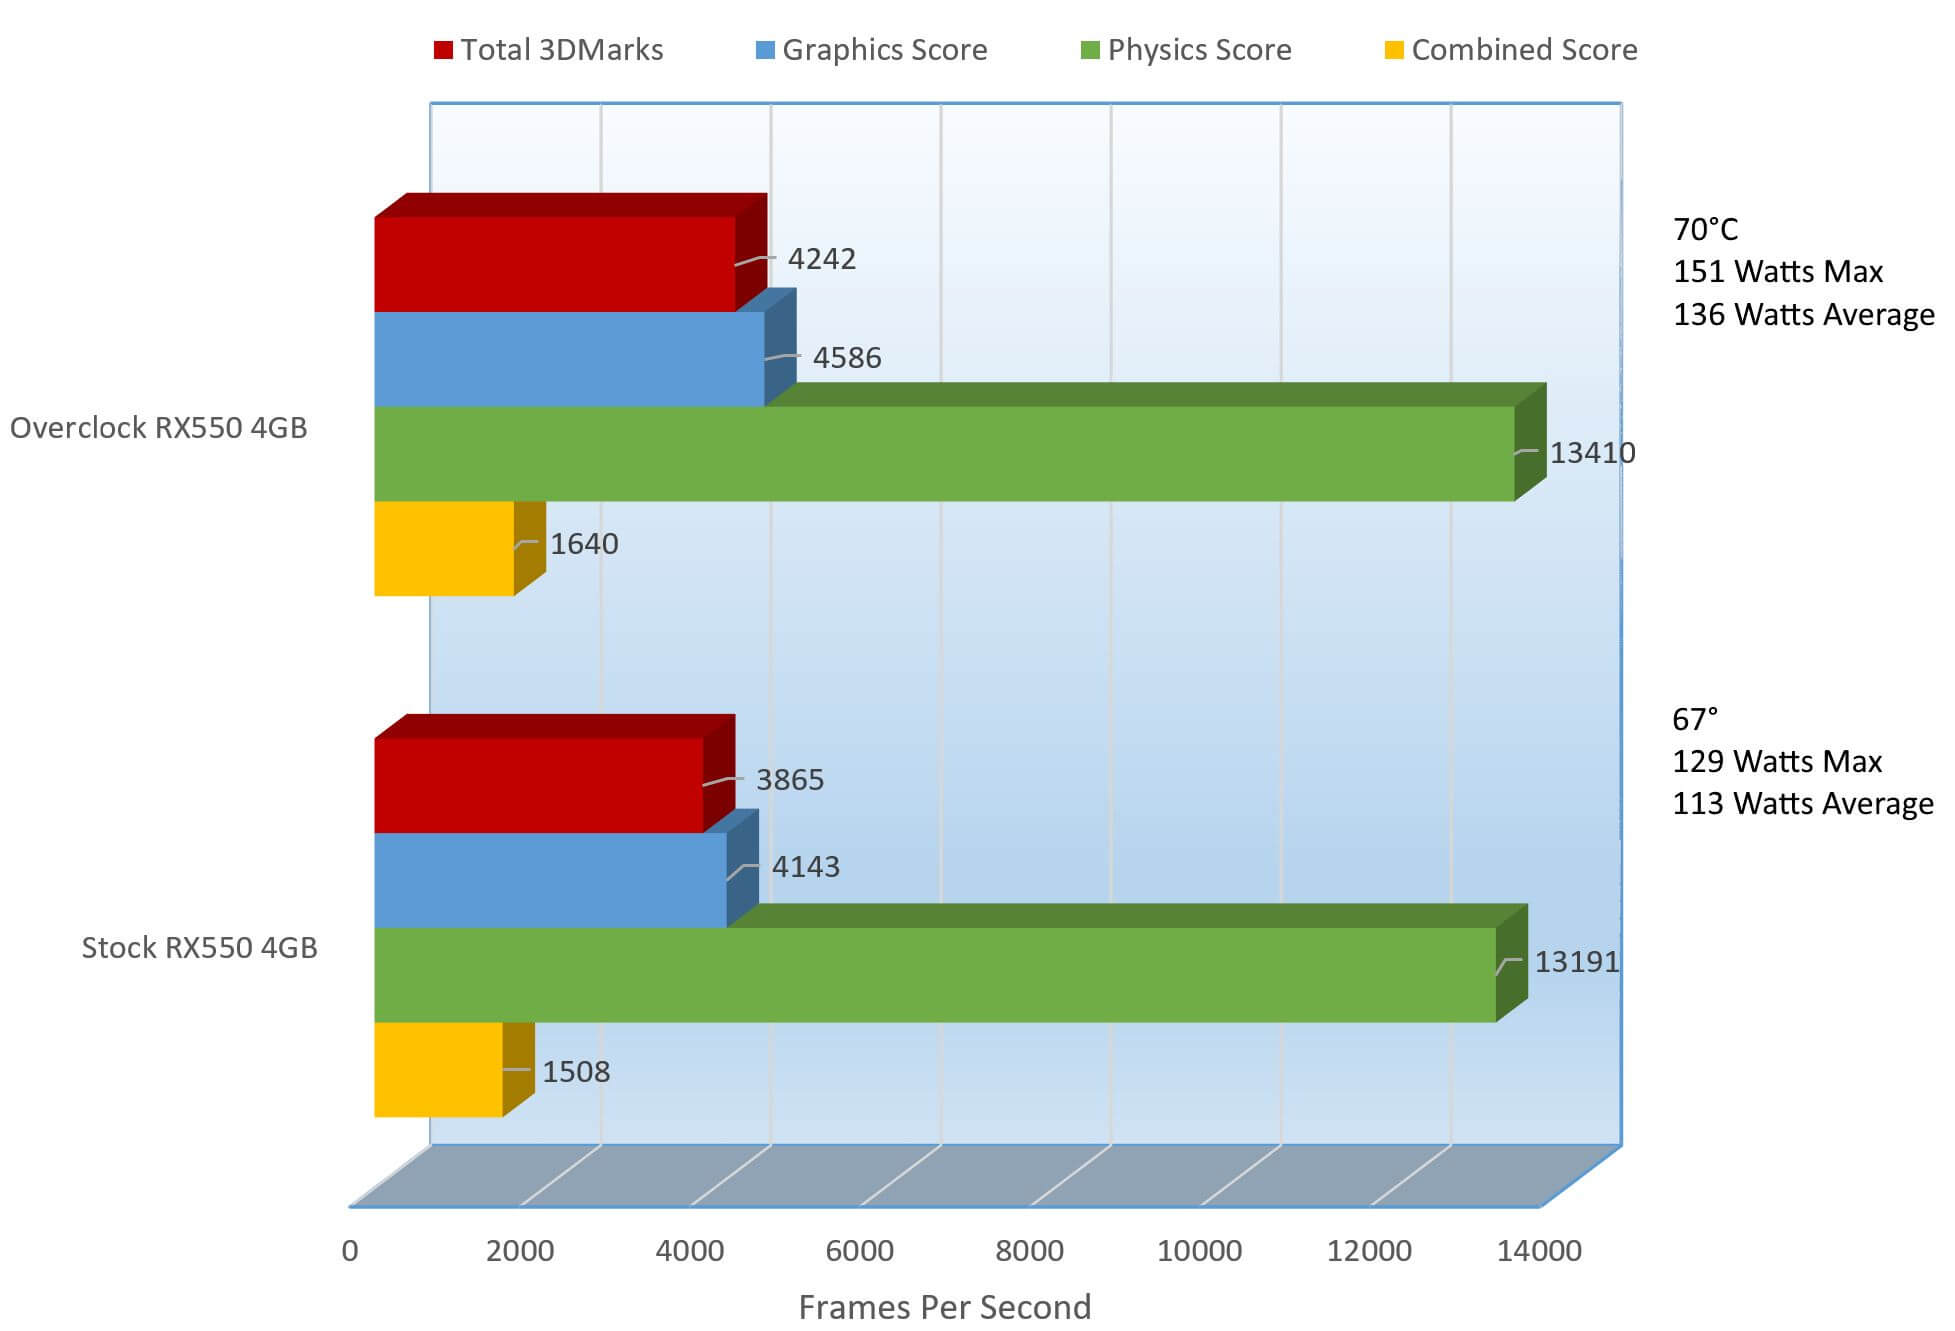
Across the board here on 3DMark, we can see improvements. The graphics score went up 9.66%, Physics score went up a measly 1.63% and lastly the Combined score went up 8.05%.
Let’s see how TimeSpy reacts to this bump.
From the stocks 1,379 we get the overclocks 1,518, a 9.16% increase. With that increase came an increase in thermals from 68°C up to 72°C, a 5.56% bump in power, not bad for extra performance. With that came and average increase in power usage from 113 Watts to 149 Watts a rather large increase of 24.16%.
That increase though did nothing for the rankings, but I was impressed. So let’s check out the complete comparison to see how the total score was formed.
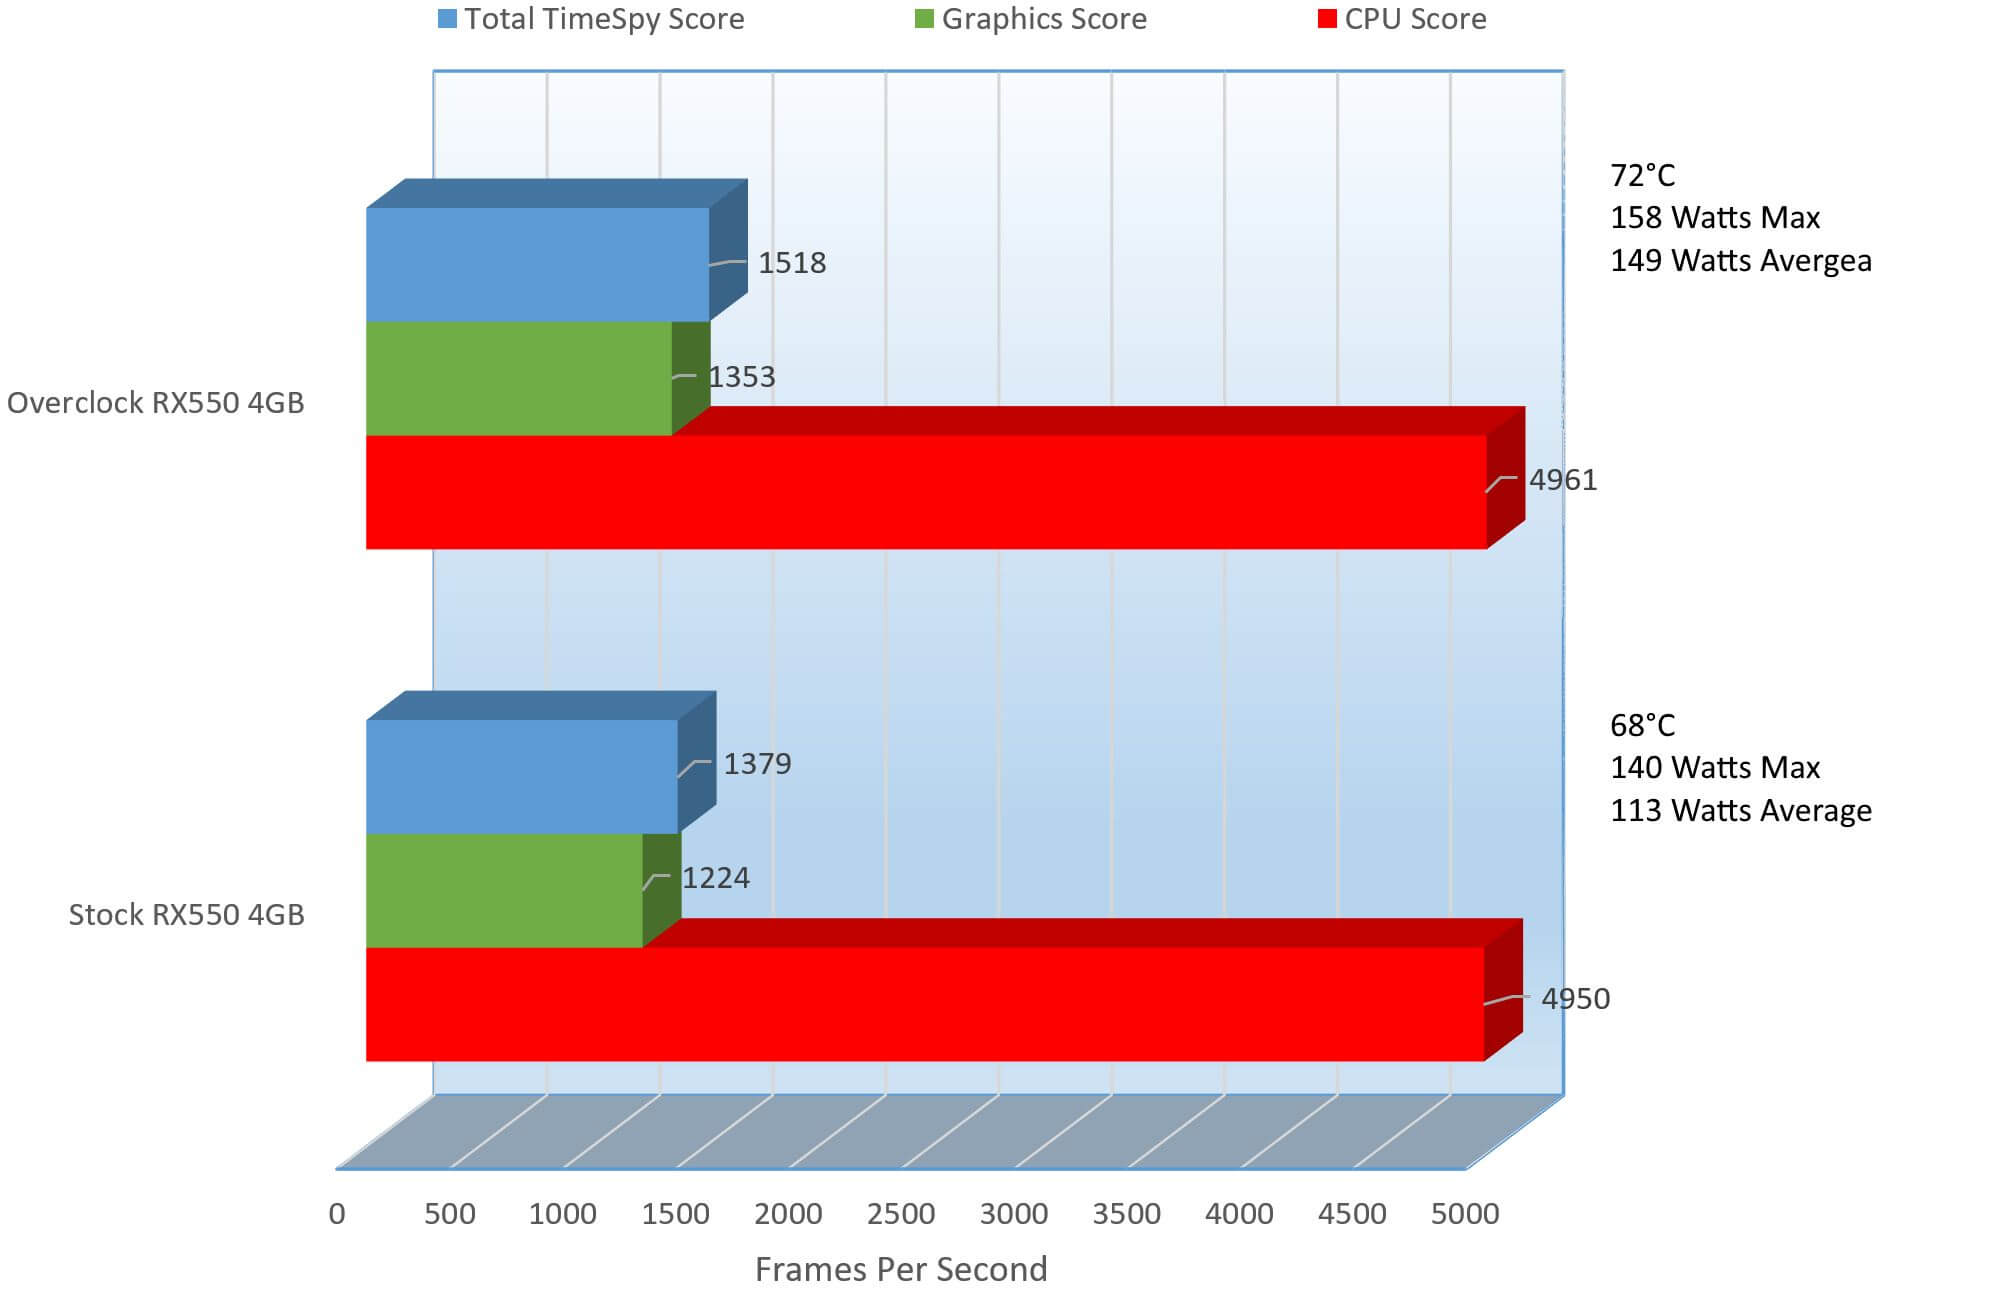
Yet again we can see a complete improvement in the results. On the graphics score we can see a 9.53% increase in performance and in the CPU score, even though we did not overclock the CPU at all, we can see a tiny but mention worthy 0.22% increase.
On the bad side, there was a 4 degree increase in thermals and a 24.16% increase in power utilization, but it is to be expected. The card now is working a bit harder, so it is understood that thermals and power consumption have gone up, though we could have lowered the heat by raising the fan speed, but they are still low enough, so I did not want to raise the noise level.
Let’s check to see if the results are as positive in games,… you know where they mater.
For the games, we are going to break the results sections by resolutions to make it a lot easier to read. We will start off with 1680 x 1050.
1680 x 1050
We are off to a good start here. On average, the overclock performed 8.01% higher with the same temperature, the fan does a real good job here. On the negative but to be expected side, we can see there was a 18.47% increase in power usage on average. The results prior to overclocking were already great, but let’s see what 1920 x 1080 will tell us.
1920 x 1080
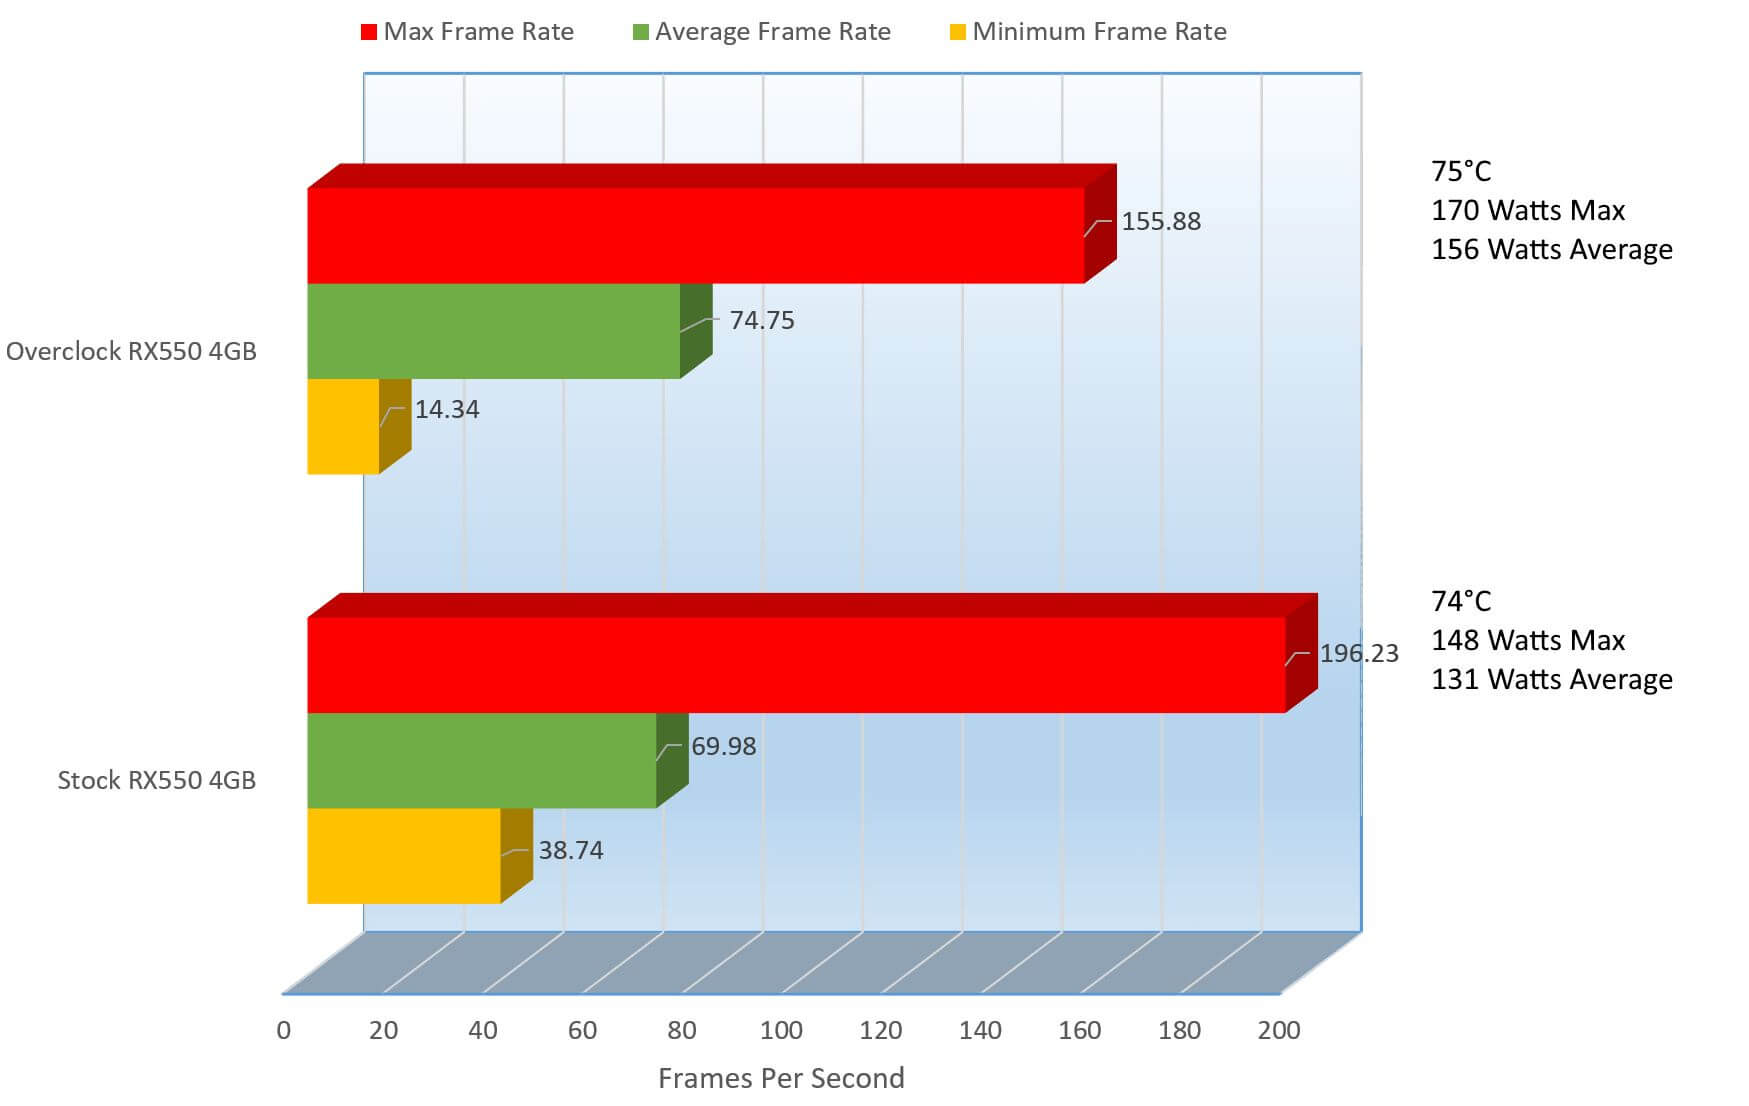
Yet again, the overclock is working in our favor, as it should of course with a few things to point out. Oddly enough, it seems the minimum and maximum frame rate dropped from 38.74 to 14.34, a 62.98% decrease and dropped 20.56% on the Max frame rate from 196.23 to 155.88 FPS. While these are odd, it seems that maybe the overclock keep things a little more under control as those FPS’ were already extreme, but more importantly it raised the average frame rate from 69.98 to 74.75 FPS, a 6.38% increase. I myself don’t really care what the max frame rate is, though the minimum can be a little scary at times because that means at any point in the game, it can hit that minimum FPS, and 14.34 is totally unplayable but it’s usually a quick blip.
So let’s check out 2560 x 1440.
2560 x 1440
So I have to say, I was let down here. I was kind of thinking it would raise the frame rate from 42.87 to somewhere in the 60’s but the frame rate only rose 6.36% to 45.78, still an improvement but not what I was hoping for. Regardless on that, we notice that the average power consumption went from 138 Watts to 156Watts an 11.54% increase. Even though the score only went up about 3 frames per second, it’s still an increase and the thermals stayed the same.
So in Metro Last Light, we did see some improvements, nothing huge, but sometimes all you need is a tiny bump to make something playable. So now let’s move on to Thief in which we did have a few problems with, let’s see if it helped out.
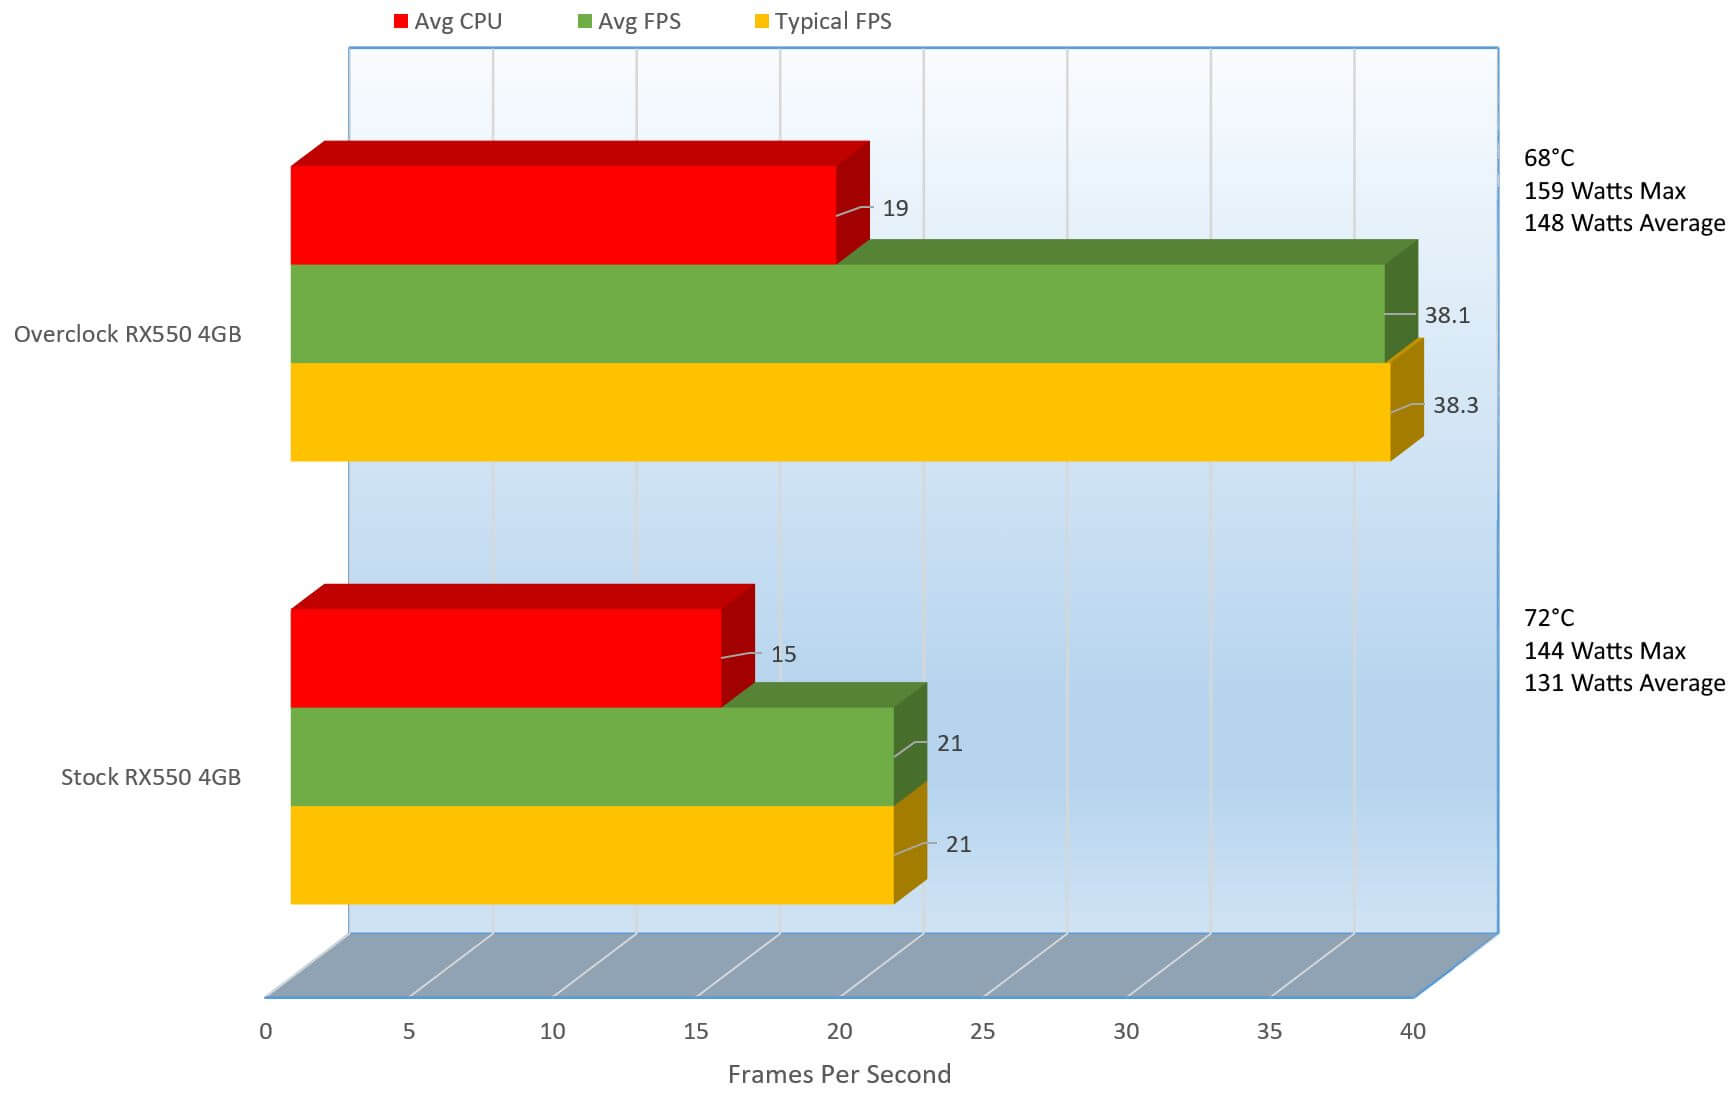
1680 x 1050
You know, and I was going to stop using Thief, but it looks like its kicking this cards butt. On the stock settings, the game was on the cusp of being playable at 52.2 (I would still play it like that) but the overclock actually made the game drop a frame per second, down to 51 frames per second. I mean, 1 frame per second is nothing really but still I would have expected some improvement. The electric company would be happy being that it now consumes 8.39% more power on average and actually got 6 degrees warmer as well. Let’s see what 1920 x 1080 will do for us.
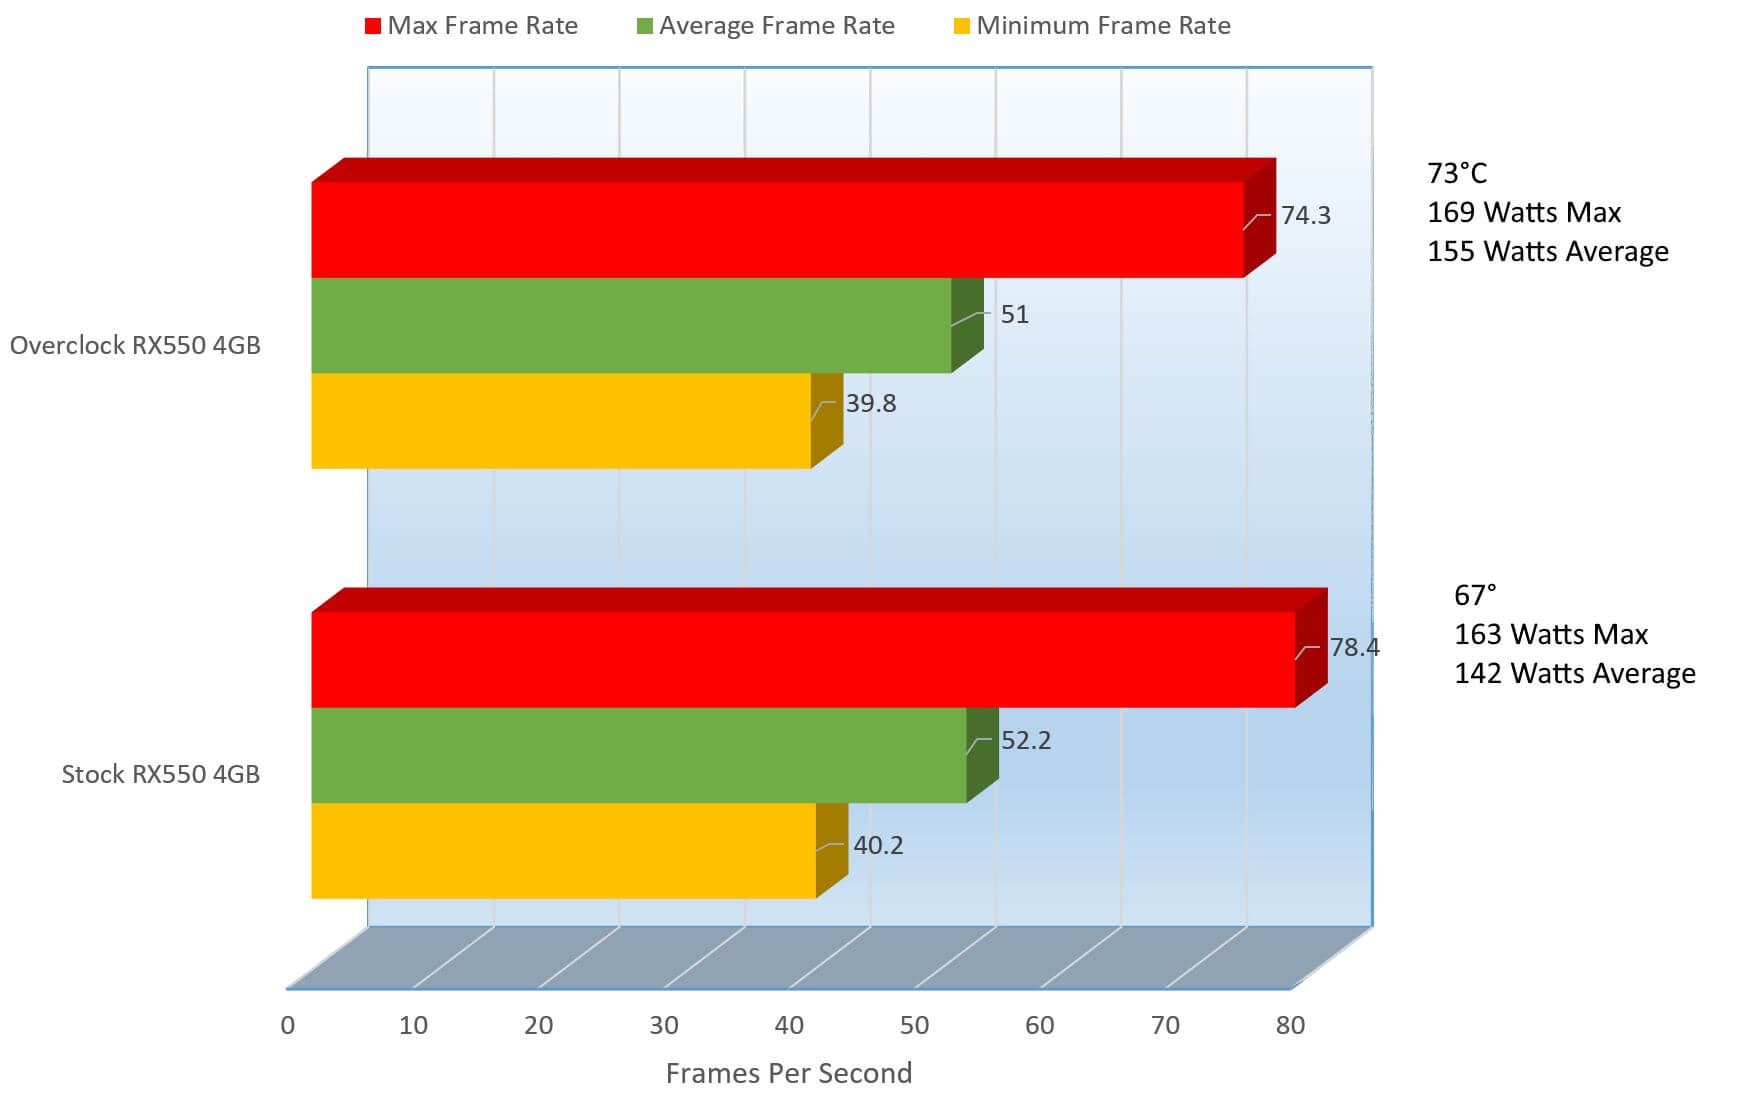
1920 x 1080
Well, it looks like the performance on Thief did not improve much here, but there has been some improvement at least. We can see on average we received 46.7 frames per second a 8.99% increase in performance and the heat did no go up at all, though the wattage increased by 16.23% from 129 Watts consumed on average to 154 Watts. Thief is really stealing performance here, I don’t know if we can expect any better, but let’s check on 2560 x 1440.
2560 x 1440
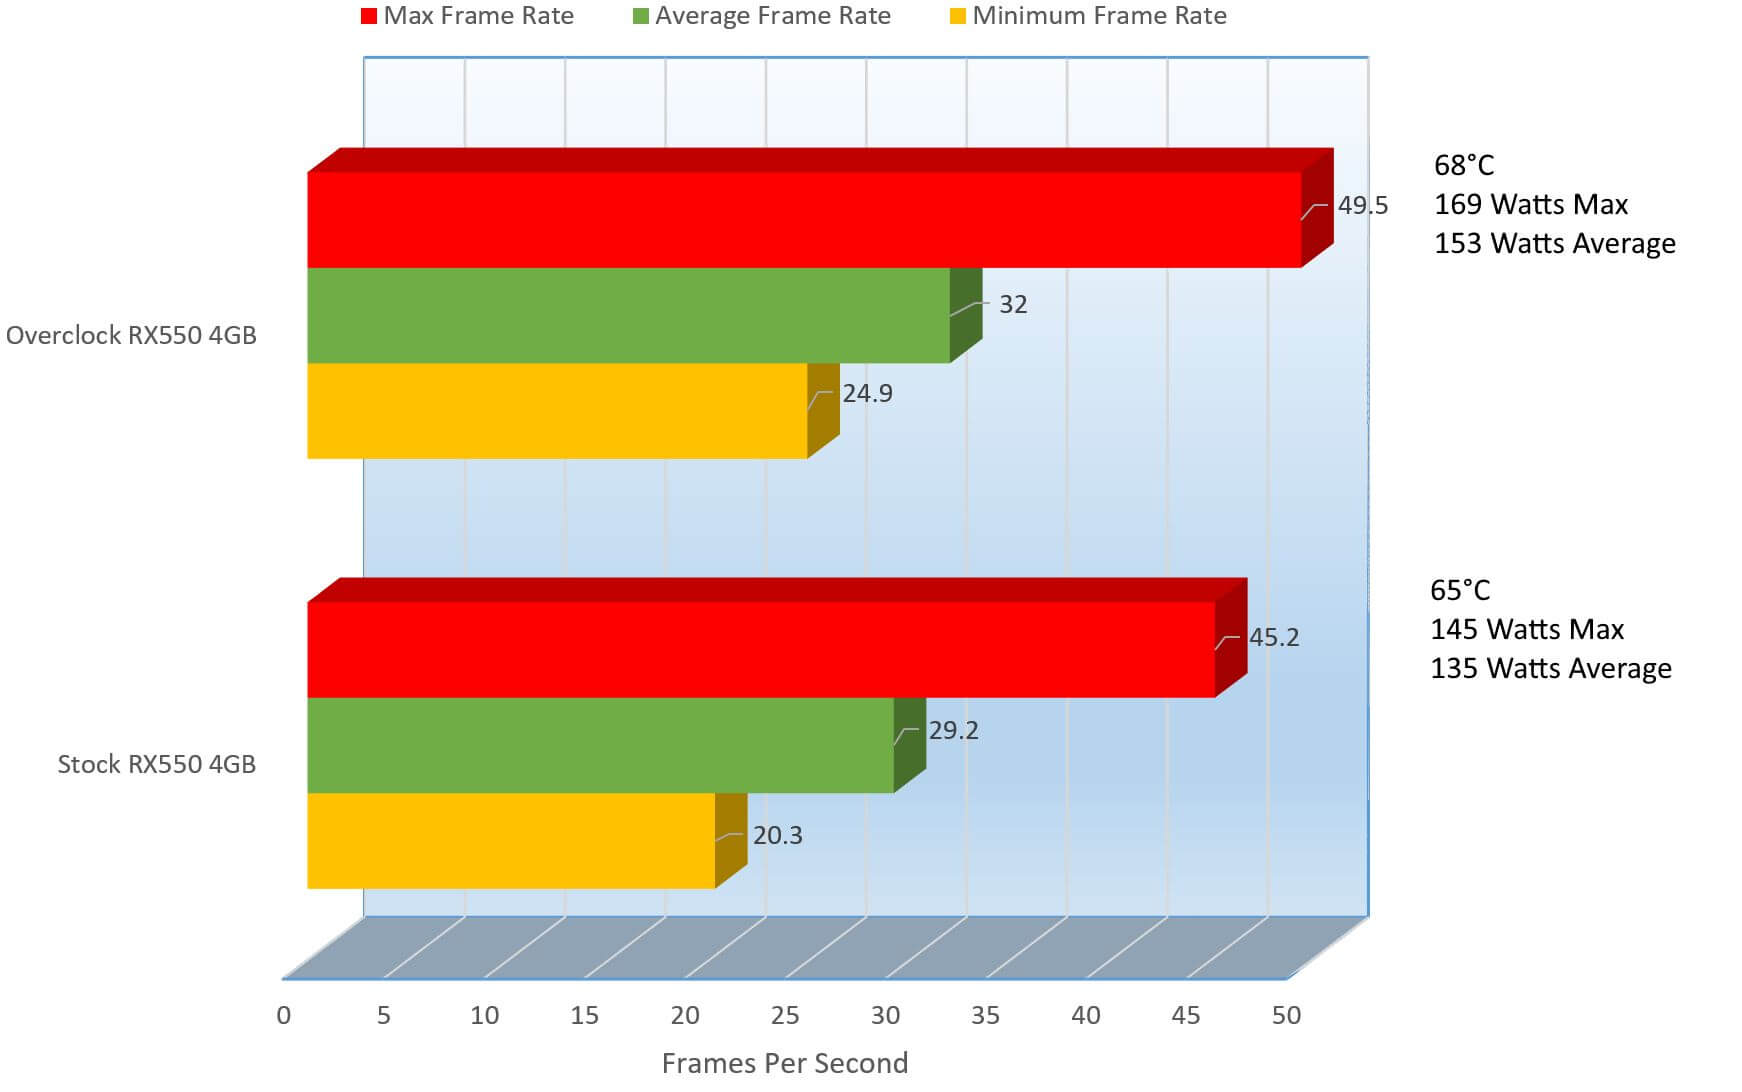
Yet again I feel a little disappointed here, trying to squeeze some more performance out of this card, I get only a tiny improvement. Maybe what I thought was a decently impressive overclock was only an incredibly slight bump, I will need to test Thief as well while I do my overclocks not only for stability but for improvement. On average, we can see 2.8 frame per second improvement at 32 frames per seconds, 8.75% above the stock score of 29.2. That bump only raised thermals by 3 degrees but raised the average wattage used by 11.76% starting at 15Watts to 153Watts on Average. Let’s see if Laura can boost my spirits.

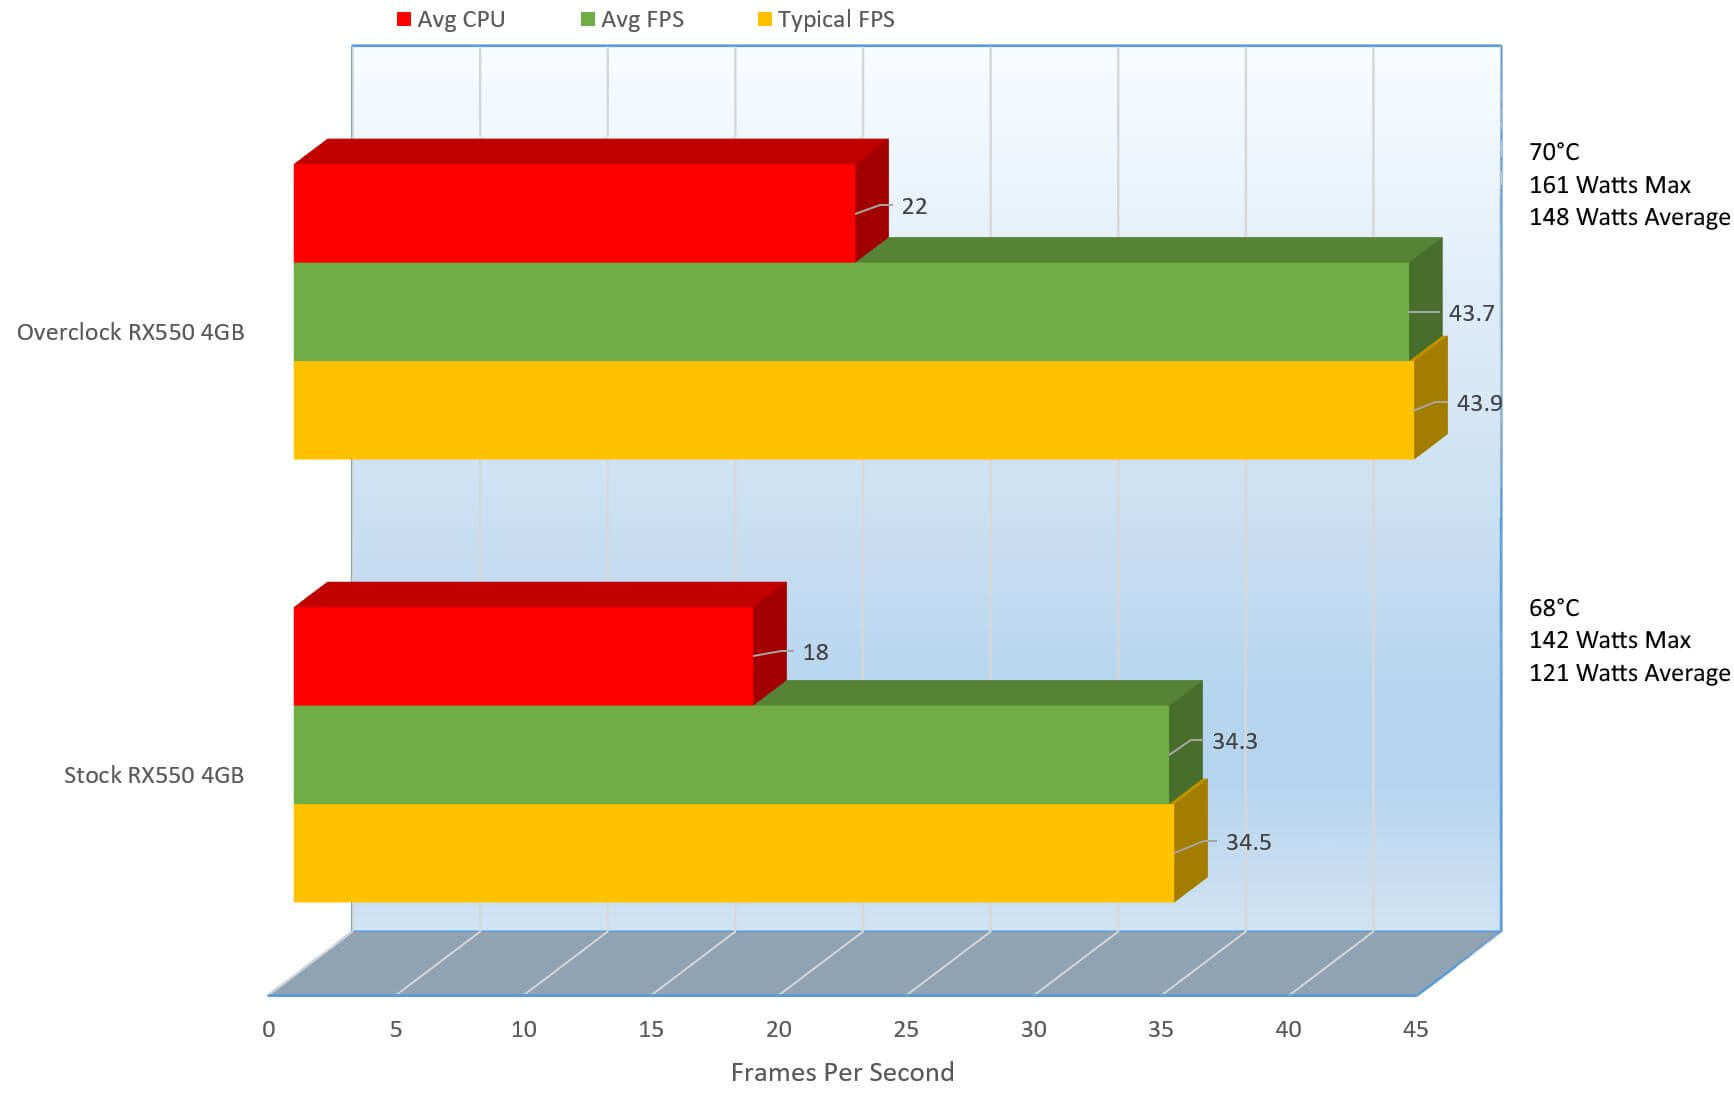
1680 x 1050
Ok, here we can see Tomb Raider picking up some slack, though it was already amazingly playable before at 96 FPS. On the overclock we pick up some steam on the average frame rate from 96 to 107 FPS, a 10.28% increase in performance. The temps kept the same along both tests but the average power consumption went up 17.57%. There was an improvement, let’s see what this means for 1080P and above.
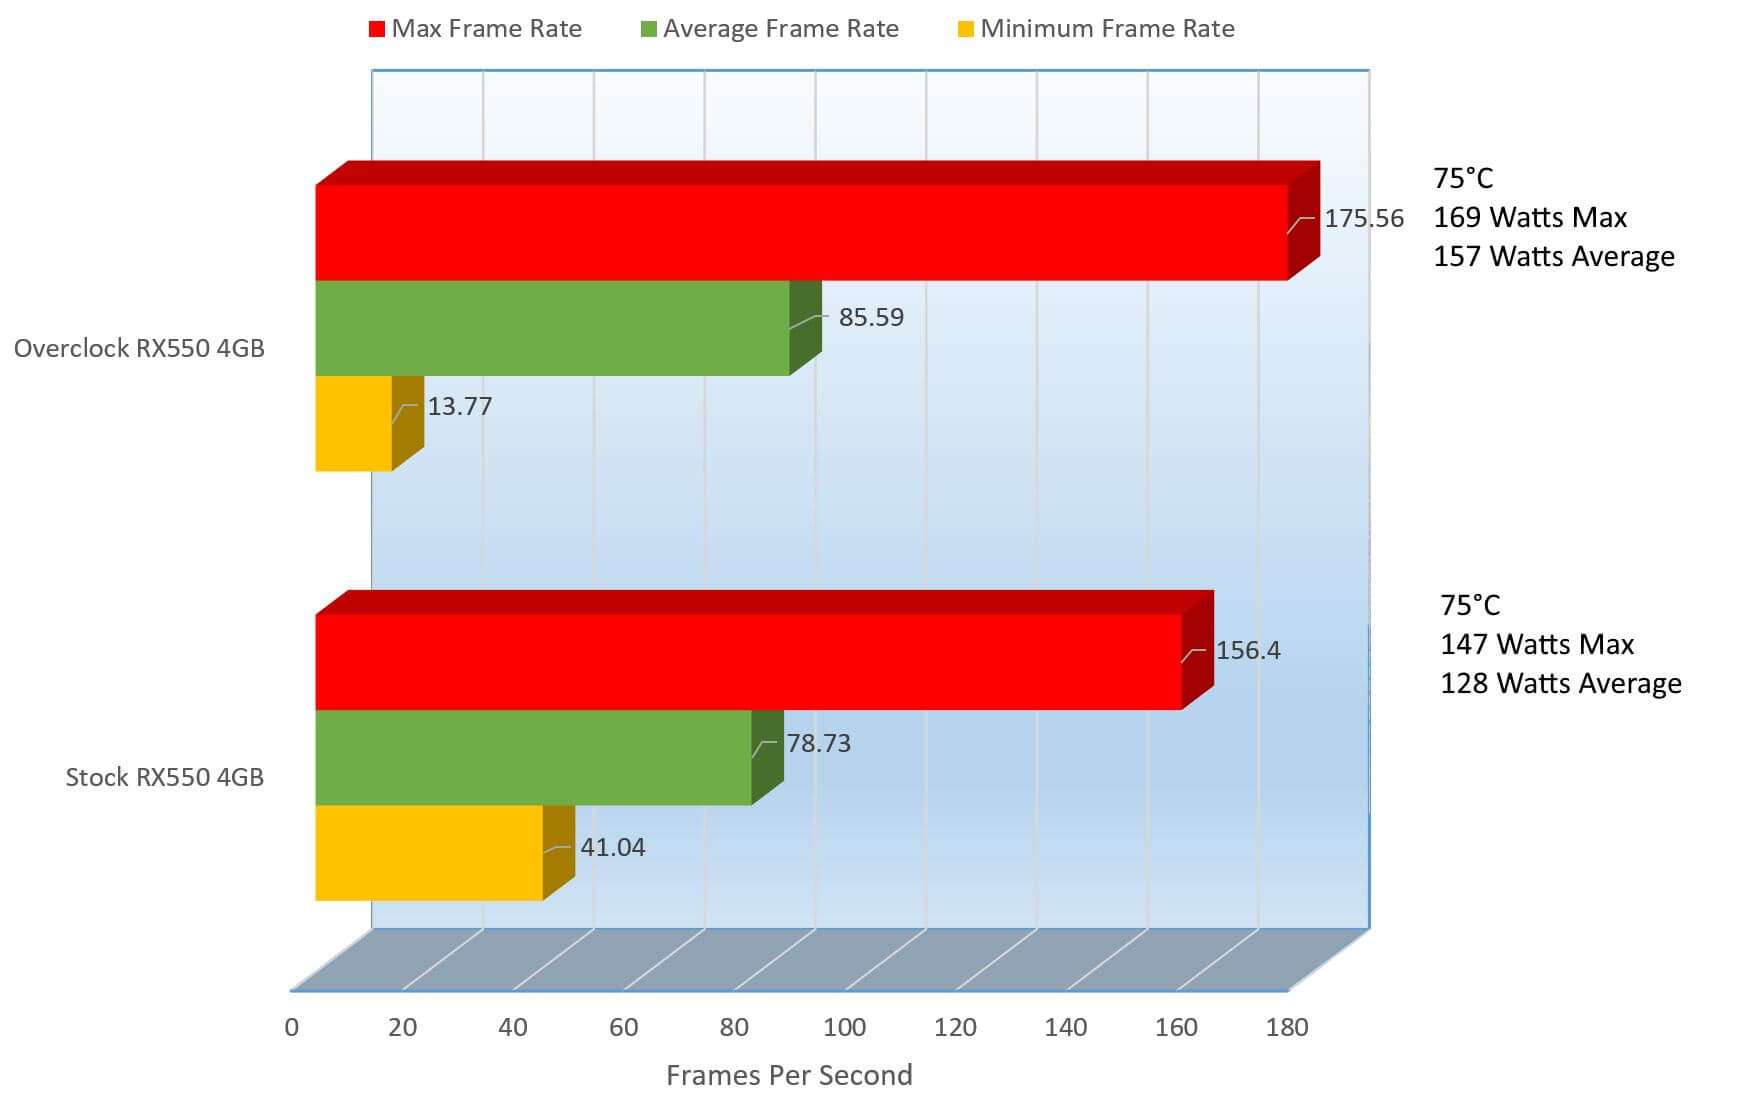
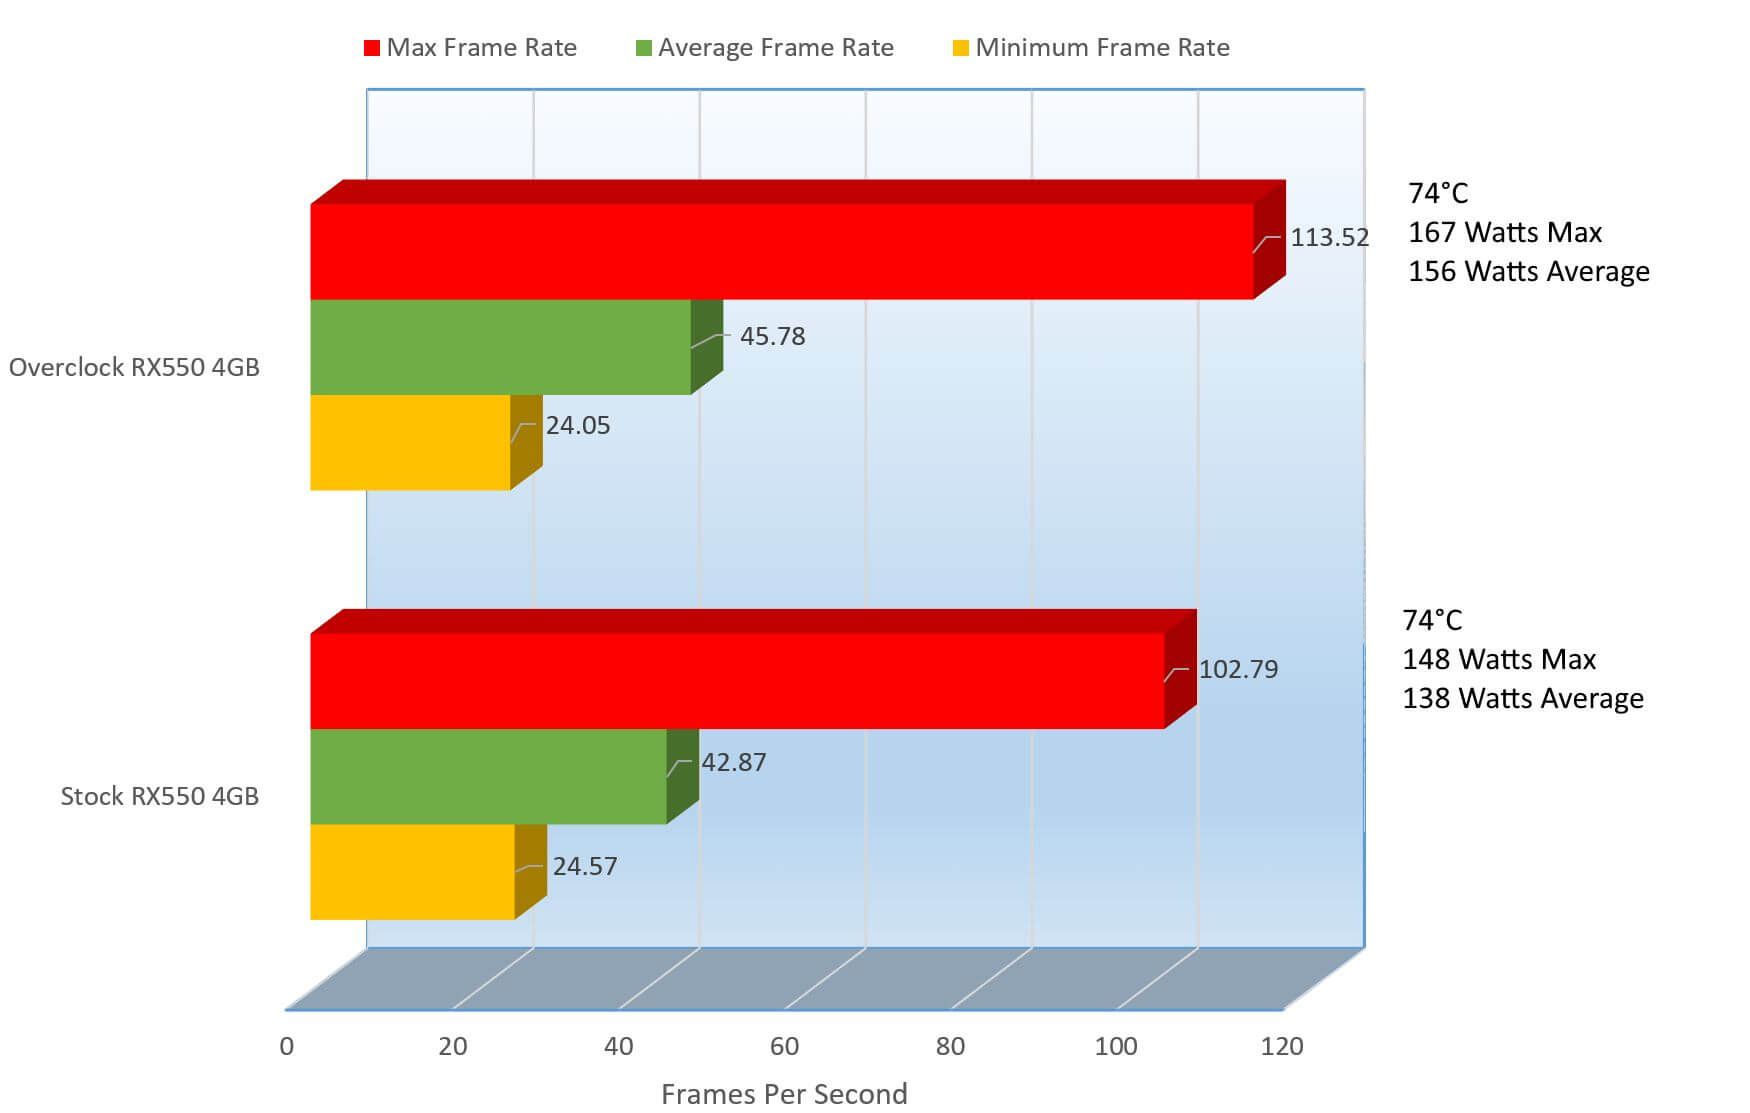
1920 x 1080
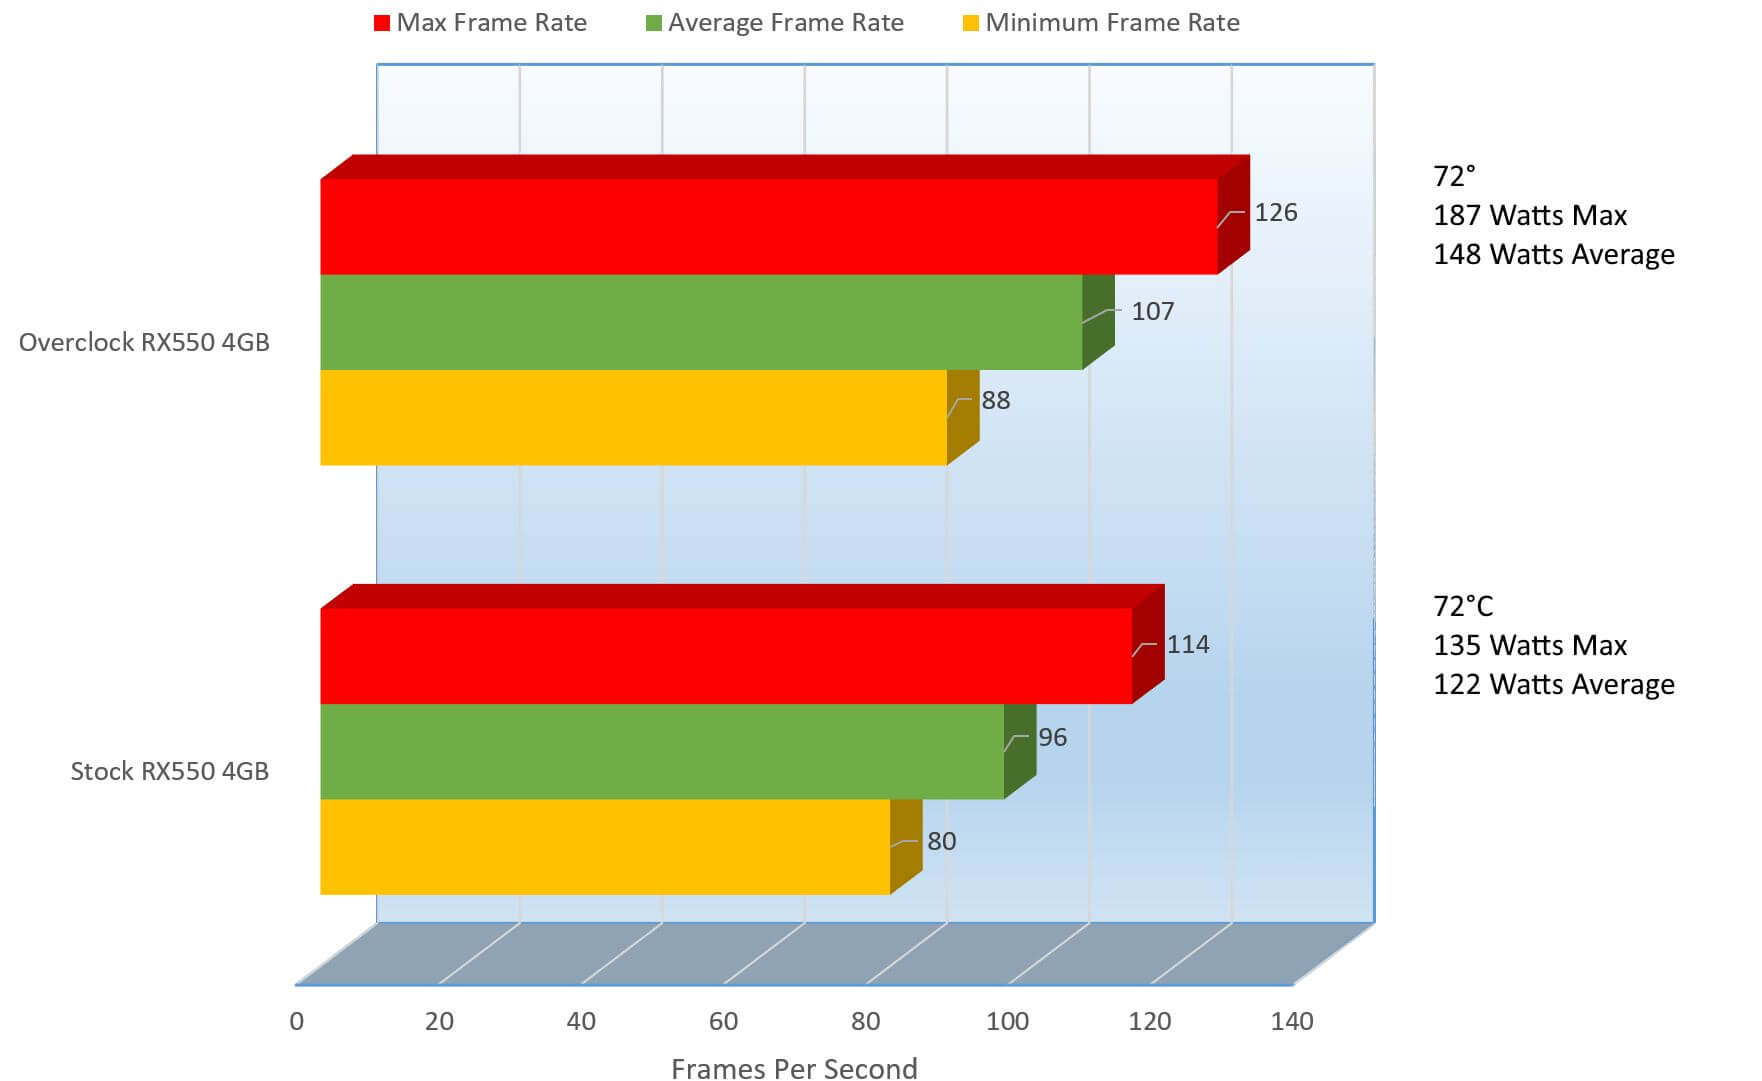
So even at 1920 x 1080 we can see that performance has improved at levels over what we saw on the previous tests at 1680 x 1050. At stock, we saw on average 84.3 frames per second, but we can see on the overclock a mark of 93.9 frames per second, that is a 10.22% increase. This time the heat did increase a bit from 68°C to 74°C, that’s an 8.11% increase in thermals and the power usage bumped up to 148 Watts from a stock 120 Watts on average, a 18.92% increase.
Let’s see if 2560 x 1440 offers up any more improvement.
2560 x 1440
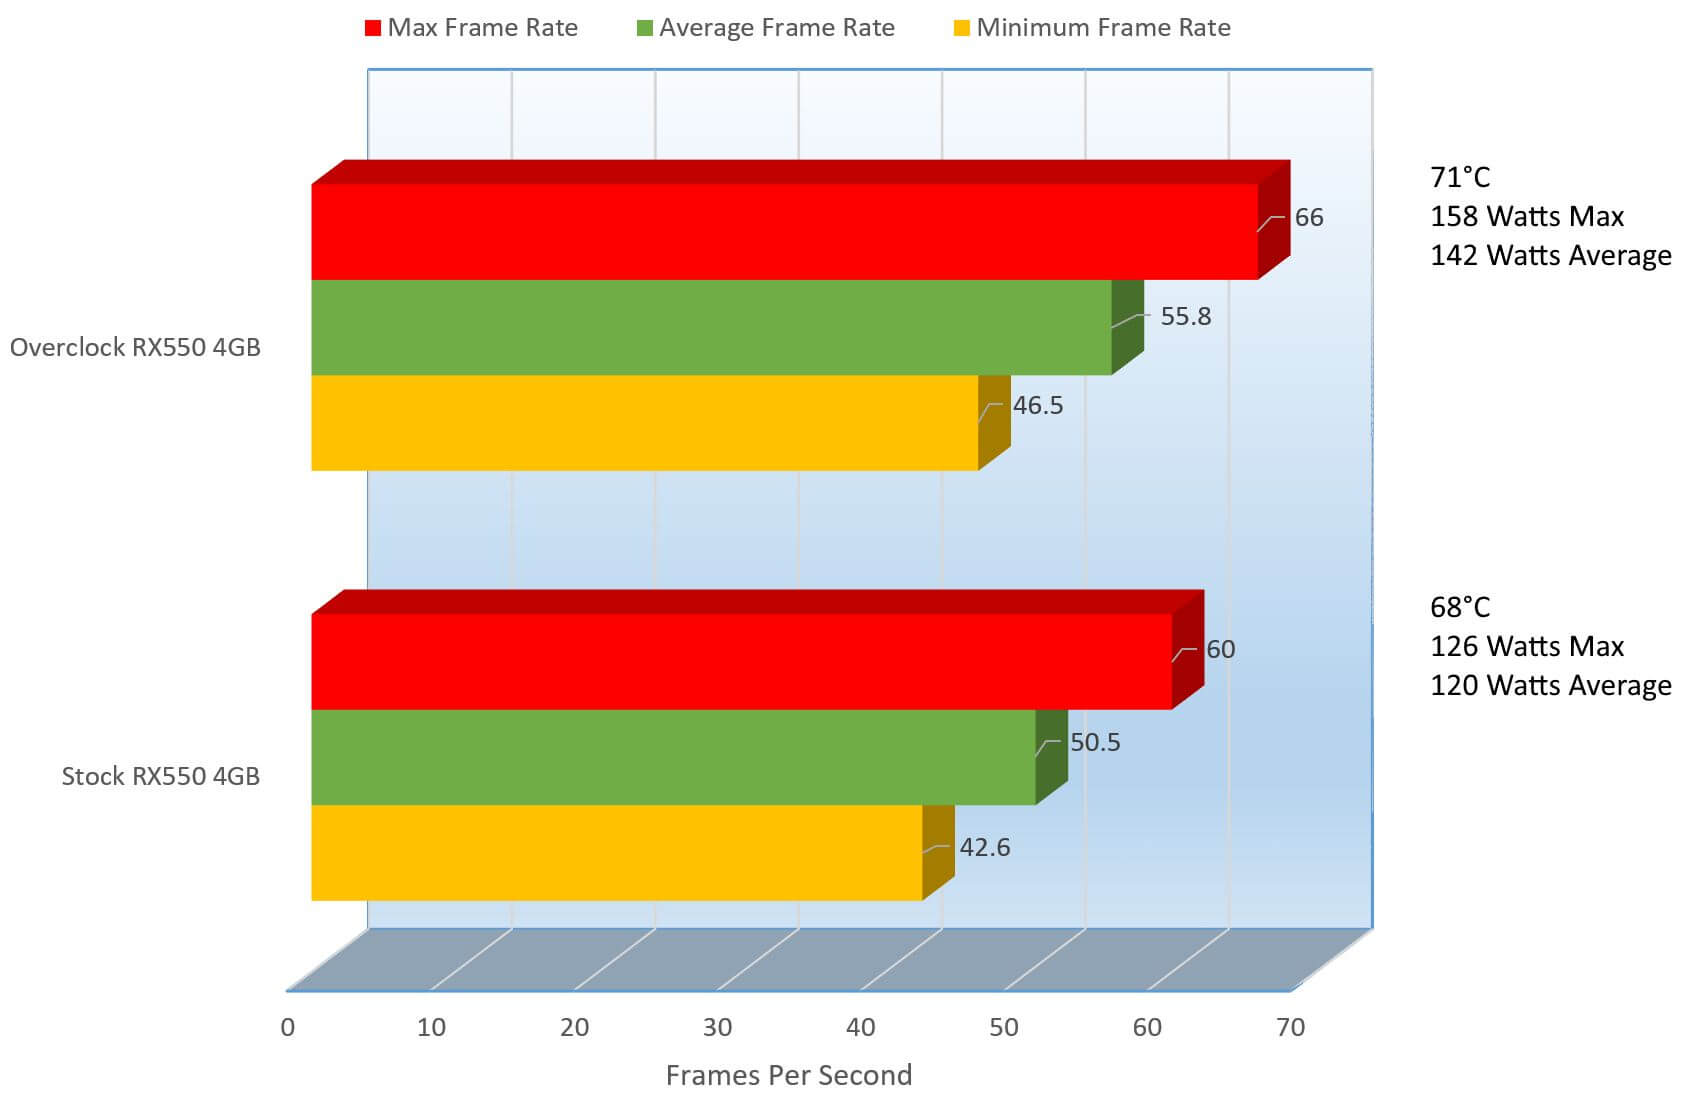
It was right there, surly a little more tweaking I could have hit and surpassed the magic number, though at 55.8 and 50.5 it was perfectly smooth. I watch all of these benchmarks, both in stock and overclock to see if I can find any sort of issues with the display and not only did I not see an issue, they both ran smooth.
Overclocked we get 55.8 frames per second a 9.50% increase in the performance of the stock score of 50.5 frames per second, a decent little bump. Of course, with that bump, we see a 3 degree increase in thermals which is not bad. At 2560 x 1440, we can see wattage being consumed on average at 142 Watts on the overclock, this is 15.49% high than the stock consumption of 120 Watts.
Tomb Raider performed great on this budget card, but let’s challenge it a little more with Tom Clancy’s The Division.

1680 x 1050
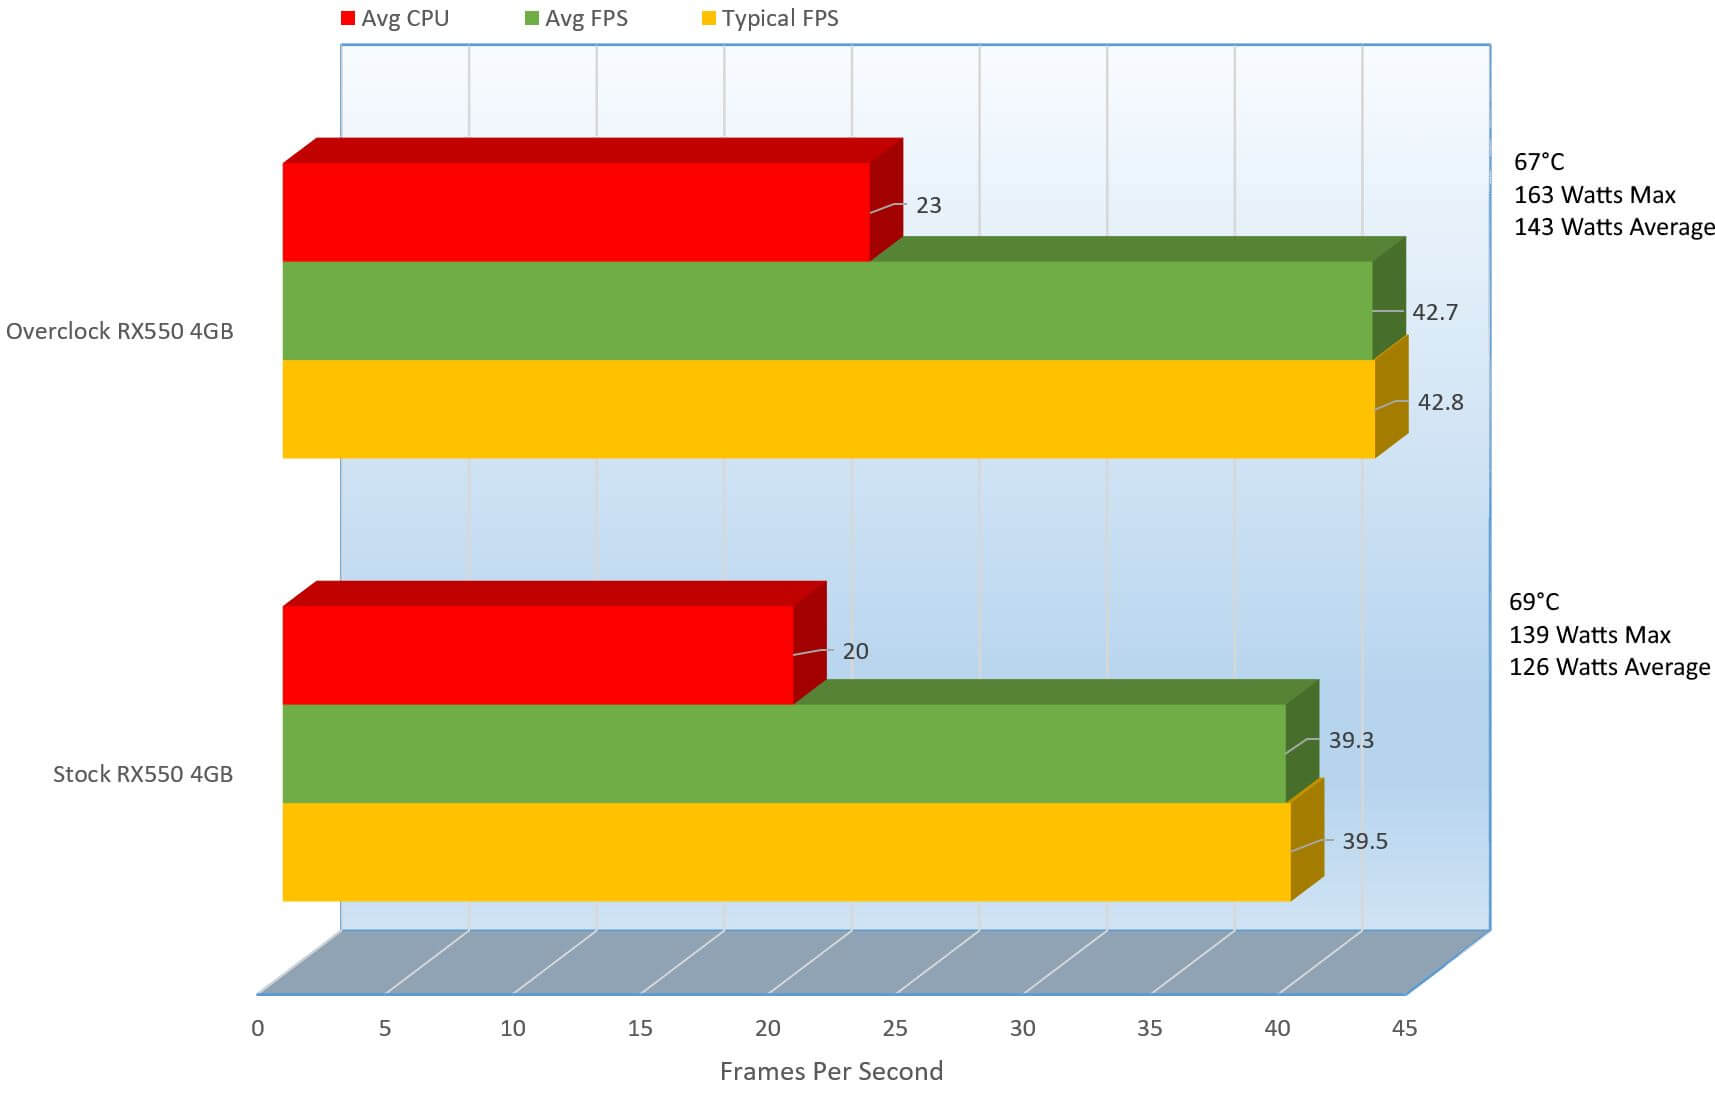
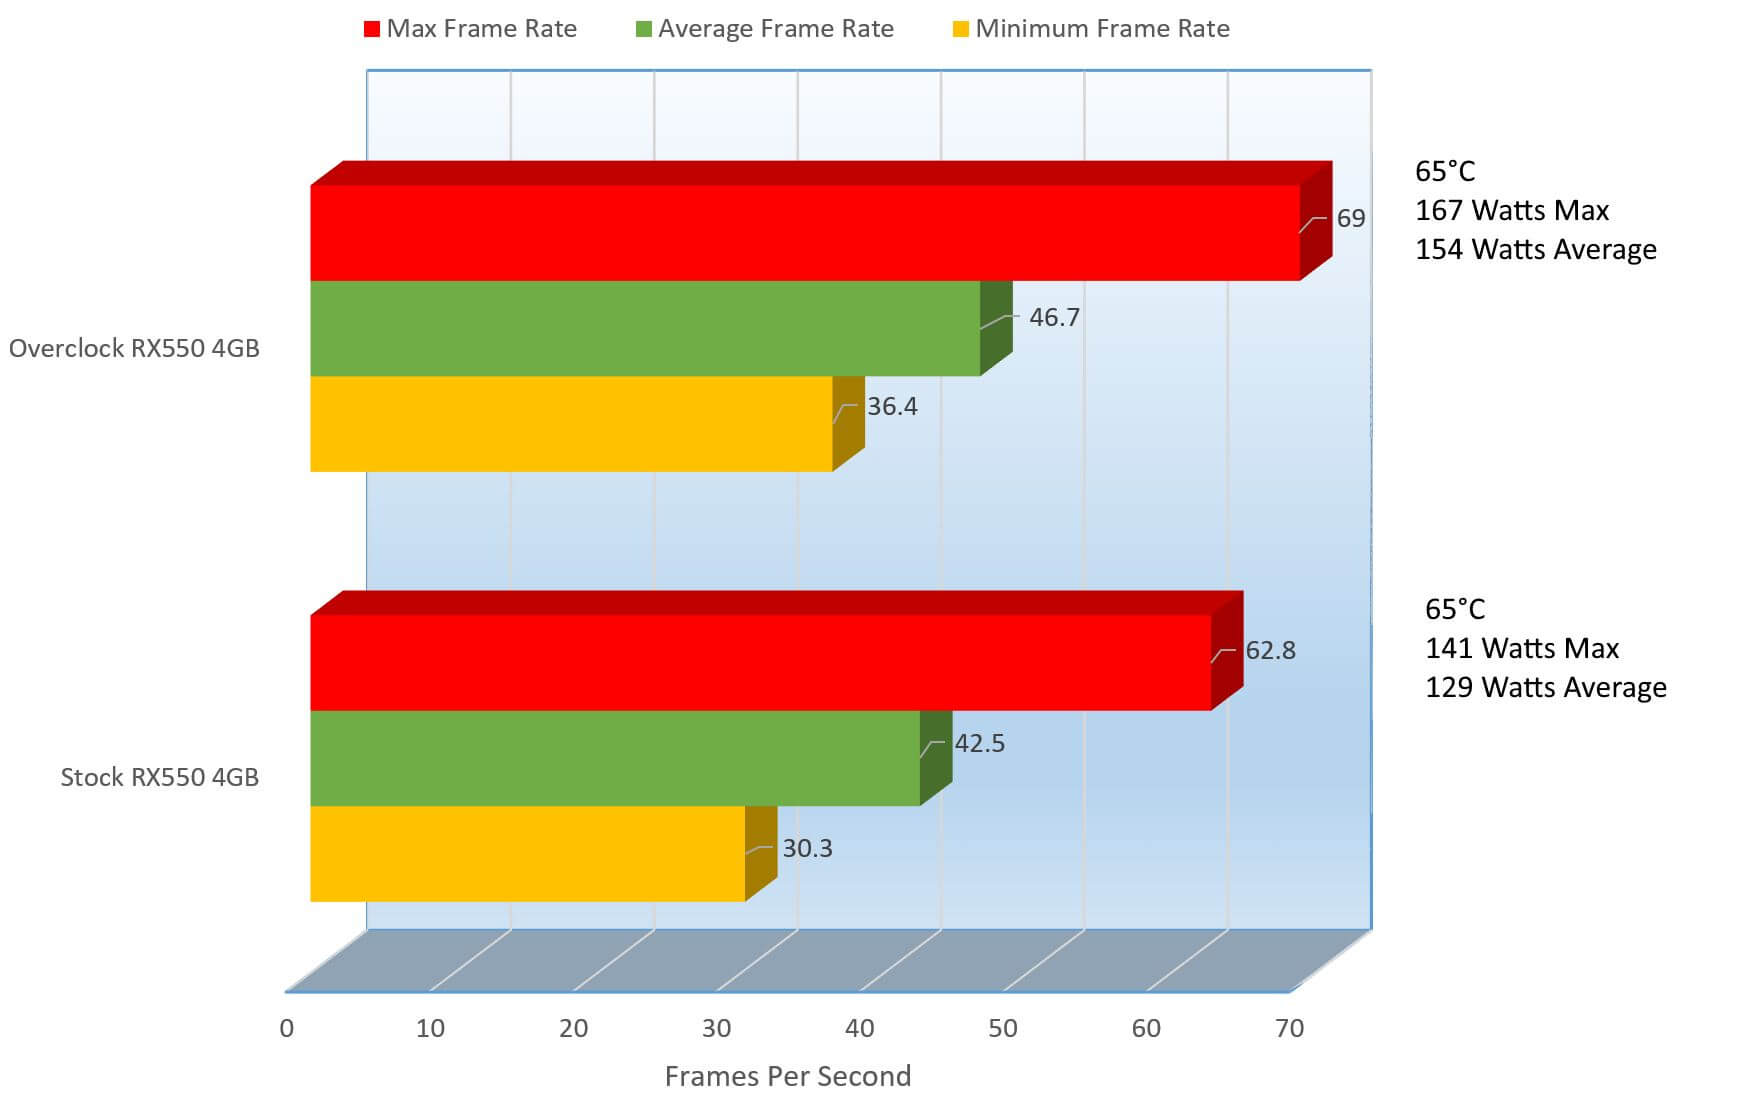
There is a slight improvement here in performance, but from stocks 39.3 FPS to the overclocks 42.7 there was a 7.96% increase in performance. Temperature actually dropped 2 degrees though power consumption did spike up to 143 over 126 Watts. On to 1920 x 1080.
1920 x 1080
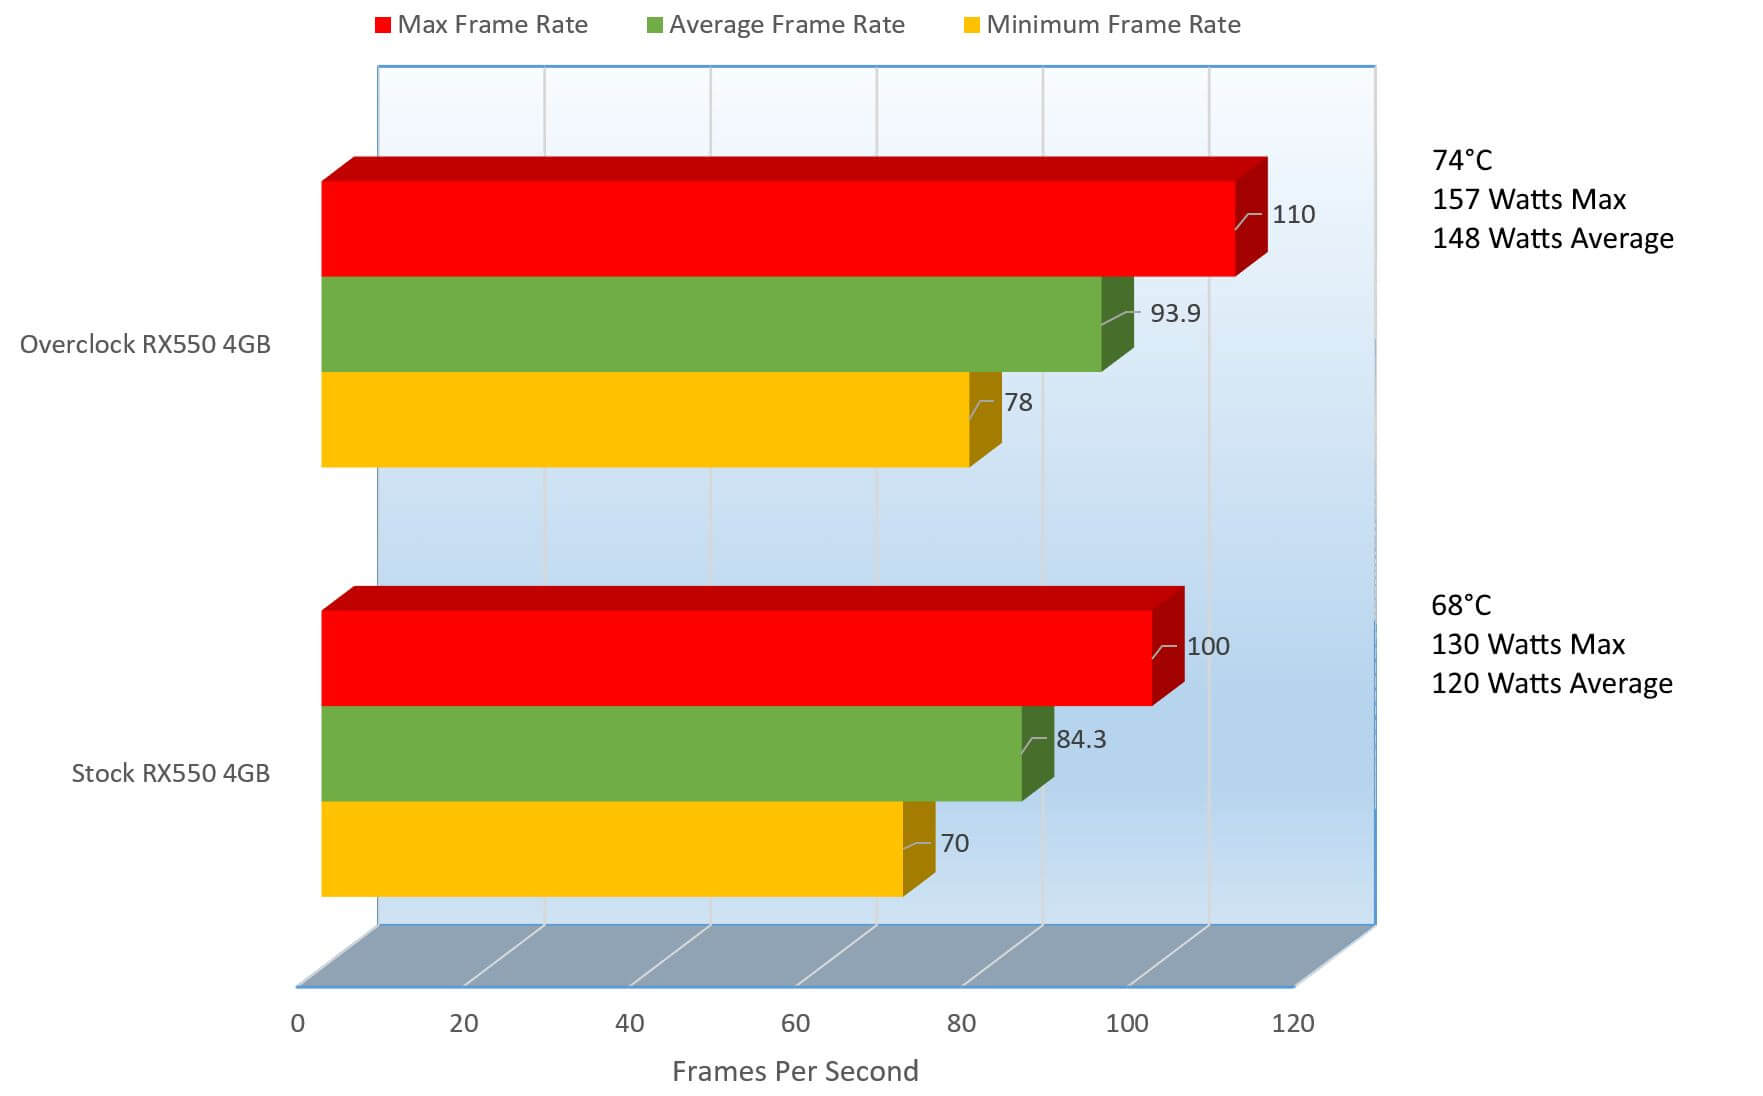
Actually, here the performance improved, came up a little from the lower resolution of 1680 x 1080, up 2.29% but from the stock speeds on the same resolution it rose a decent 21.51% which is very nice. The Wattage did increase with that as well from 121 on stock to 148 Watts on average, a 18.24% increase. Thankfully the thermals only increased 2 degrees, better performance for a tiny increase in heat is a good exchange. Let’s finish this up with 2560 x 1440.
2560 x 1440
Being that we are at 2K with a budget card and almost get to 40 frames per second is a good sign. On the overclock, you can see that there was a 44.88% increase in performance, 17.1 frames per second above the stocks 21 frames per second. The temperature did drop 4 degrees though the power consumption did actually increase by 11.49% from 131 Watts to 148 Watts on Average.
While the settings on this benchmark were set to Medium, some of the settings were high and maybe above what a “medium” game should be played at, so surely playing with these settings at 1080P will get you to 60 frames per second, maybe even at 2K, but don’t quote me on 2K. Anyway, I want to go into a little more detail as to how TRIXX works and what I did to do what I did.
[nextpage title=”TRIXX Overclocking and Card Utility”]
For the overclocks, there are quite a few applications to work with but since I am reviewing a Sapphire card and since they make the card, I figured it was best to use TRIXX. TRIXX aside from being Sapphire’s overclocking software is also used for a few other things of which I will go over here.

Before I show you how to overclock, we will go over some recommendations on how to overclock starting off with the GPU. These are recommendations and not rules, that being said you will want to find your own overclock. The overclock I created potentially will not work on your card or your overclock might be much better than mine, not all GPU’s are the same. Another thing to mention is that as drivers get released and refined, overclocks could perform even better, or maybe even worse, it happens from time to time.
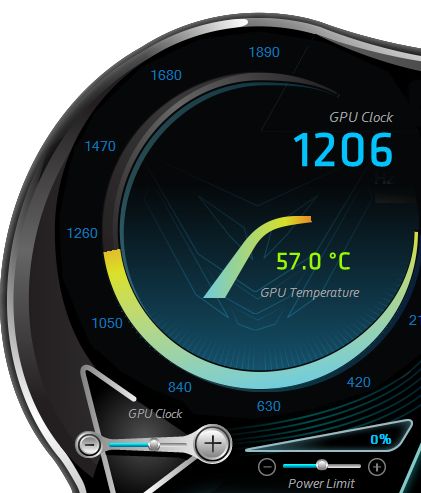
This upper left-hand corner shows how many Mhz the GPU is currently running at and also shows you the temperature of the GPU. The default GPU clock is 1206Mhz and the temperature at least here is at 57.0°C. I recommend overclocking is 5Mhz at a time and you can raise the GPU speed clock by click the + on the “GPU Clock” bar or – to lower the GPU Clock. I recommend writing each change down to backtrack in case you go too high.
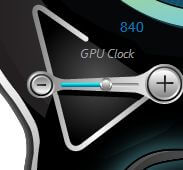
When reach the results, write it down as I mentioned and then click “Apply” on the bottom right hand corner, but we will get there in a minute so I can show you where it’s at exactly.

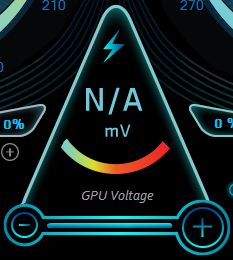
During your testing, if the machine freezes or you notice artifacting or tearing (spots appearing on the screen, missing or odd-looking textures) then it’s time to raise the “Power Limit” bar. I would mention to raise the GPU Voltage as well, but this setting on this card seems to be disabled.

As you are raising the GPU Clock, you may also want to work on the Fan Speed, though I left this one on automatic. To open up the “Custom Fan Speed” section, click “Custom”, which will open up the “Custom Fan Speed” section where you can raise/lower the fan bar. As you raise the clock speeds, power limit and GPU voltages the card will get hotter.
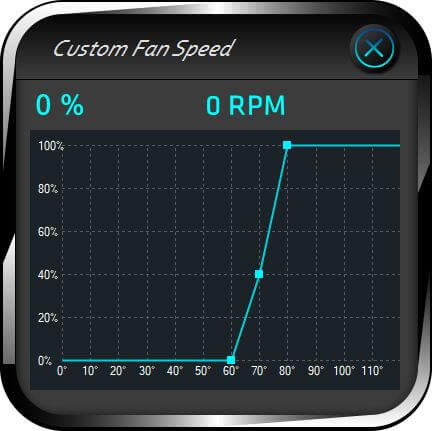
Again, in my overclock I did not touch this setting.
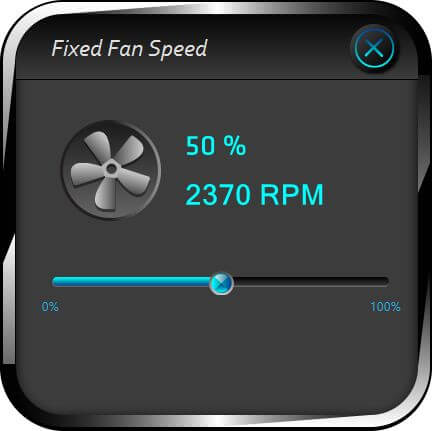
If you click the “Fixed” button, it will bring up these selections where you can set the fixed fan speed. Setting this will keep the fan at the RPM you select. Unless you are setting it to max, I would not touch this.

Once you have reached a stable GPU speed that you like and achieved adequate cooling then I recommend you start working the same process on the Memory Clock.
I would recommend saving your work too, you can do this on the profiles.

You can click on any one of those numbers and click “Save” the settings.

You will want to use the same methods for Memory Clock that I mentioned for GPU Clock.
Here you will raise the “Memory Clock” slider.

Like I mentioned previously, click “Apply” to apply the settings.
So that you have an idea of how the card sounds, check this video out
This is what I came up with; let me know what you got?

Settings, will give you the following options.
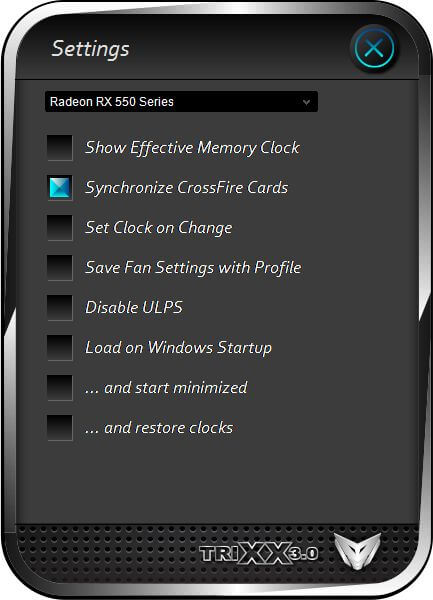
Settings allows you to show effective memory clock instead of the actual clock speed, Synchronize Crossfire Cards, Set Clock on Change, Save Fan Settings with Profile, Disable ULPS (ULPS: Ultra Low Power State: a sleep state that lowers the frequencies and voltages of primary and non-primary cards to save power, it can also cause instabilities with Crossfire and single card configurations). The other settings are to be able to “Load on Windows Startup”, start TRIXX minimized and restore clocks.
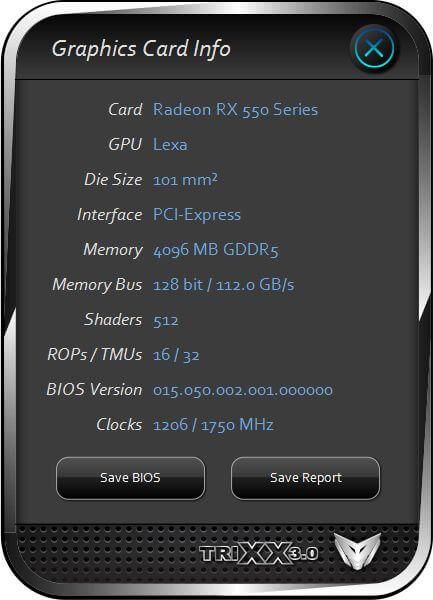
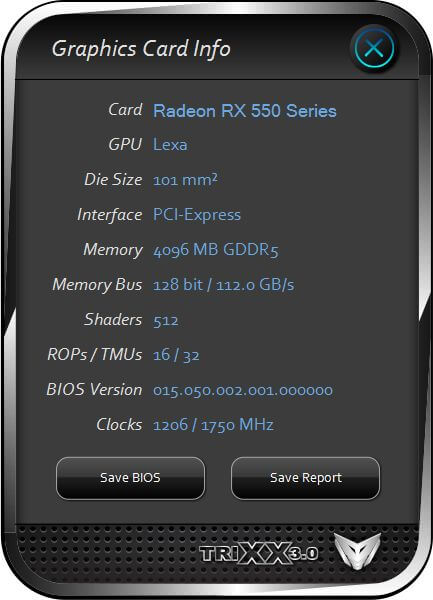
There is also “Graphics Card Info” which shows you information on the card. Most of the information is static information, of course if anything did change it would update, for example when I overclocked, it showed the clock speeds.
Here are the stock settings:
And here are the overclocked settings:

This allows you to also “Save the BIOS” to store for your own purposes, give to a friend, share with the community or maybe adjust using another piece of software and reflash back to the card.
Hardware Monitor, allows you to see all of the specs of the card in real life, as you are overclocking and maybe running through games and benchmarks. Here you can see where the voltages are maybe if the benchmark fails, then make adjustments or if maybe the voltages are needlessly high, you can adjust looking through here as well.
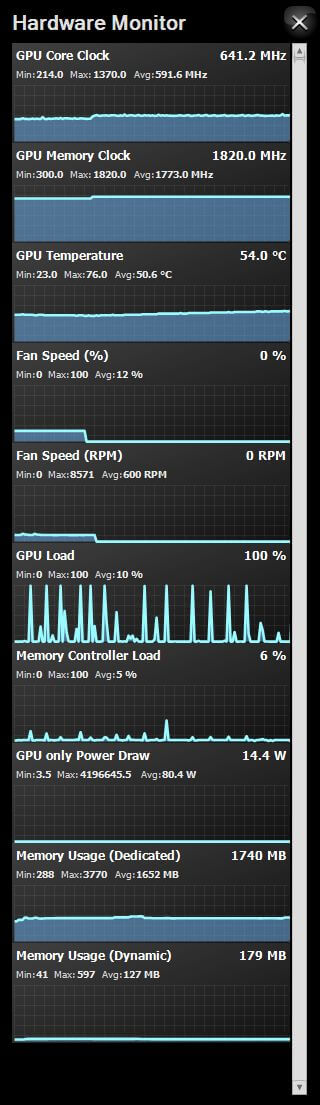
And “Log Now” allows you to create a log to save your metrics of the sensors. Its output is similar to that of GPU-Z.
Alright then going over everything we have, I think it’s time to see just exactly what I thought of this card and my final rating.
[nextpage title=”Final Thoughts and Conclusion”]
Now let’s check out the Pros and Cons to help me gather my thoughts on this, let me know what you think.
Pros
- Supports up to 3 different displays simultaneously
- FreeSync Support
- Supports DX12
- Intelligent Fan Control III keeps this card very quiet and cool.
- Affordable for the speeds provided and headroom
- Sapphire TRIXX 3.0 is a nice Utility
- Overclocks very well to achieve speeds and performance of the 560 and above
- Very low requirements
Cons
- Does not include any adapters or adapter cables
- Could be important for people that have 2 x DVI Monitors, 3 x HDMI Monitors, 3 x DP monitors, etc…
The PULSE series is a cost down version of the NITRO series card, no RGB, no Dual BIOS support or LED controls and that’s OK, it really is. This is a budget card that provides you a decent amount of outputs, overclocking potential and performance with it. You cannot expect too much eye candy, though as you saw previously, it looks like you can get a bit and keep performance up. The card is also amazingly quiet.
While it does have a host of different ways to connect your monitor (2 x HDMI, 2 x DP, DVI-D) it does not include additional adapters.
It cannot handle the highest end of games with everything maxed out and give you 60FPS or higher but it is an amazingly affordable card that can do so much.
I am giving this card 5 out of 5 Stars, an Editor’s Choice because of what it can do for how much you pay. It has great performance for being a lower tier card, you can easily get the performance of the next card up, the RX560 and above. You can just as easily save for another week or 2 and get the 570 or even a 580 and overclock that too. Also remember, the price is low as it is, it can only go lower.

Great job Sapphire.
We are influencers and brand affiliates. This post contains affiliate links, most which go to Amazon and are Geo-Affiliate links to nearest Amazon store.
I have spent many years in the PC boutique name space as Product Development Engineer for Alienware and later Dell through Alienware’s acquisition and finally Velocity Micro. During these years I spent my time developing new configurations, products and technologies with companies such as AMD, Asus, Intel, Microsoft, NVIDIA and more. The Arts, Gaming, New & Old technologies drive my interests and passion. Now as my day job, I am an IT Manager but doing reviews on my time and my dime.