
We are influencers and brand affiliates. This post contains affiliate links, most which go to Amazon and are Geo-Affiliate links to nearest Amazon store.
Hello all my fellow gamers and video card performance aficionados out there. Today I have the pleasure of reviewing for you the Sapphire Radeon NITRO R9 390 8GB GDDR5 Tri-X OC video card. Sapphire being one of AMD’s premiere board partners will surely help to keep AMD’s fire, that was not a play on words and you will see why throughout this review. One other thing about this card, its Sapphire’s latest series, the NITRO series. Hopefully I can help your decision on what video card to buy next.
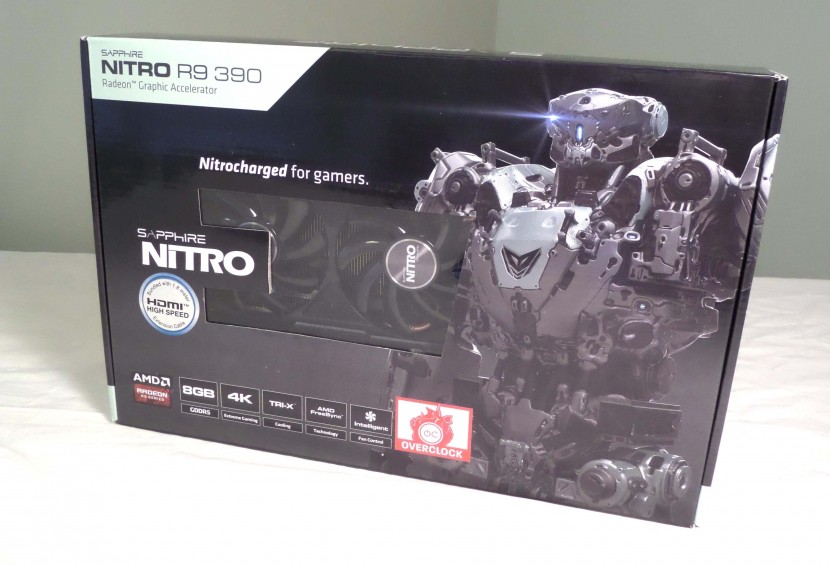
Let’s check out the specs
Spec’s and Features
- Core Speed: 1010Mhz
- 8192MB GDDR5 RAM
- 1500Mhz
- 6000MHz Effective Memory Frequency
- Supports Crossfire
- 4K Support
- Quad HD Display 4K*2K Support
- Supports a Maximum of 5 Displays
- 1 x DVI-D
- Up to 2560×1600 Dual link
- Up to 1920×1200 Single Link
- 1 x HDMI
- Up to 2160P
- 3 x Display Port
- Up to 4096×2160 Resolution
- 1 x DVI-D
- 1500Mhz
- VSR (Virtual Super Resolution): Supports resolutions like 1440p on monitors that can only display 1080p
- AMD LiquidVR™ Technology
- AMD Freesync™ Technology
- AMD TrueAudio Technology
- PCI-Express 3.0 Support
- Universal Video Decoder (UVD)
- Sapphire LED indicator
- AMD PowerTune
- AMD Eyefinity
- Supported API’s
- OpenGL® 4.5
- OpenCL 1.2
- DirectX® 12
- Shader Model 5.0
Product Details
- Length: 12.1in
- Width: 5in
- Depth: 1.7in
- Shipping weight: 2.8 pound
- Card weight: 2 pounds
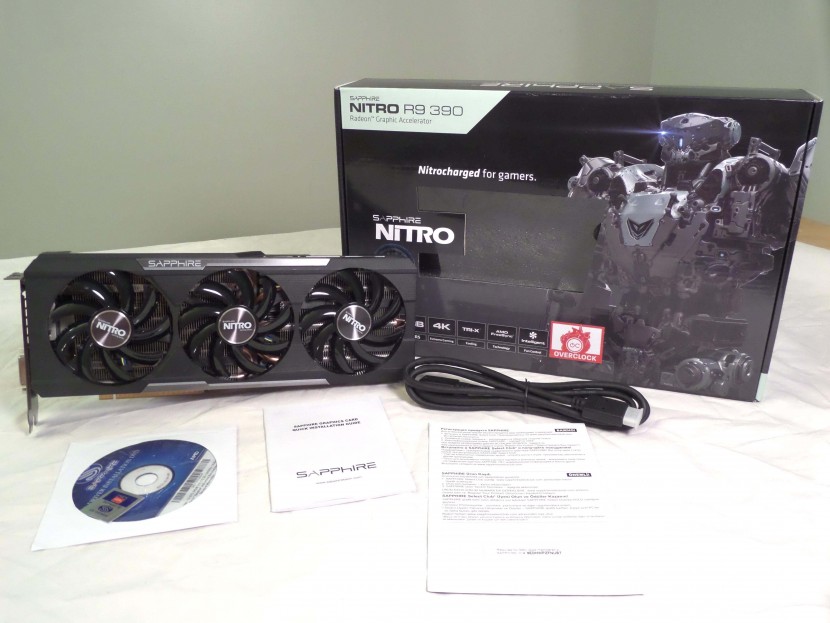
Lots of talk and no card, gets me upset too, so let’s get to the unboxing.
And let’s see all of those ports
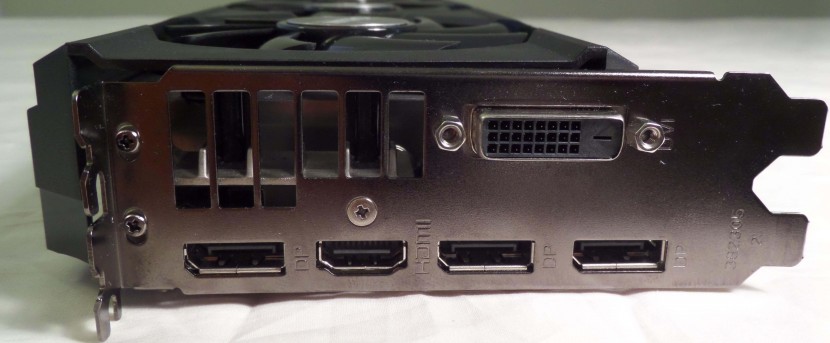
You can see here as I mentioned previously, 1 x DVI-D port, then 3 x Display Ports and 1 x HDMI, they give you everything.
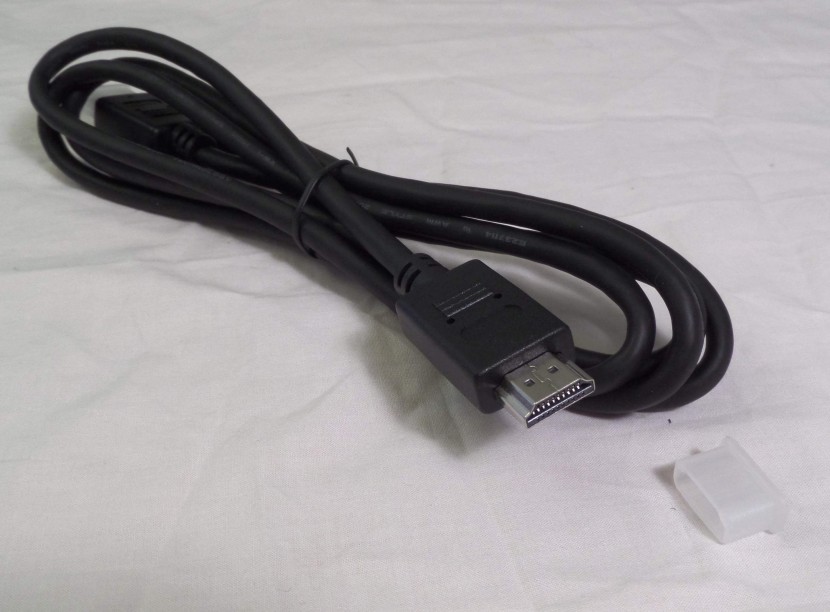
Unlike many other cards though, it does not bring any sort of converter for power or anything like that, the contents are slim, but it does bring an HDMI cable that is 5.9 feet, drivers and software and manuals.
So now I install the card to do some benches, here I show you how to install it in case you don’t know how to and even if you do, you might learn something.
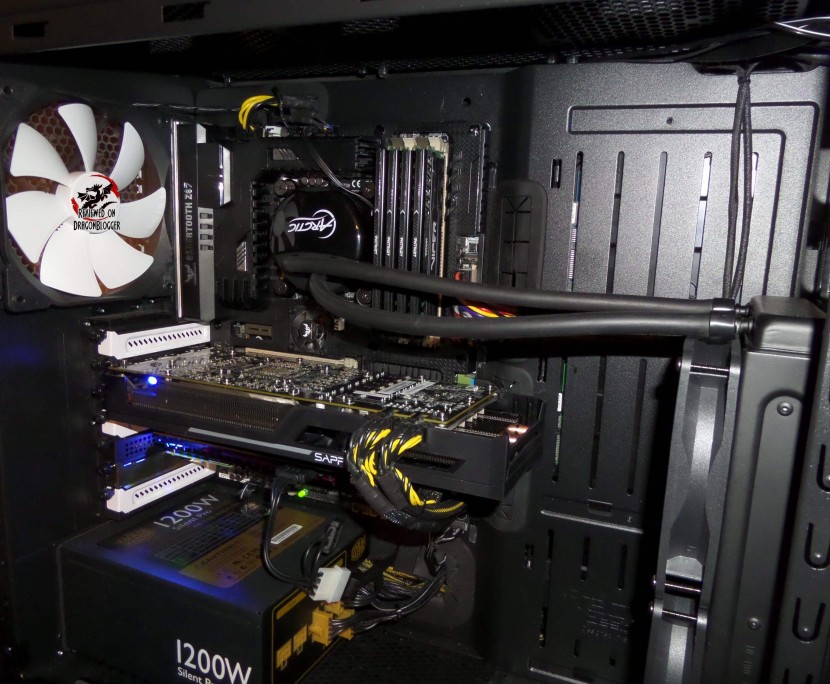
Ok, now that we have the card installed, let’s get to the benches. Below I have my full system specs for reference
- Processor: Intel Core i7 4790K
- CPU Cooling: Arctic Liquid Freezer 240 Liquid Cooling
- Motherboard: Asus Sabertooth Z87
- Memory: Patriot Viper 3 Series DDR3 16GB 1600MHz
- Power Supply: Cooler Master Silent Pro Gold 1200W
- Video Card: Sapphire Radeon NITRO R9 390 8GB GDDR5
- Hard Drive (PCI-E SSD): Plextor M6e Black Edition 128GB
- Hard Drive (SSD): Samsung 850 EVO 500GB
- Hard Drive (SSD): Patriot Ignite480GB
- Hard Drive (Mechanical): Hitachi 1TB 7200RPM
- OS: Windows 10 Professional
- Case: Fractal Design Define S Windowed
Before you get too excited, here are the system requirements, make sure you have these at least.
- 750 Watt Power Supply
- 2 x 8-Pin PCI-E Power connectors
- CD-ROM or DVD-ROM drive for installing drivers/software
- Blue-Ray™ / HD-DVD playback requires Blue-Ray / HD-DVD drive, but who has an HD-DVD drive anymore?
Ok now here is the default GPU-Z read out for this card
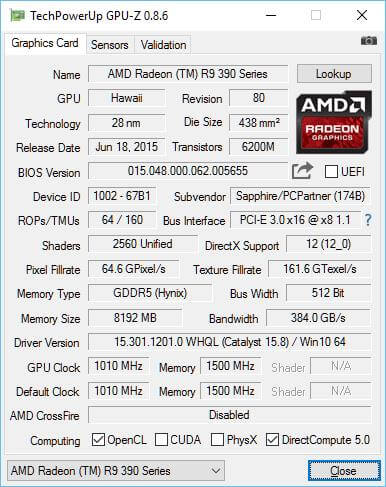
As you may or may not already know, this is a Hawaii based GPU. This of course is the updated version of the Hawaii platform, having more efficient GCN architecture, higher memory bandwidth and better power management.
One thing that you may find slightly odd is I am referencing a 1010MHz card, but if you click on any of the links in this review, you will notice that they take you to a 1040MHz card. The reason for that is Sapphire released shortly after sending me this card, the slightly faster card which is the SAME exact card I am reviewing here, but with a backplate as well with a lower price tag, so I linked this faster and more affordable card here, throwing you a bone here.
So faster speeds, better power management and a backplate should all add up to better temps right? Well, since I don’t have the card with the backplate, I can can’t say for sure, but let’s see what the card I have can do.
For this review, I am using AMD’s WHQL’ed Crimson Edition 16.1, the hotfix version.
First off is 3DMark’s Firestrike, mind you not a game, but it is the staple of GPU testing just to get an idea of how this card holds up. For games, I will be testing Metro Last Light, Tomb Raider and Thief. I will also be giving you some gameplay videos of Grand Theft Auto V and Battlefield 4.
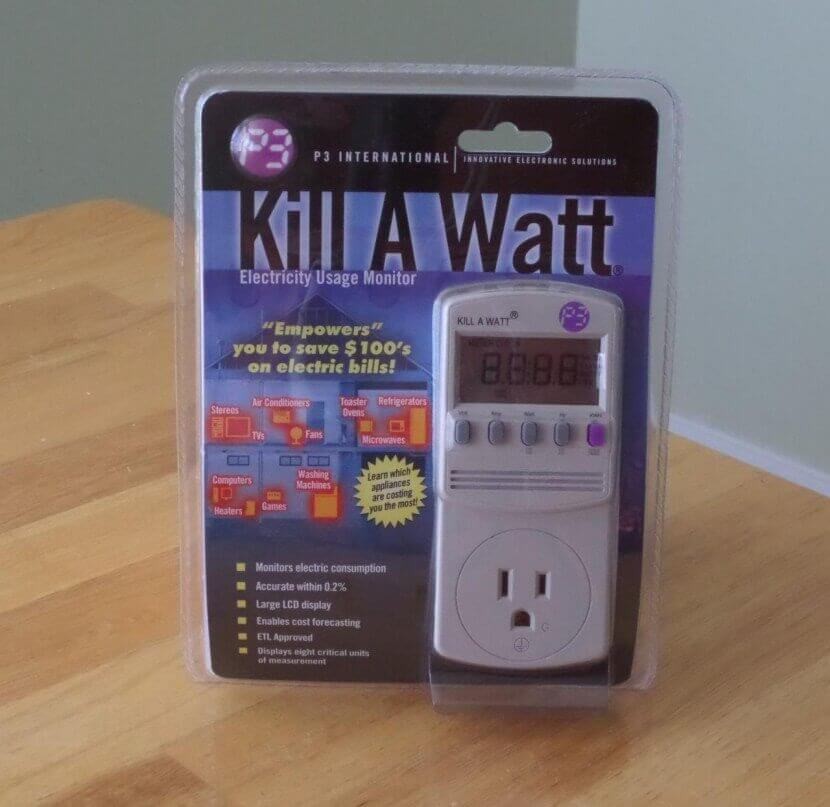
Before I start, I wanted to mention that I test wattage consumption during the benchmarks to help you understand what kind of power you might need. To test the wattage, I use a “Kill A Watt” by “P3 International”.
Ok, ok, let’s get to the benches.
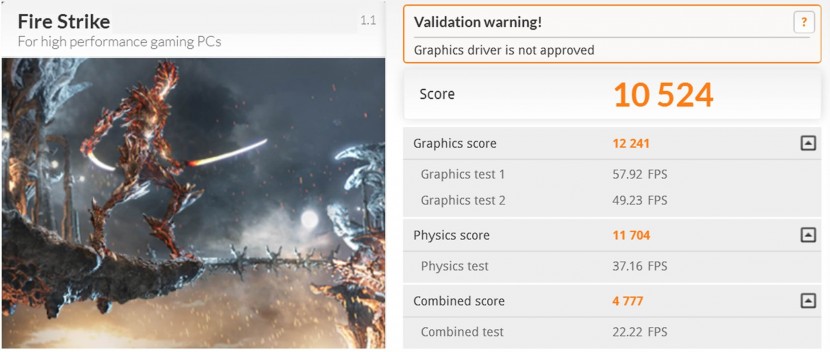
Not a bad score at all, you can see that it performs 86% better than all other results.
If you will notice the maximum wattage reached during this benchmark was 387 Watts and the average wattage consume was 220 Watts. The Tri-X fan system Sapphire has implemented kept this card at a very tolerable 61°C. AMD has been known in the past to get real hot, that has not been the case for some time, but let’s not trust the hearsay, check it out here not only in 3DMark, but in the results in the rest of the review.
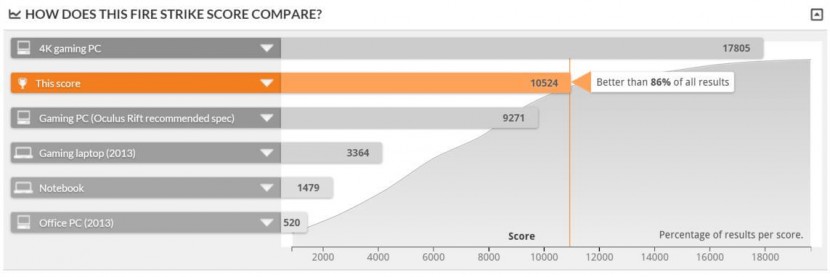
A bit odd though that even though this driver is approved by Microsoft, since it is WHQL certified Futuremark does not approve it. That’s not a bad thing, but something to note. Futuremark will not approve “hotfix” drivers unless specifically requested by the graphics card vendor, in this case AMD and you have to pay Microsoft to WHQL anything.
OK, enough with the small talk, let’s get on to some Metro Last Light.
Here are my Metro Last Light presets
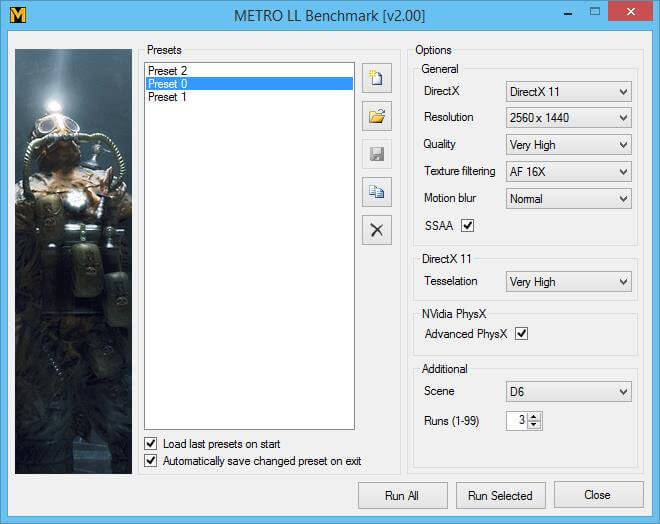
The only different between the presets was resolution, 2560 x 1440, 1920 x 1080 and 1280 x 1024, the rest was the same and I will show you all 3 below.
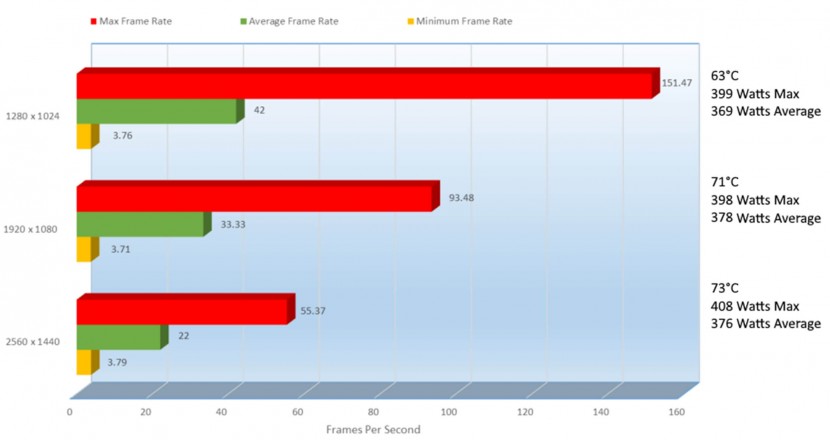
No matter how powerful your system is, Metro Last Light is known to torture the best of the best and it seems like that holds true here as well. Even at the lowest resolution benches, the card struggles please note that I have EVERYTHING turned up.
Let’s see if THIEF can steal the benches or if it just leaves them behind

Like in Metro Last Light, THIEF, Tomb Raider, Battlefield 4 and GTA V will have all the benching and gameplay alike, changing only the resolution.
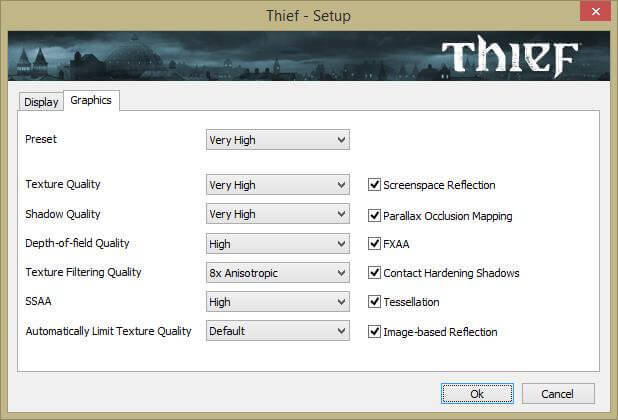
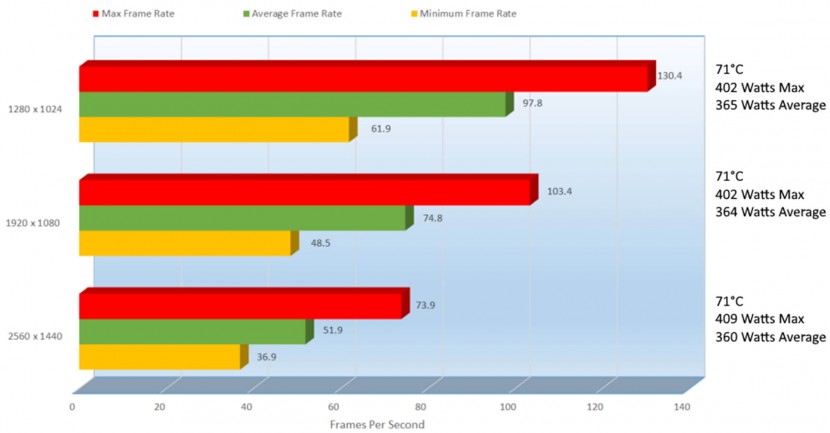
It looks like THIEF took this away, the scores are amazing. At 2560 x 1440 the average frames per second were 51.9 and the highest were 73.9, very playable even at the lower 36.9 and it was very rare that it hit that 36.9 but it was the lowest.
So let’s move on to Tomb Raider left all alone on an island, poor Laura.

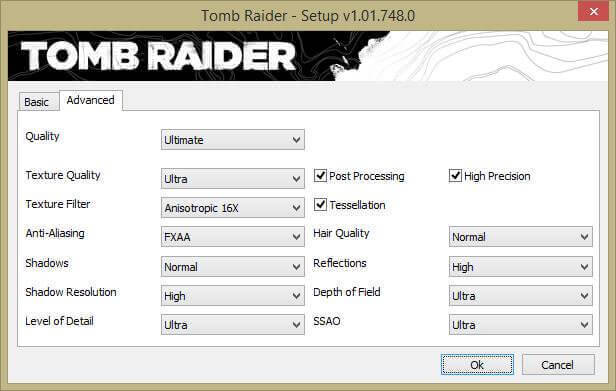
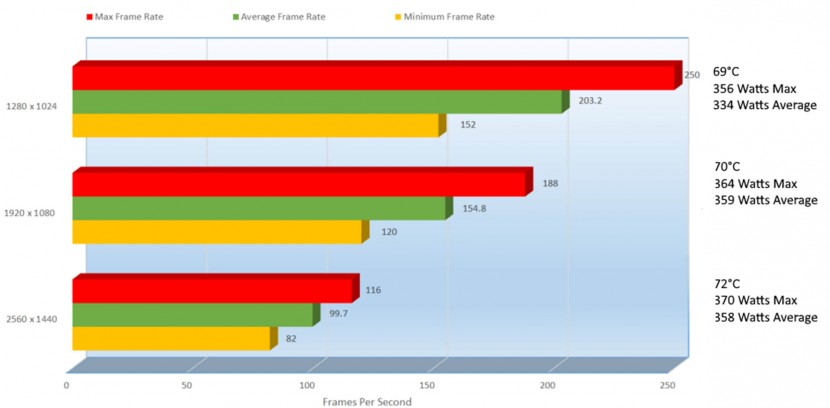
The 390 seems to rock all of these benches, some more than others of course but Tomb Raider fared very well. You will notice though I did not select TressFX for the hair so that when I test NVIDIA cards, to keep everything fair but she was just as stunning as ever, even with her hair flowing through her shoulders.
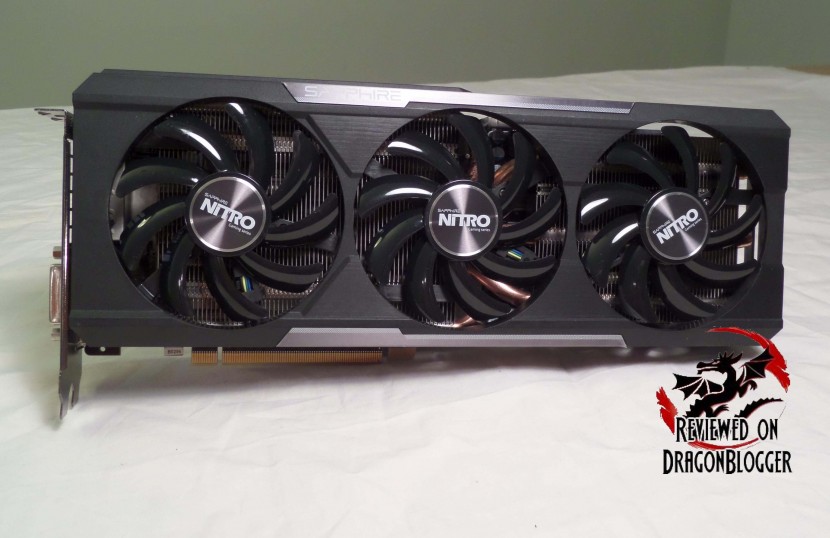
The highest I tested was at 2560 x 1440 even though my monitor can handle 3840 x 2160 but it only plays at 30Hz at that resolution, the Asus PB287Q, a very nice monitor for 2560 x 1440, but I think the 3840 x 2160 was an afterthought.
Alright, so usually at this point, I would cut over to an overclock performance test, but it seem that AMD has gotten rid of their AMD Overdrive, at least for GPU’s so I did a little search on Sapphire’s site and found the Sapphire TRIXX OC Utility, but we all know that TRIXX are for kids, sorry I had to.
So the TRIXX OC Utility, just like AMD Overdrive allows you to adjust the fan speeds, core voltages, power limits, GPU clock, memory clock and when all is said and done, you can even save the current VGA BIOS.
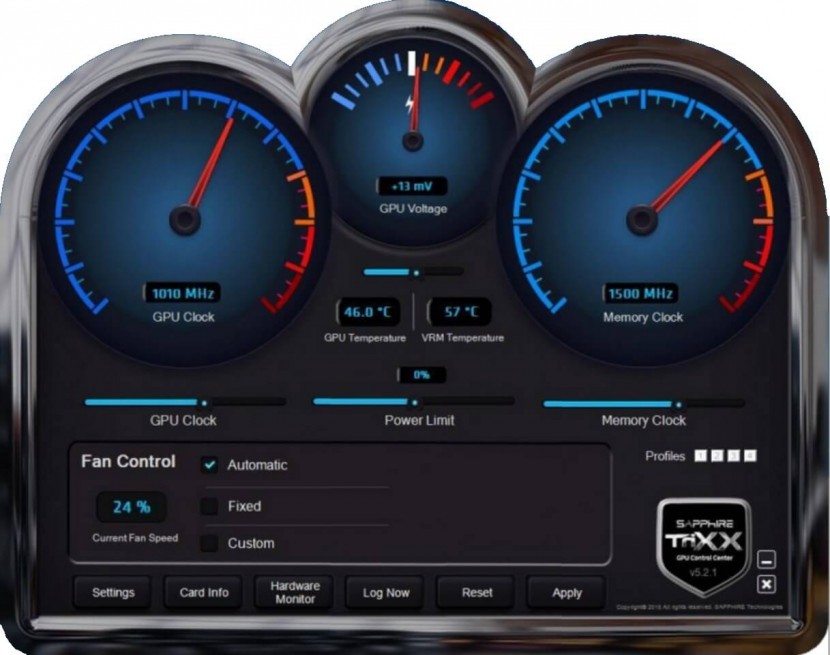
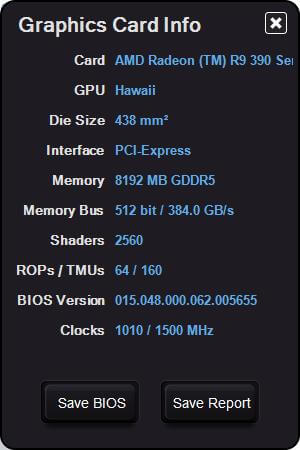
Built in it has the ability to see the cards information, GPU, Die Size, Interface, etc…
Then it also lets you run a hardware monitor of sorts, so that you can see you Core and memory clocks, GPU temperature, speed the fans are running at, GPU and more.
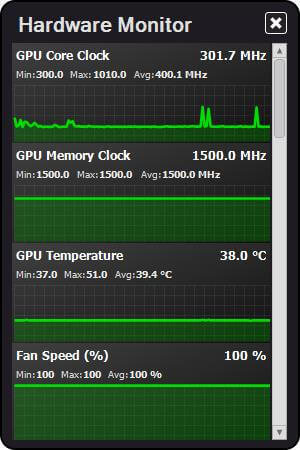
OK, so what kind of overclock did I give it, well check out the TRIXX settings.
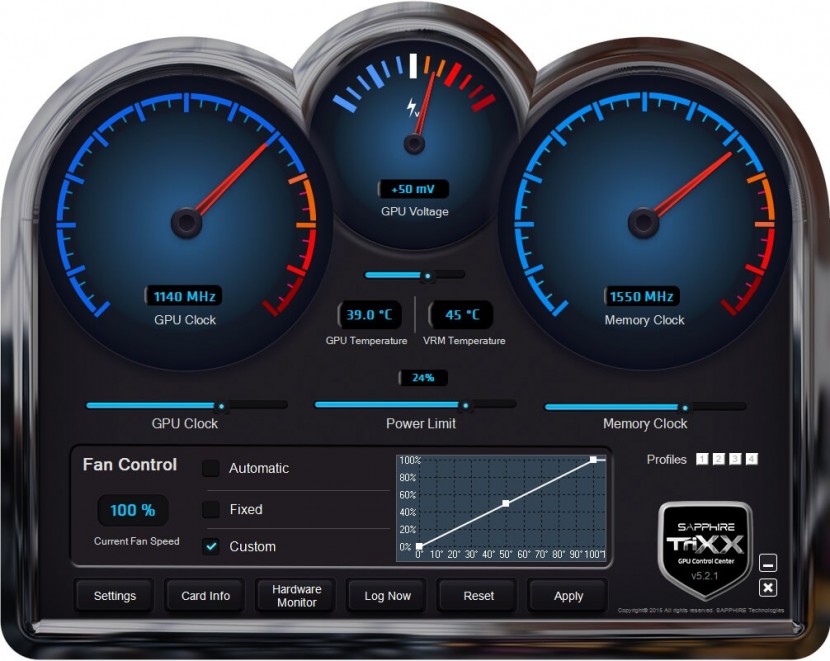
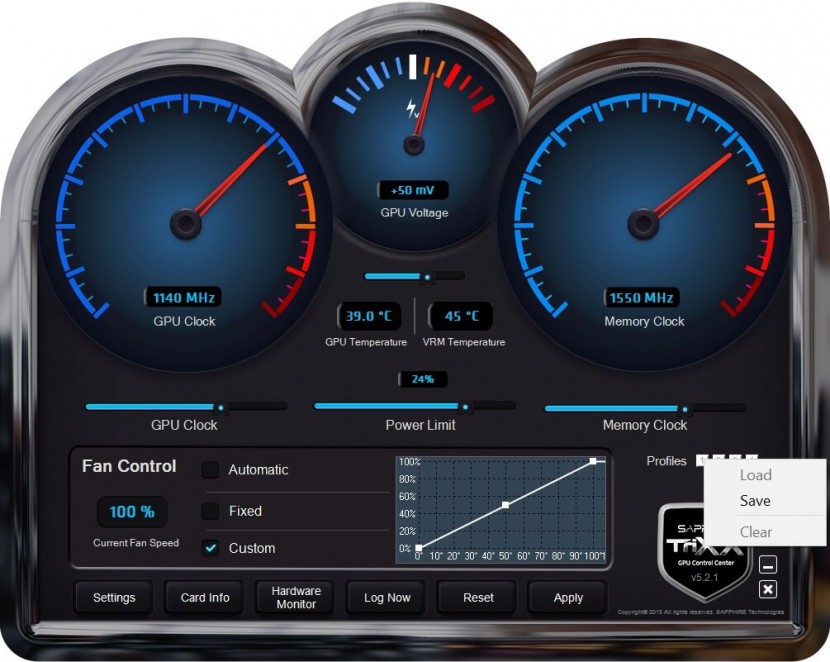
The software allows you to create a custom profile for the fans as well and save them under 4 profiles buttons. In the picture above, I show you the overclock, as well as the fan profile and 1 of the 4 Profiles you can Save and Load from. I show you below that you can click on the 1 ~4 profile buttons to either “Load”, “Save” or “Clear” the profile. If you uninstall this program and maybe reinstall later, you will lose your saved profiles, so if you like your overclock and want to use it later, aside from saving the profile, take a screen shot of it too.
Here is how the overclock looks like in GPU-Z
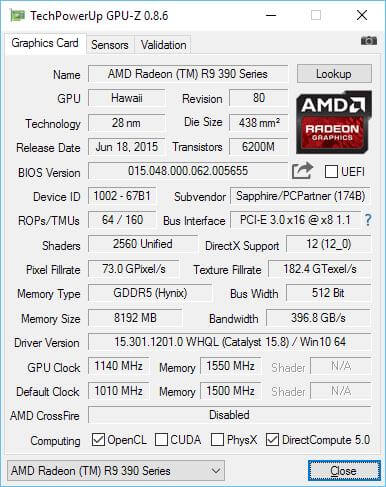
A decent little overclock, took me a bit but I didn’t want to spend too much time on it. GPU-Z reports the differences here

But to see the bigger picture, I will put both next to each other
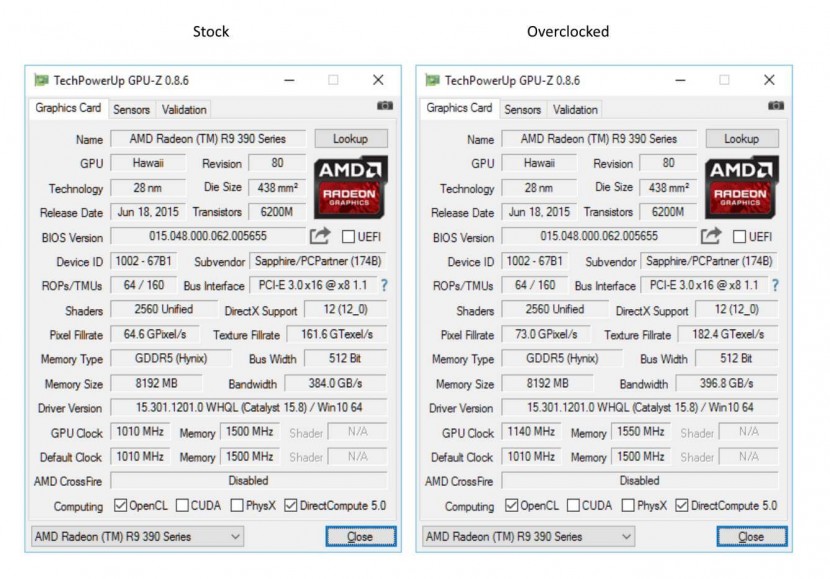
So you can see here, overclocking as I have increased the GPU Clock and Memory of course, but it also increased the Pixel Fillrate, Texture Fillrate and memory bandwidth, very cool but what does that mean for performance, well let’s find out.
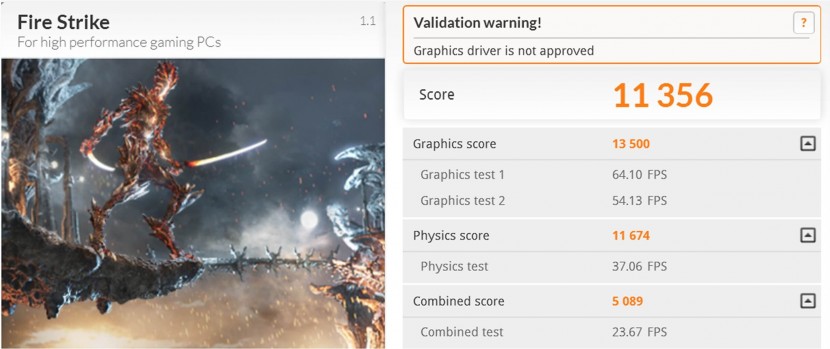
Due to the overlcock we receive a 7.91% improvement in the overall 3DMark Firestrike score. Breaking it down a bit more, we received a 10.67% improvement in Graphics test 1, 9.95% improvement in Graphics test 2 and a decrease in the Physics test by .432, not huge but worth mentioning. The on the combined score we received a 6.53% improvement.
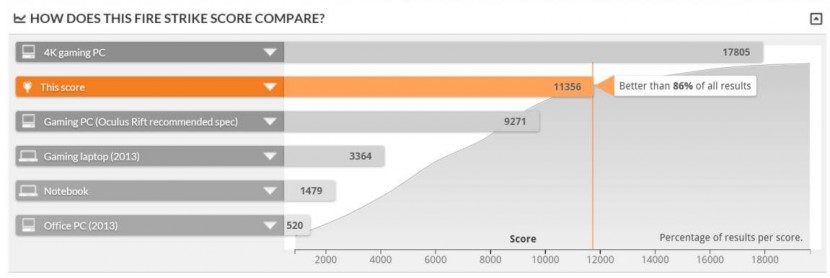
Although the performance did go up, it still could not pass it being 86% better than all other result’s. I guess the competition is fierce though the problem with this is that it rates stock and overclocks in the same category. I think maybe overclocks made in general should go into their own category, what do you think?
1280 x 1024
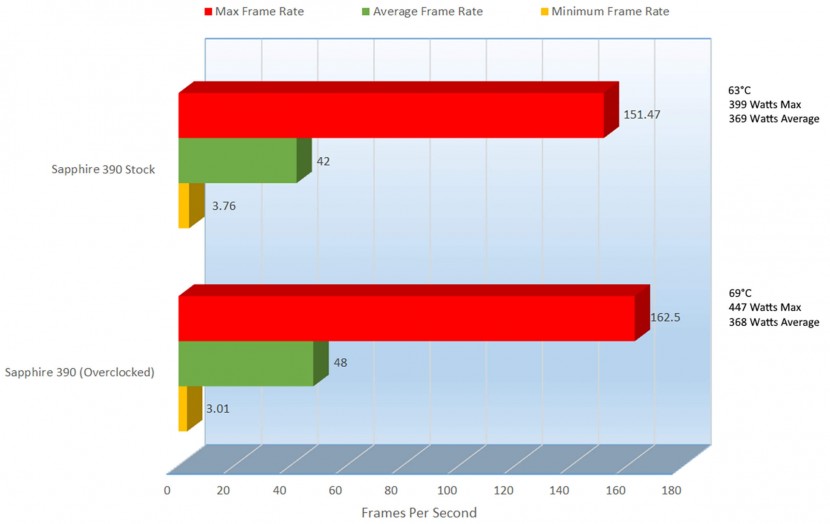
Not a huge improvement, but it was an improvement overall across the board. Only averaging the Average results, we got a 14.29% improvement and with that only a 6° difference. The wattage shot up on this overclock though 12.03% on max though dropped oddly enough on average 0.3%.
1920 x 1080
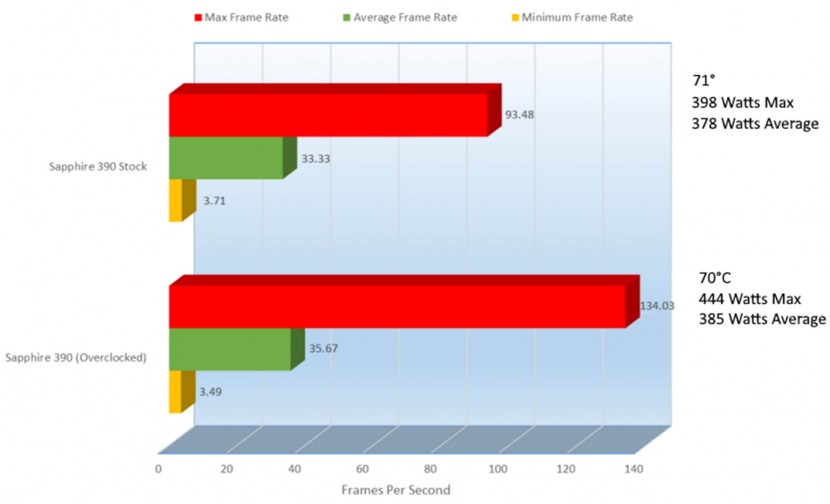
The improvement here was not as high as before on the average only a 7.02% improvement, though the max frame rate went up 43.38%, but you can’t count on the Max. The wattage again shot up 11.57% though only went up slightly on average by 1.85%.
2560 x 1440
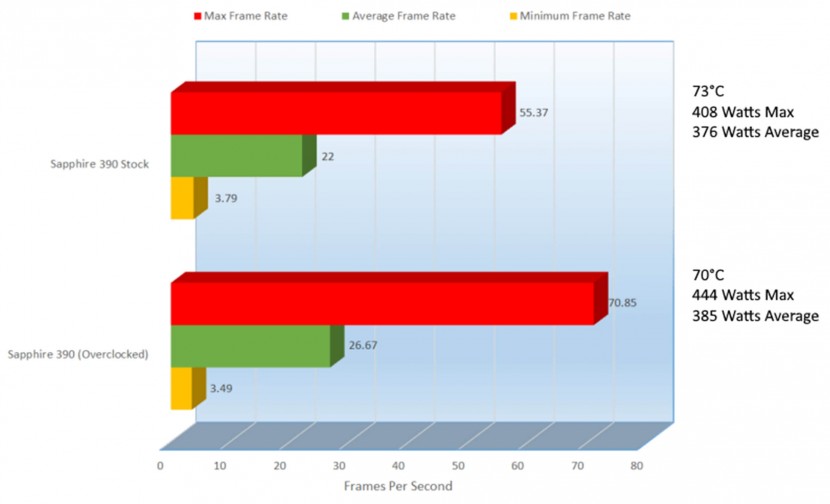
Thankfully, it just keeps getting better. The improvement here is 21.23%, a decent improvement here on average and 28.82% under max.
As silently as THIEF’s left us at the last bench run, it is back. Let’s see how THIEF fared in the OC biz.
1280 x 1024
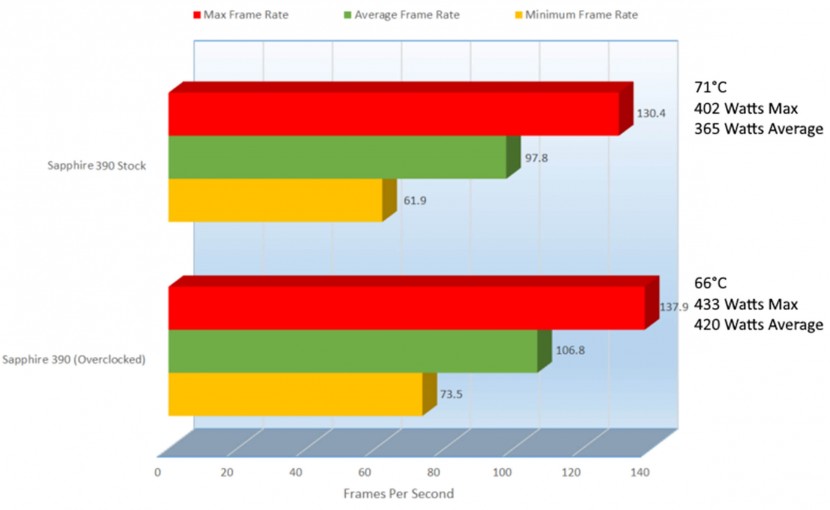
It looks like the default fan speeds on this one might have not been as good as the overclocked profile fan settings I placed on here. The wattage increased both in average by 15.07% and max by 7.71%, but hey we are getting an edge right? The performance on average went up by 9.20%.
1920 x 1080
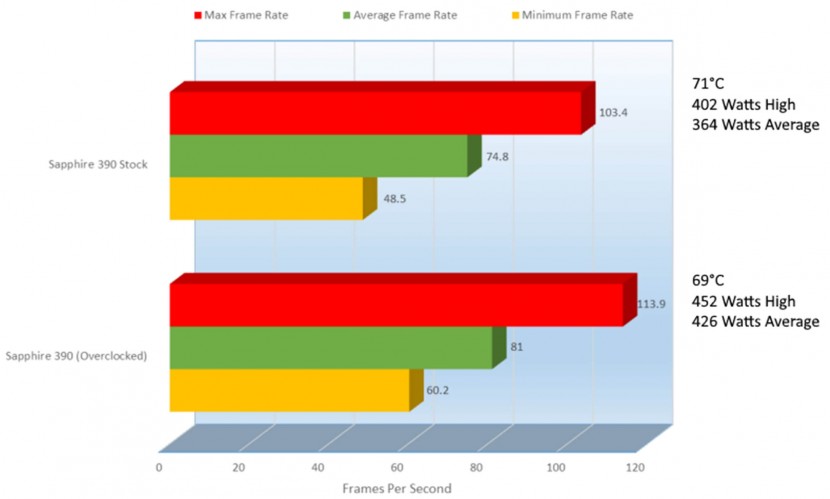
From stock to the overclock we have an 8.29% improvement and a relatively high wattage increase of 17.03%. The performance is getting great here and with that improvement in performance and there is an improvement in temperatures as well, its cooled 2.90% over the stock fan speeds.
2560 x 1440
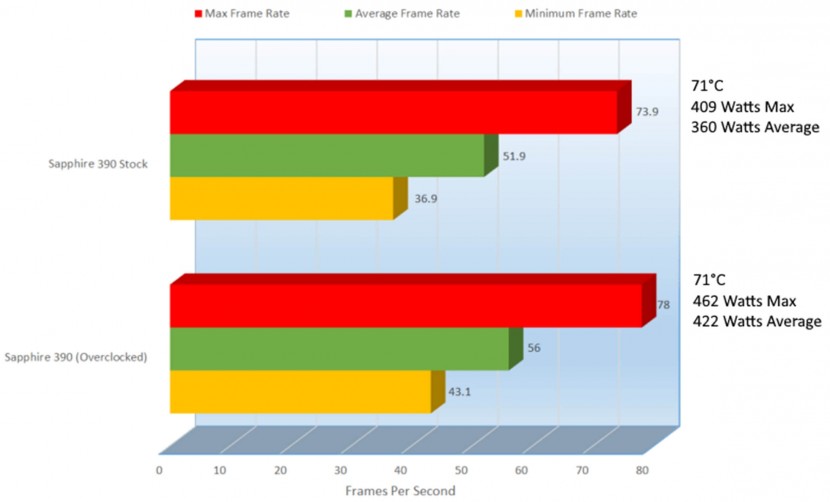
The average wattage has gone up here by 17.22% but with that improvement the performance of the card has improved as well. The average has improved by 7.90% but notice that the heat has not gone up or down, the cooling on these cards is nice.
Always saving the best for last, Laura comes in to solve a mystery for us, is the additional overclock over the already overclocked card worth it?
1280 x 1024
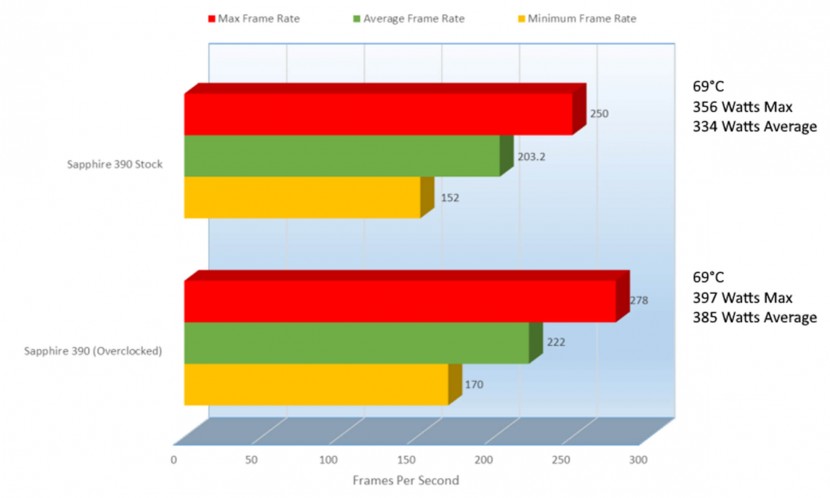
Performance on this one was already good to begin with but it just keeps getting better. On the average the performance went up by 9.25% though the wattage did go up by 15.27% though the temperature kept steady at 69°C.
1920 x 1080
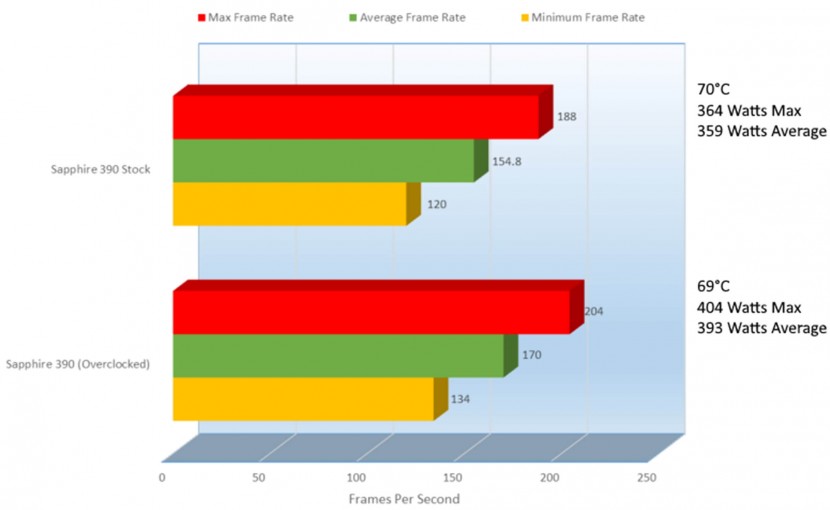
On average we see a 9.82% improvement and with it a dip in temperature by 1°. Even though the wattage went up by 9.47% the temperature went down, but again it was in the increase in the fan performance.
2560 x 1440
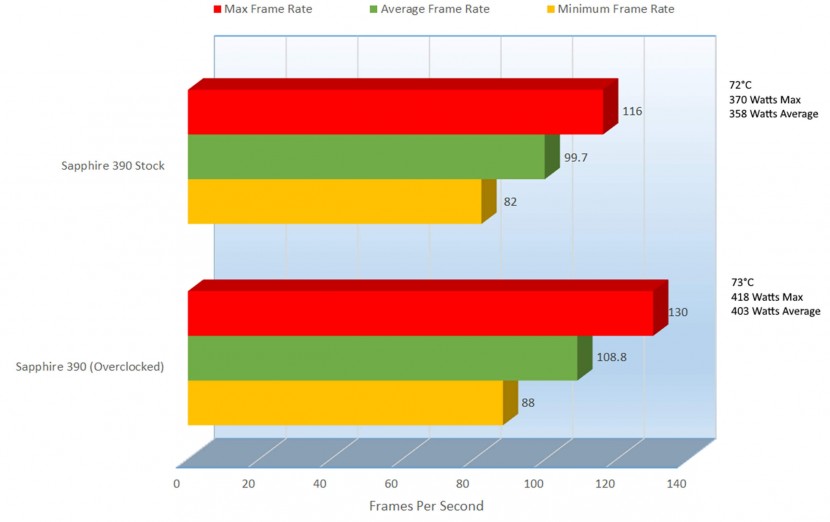
Even at 2560 x 1440 we see a nice improvement in the average FPS at 9.13% only 1°C warmer but we do see a rather large bump in wattage. From stock to our overclock we can see an 8.92% increase in power consumption.
Again, these are just benches, let’s see what it looks like within games.
How does it play my favorite Battlefield 4.
Nice, with everything turned up, we are seeing frames per second in the 90’s, though usually in the upper 60’s and 70’s, so I am very impressed.
Next up is Grand Theft Auto 5, some might prefer GTAV, but anyway, let’s check out the game play.
This one was a little lower, though still running at max, we saw frame rate anywhere from the upper 40’s to the upper 150’s, I would say it hovered around the 40’s. Unlike many games though, this game runs great in the 40’s very smooth.
Previously I ran AMD’s Rptr video recording software with not the greatest results, the video was very choppy in it and had to run the games in Borderless mode, no one plays it at Borderless; we play it in Full screen. I then ran Techsmith’s Camtasia Studio 8’s recorder, which capture video great, but takes up more memory than typical screen recording software, and I wanted to make sure I had more resources for the game Bandicam, a game recording software which is very affordable, it also displays frames per second, like you saw in the videos. Check it out here
Though I used Techsmith’s Camtasia Studio 8 to edit all my videos, it’s amazing for editing and rendered very nice and quickly these videos, I edited them all on the Sapphire Radeon NITRO R9 390 8GB GDDR5 Tri-X OC without an issue.
But anyway, back to the review. So just above the videos, you saw I compared stock versus overclocked speeds, but let’s see how a 390 and a 390X compare against each other. I will be comparing the speeds, temperatures and wattage differences between the