
We are influencers and brand affiliates. This post contains affiliate links, most which go to Amazon and are Geo-Affiliate links to nearest Amazon store.
Every computer, even an Apple Mac has a video card, be it AMD, NVIDIA, Intel, Matrox, and so on. The image you are seeing at this very moment on your monitor is courtesy of a video card. Different video card chipsets and manufacturers create all sorts of flavors of video cards, from integrated, on-die or dedicated, you can thank your video card for all you see on the screen. With that introduction, I have the pleasure of bringing you my review of the EVGA GeForce GTX 1080 TI Founders Edition.
Also, make sure to read to the end, I mention how I got this card.
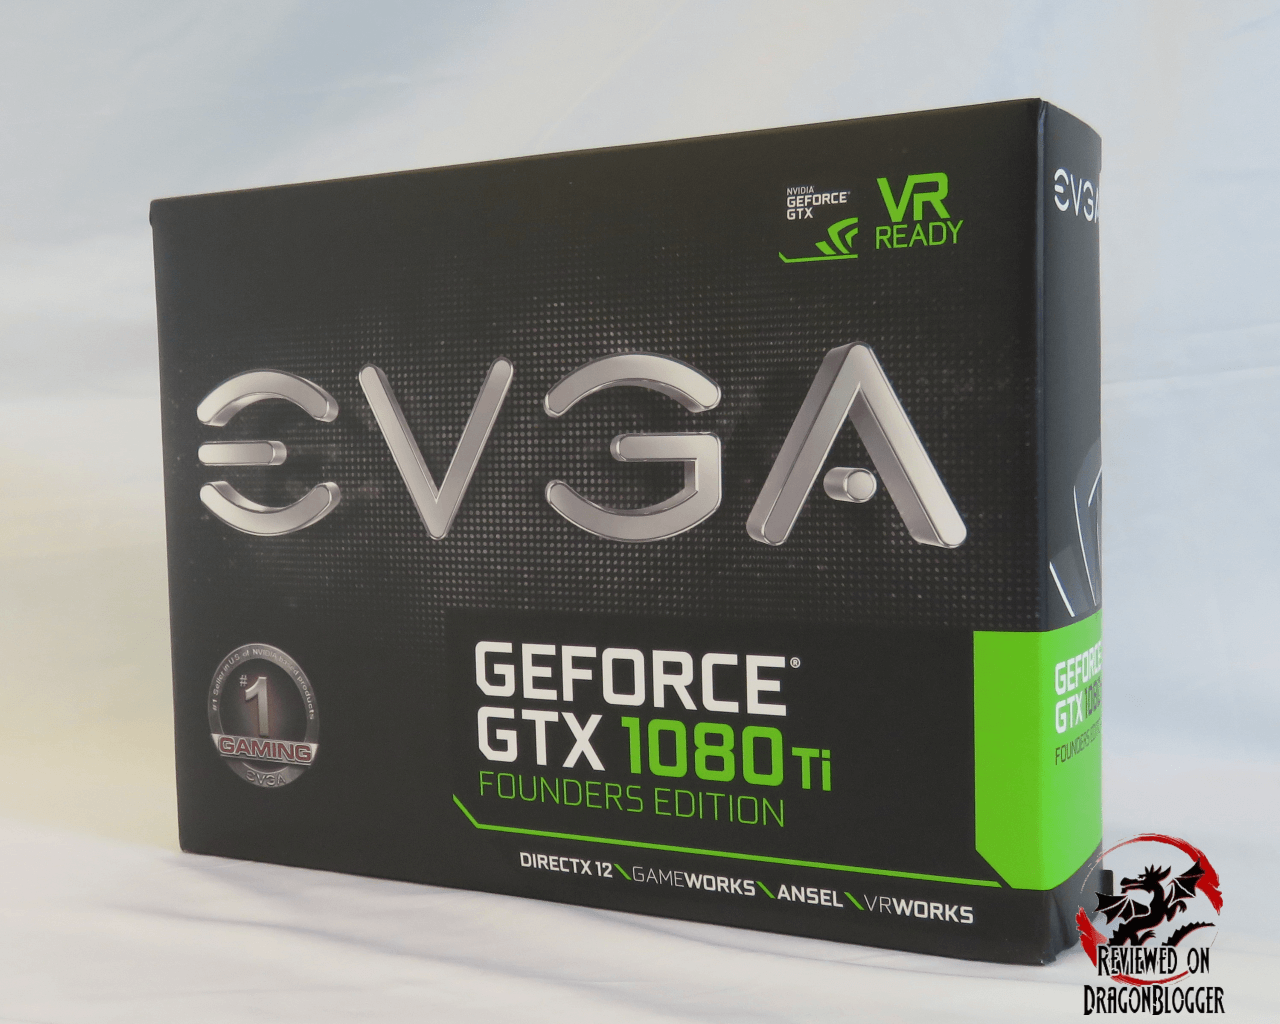
I know, it’s just the box and before we can get inside, I must let you know the specs of this bad boy.
Specs and Features
- 1,480Mhz Base Close
- 1582 Mhz Boost Clock
- 5GT/s Texture Fill Rate
- 3584 Pixel Pipelines / CUDA Cores
- 11,264MB 352Biut GDDR5X
- 11,016Mhz Effective
- 2,754Mhz Memory
- 484GB/s Memory Bandwidth
- 11,016Mhz Effective
- NVIDIA SLI Ready
- HB Bridge Support
- Support 4 Simultaneous Monitors
- 3 x DisplayPort 1.4 @ 7680×4320 at 60Hz
- DVI via DisplayPort to Single-Link DVI-D Adapter at 60Hz
- HDMI 2.0b
- 240Hz Max Refresh Rate
- 3 x DisplayPort 1.4 @ 7680×4320 at 60Hz
- EVGA ACX 3.0 Cooling
- 7+1 Phase Power Design
- Simultaneous Multi-Projection
- VR Ready
- NVIDIA Surround
- NVIDIA GPU Boost 3.0
- NVIDIA G-Sync Ready
- NVIDIA Ansel
- NVIDIA GameStream
- Supported API’s
- DirectX 12
- OpenGL 4.5
- Vulkan
- Green LED
Product Dimensions
- Length: 10.6in / 269.2mm
- Height: 4.376in / 111.15mm
- Width: Dual Slot
OK, now that I have teased you enough, let’s check out the unboxing
While the Pascal architecture is not new, the card is and it’s looking nice isn’t it?
Let’s go over everything that came in the box.
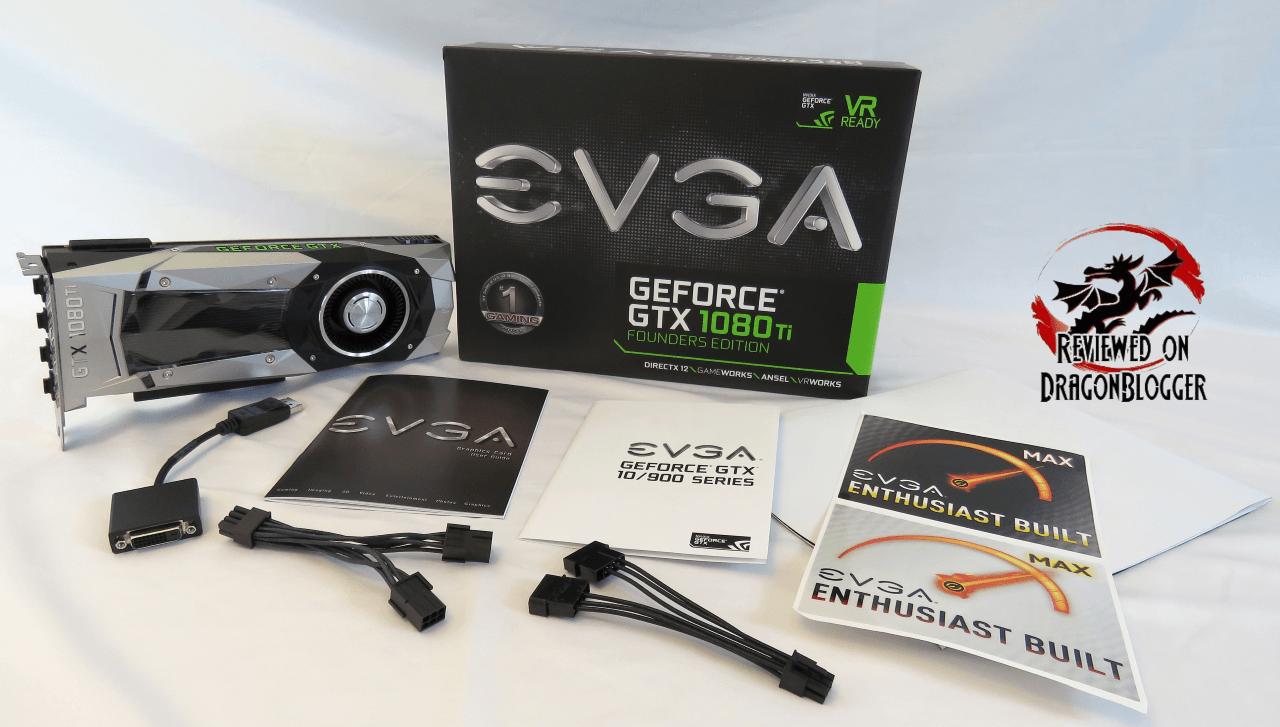
EVGA includes quite a few things in this package, I will go over each item included.
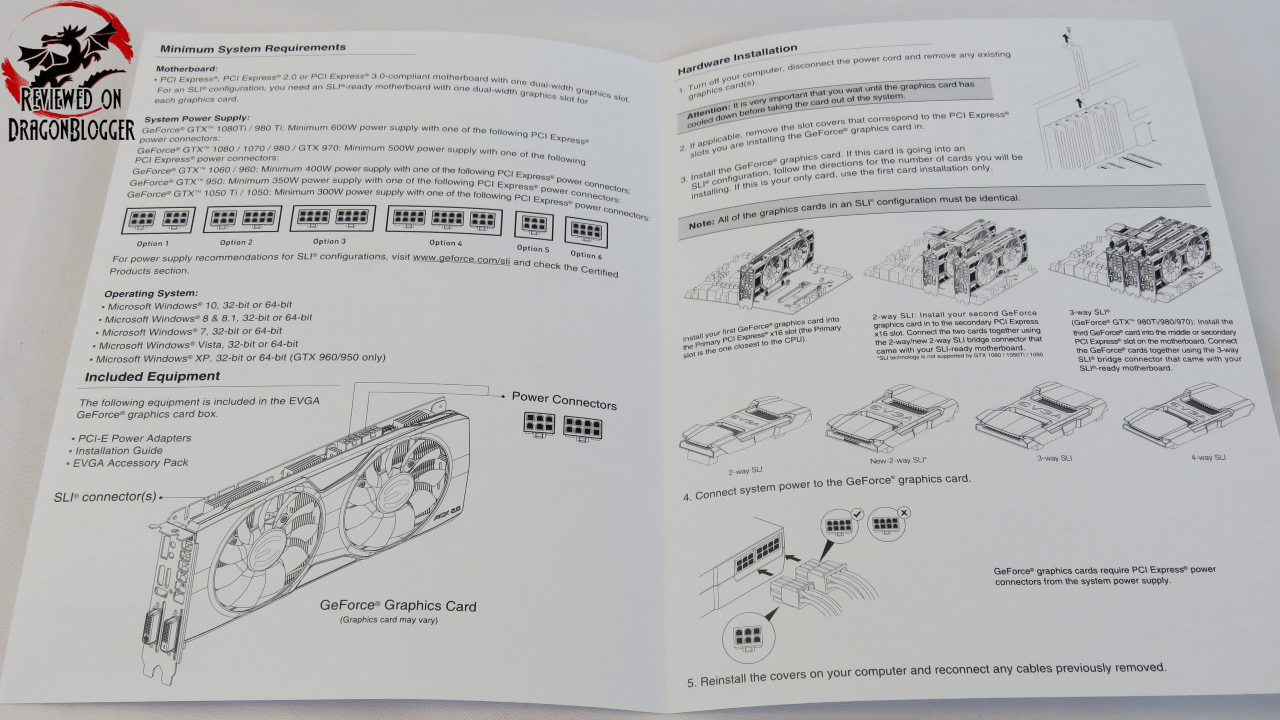
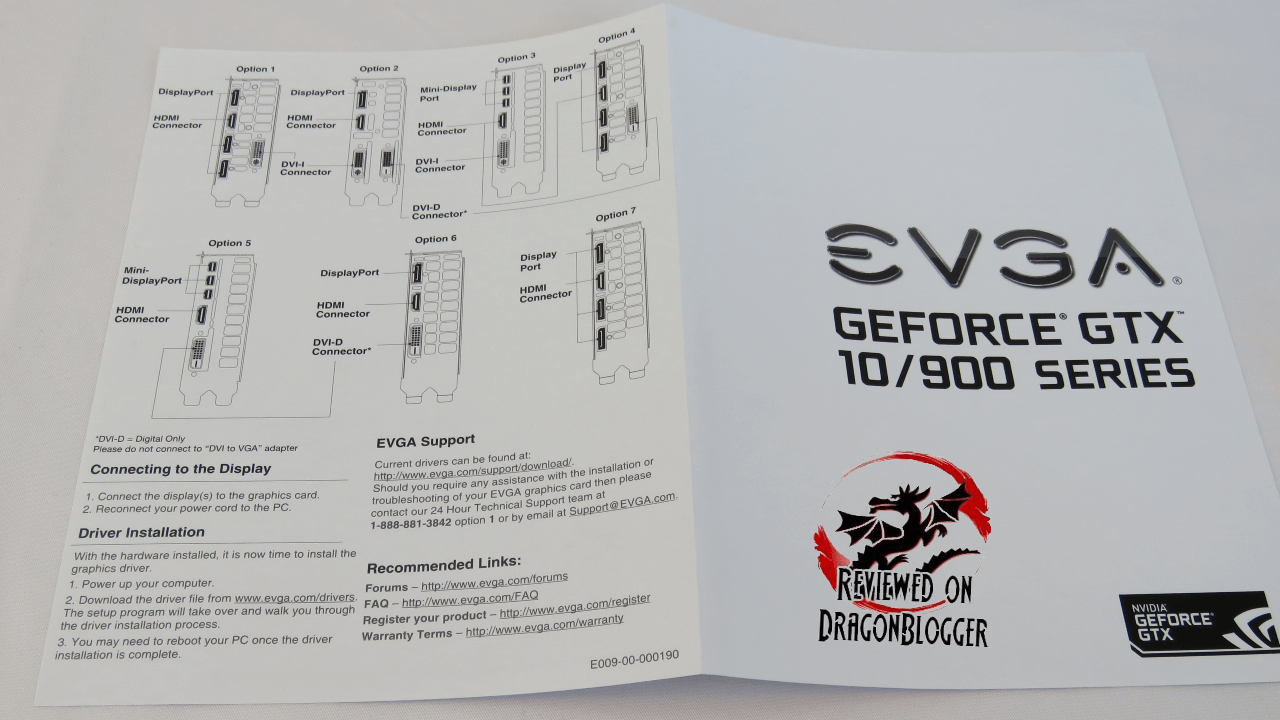
This users guide covers basics of the 10** and 900 series of cards. It covers the Minimum System Requirements, Included Equipment and then goes over basics on installing the card connecting the display, driver installation, EVGA Support and provides a few recommended links.
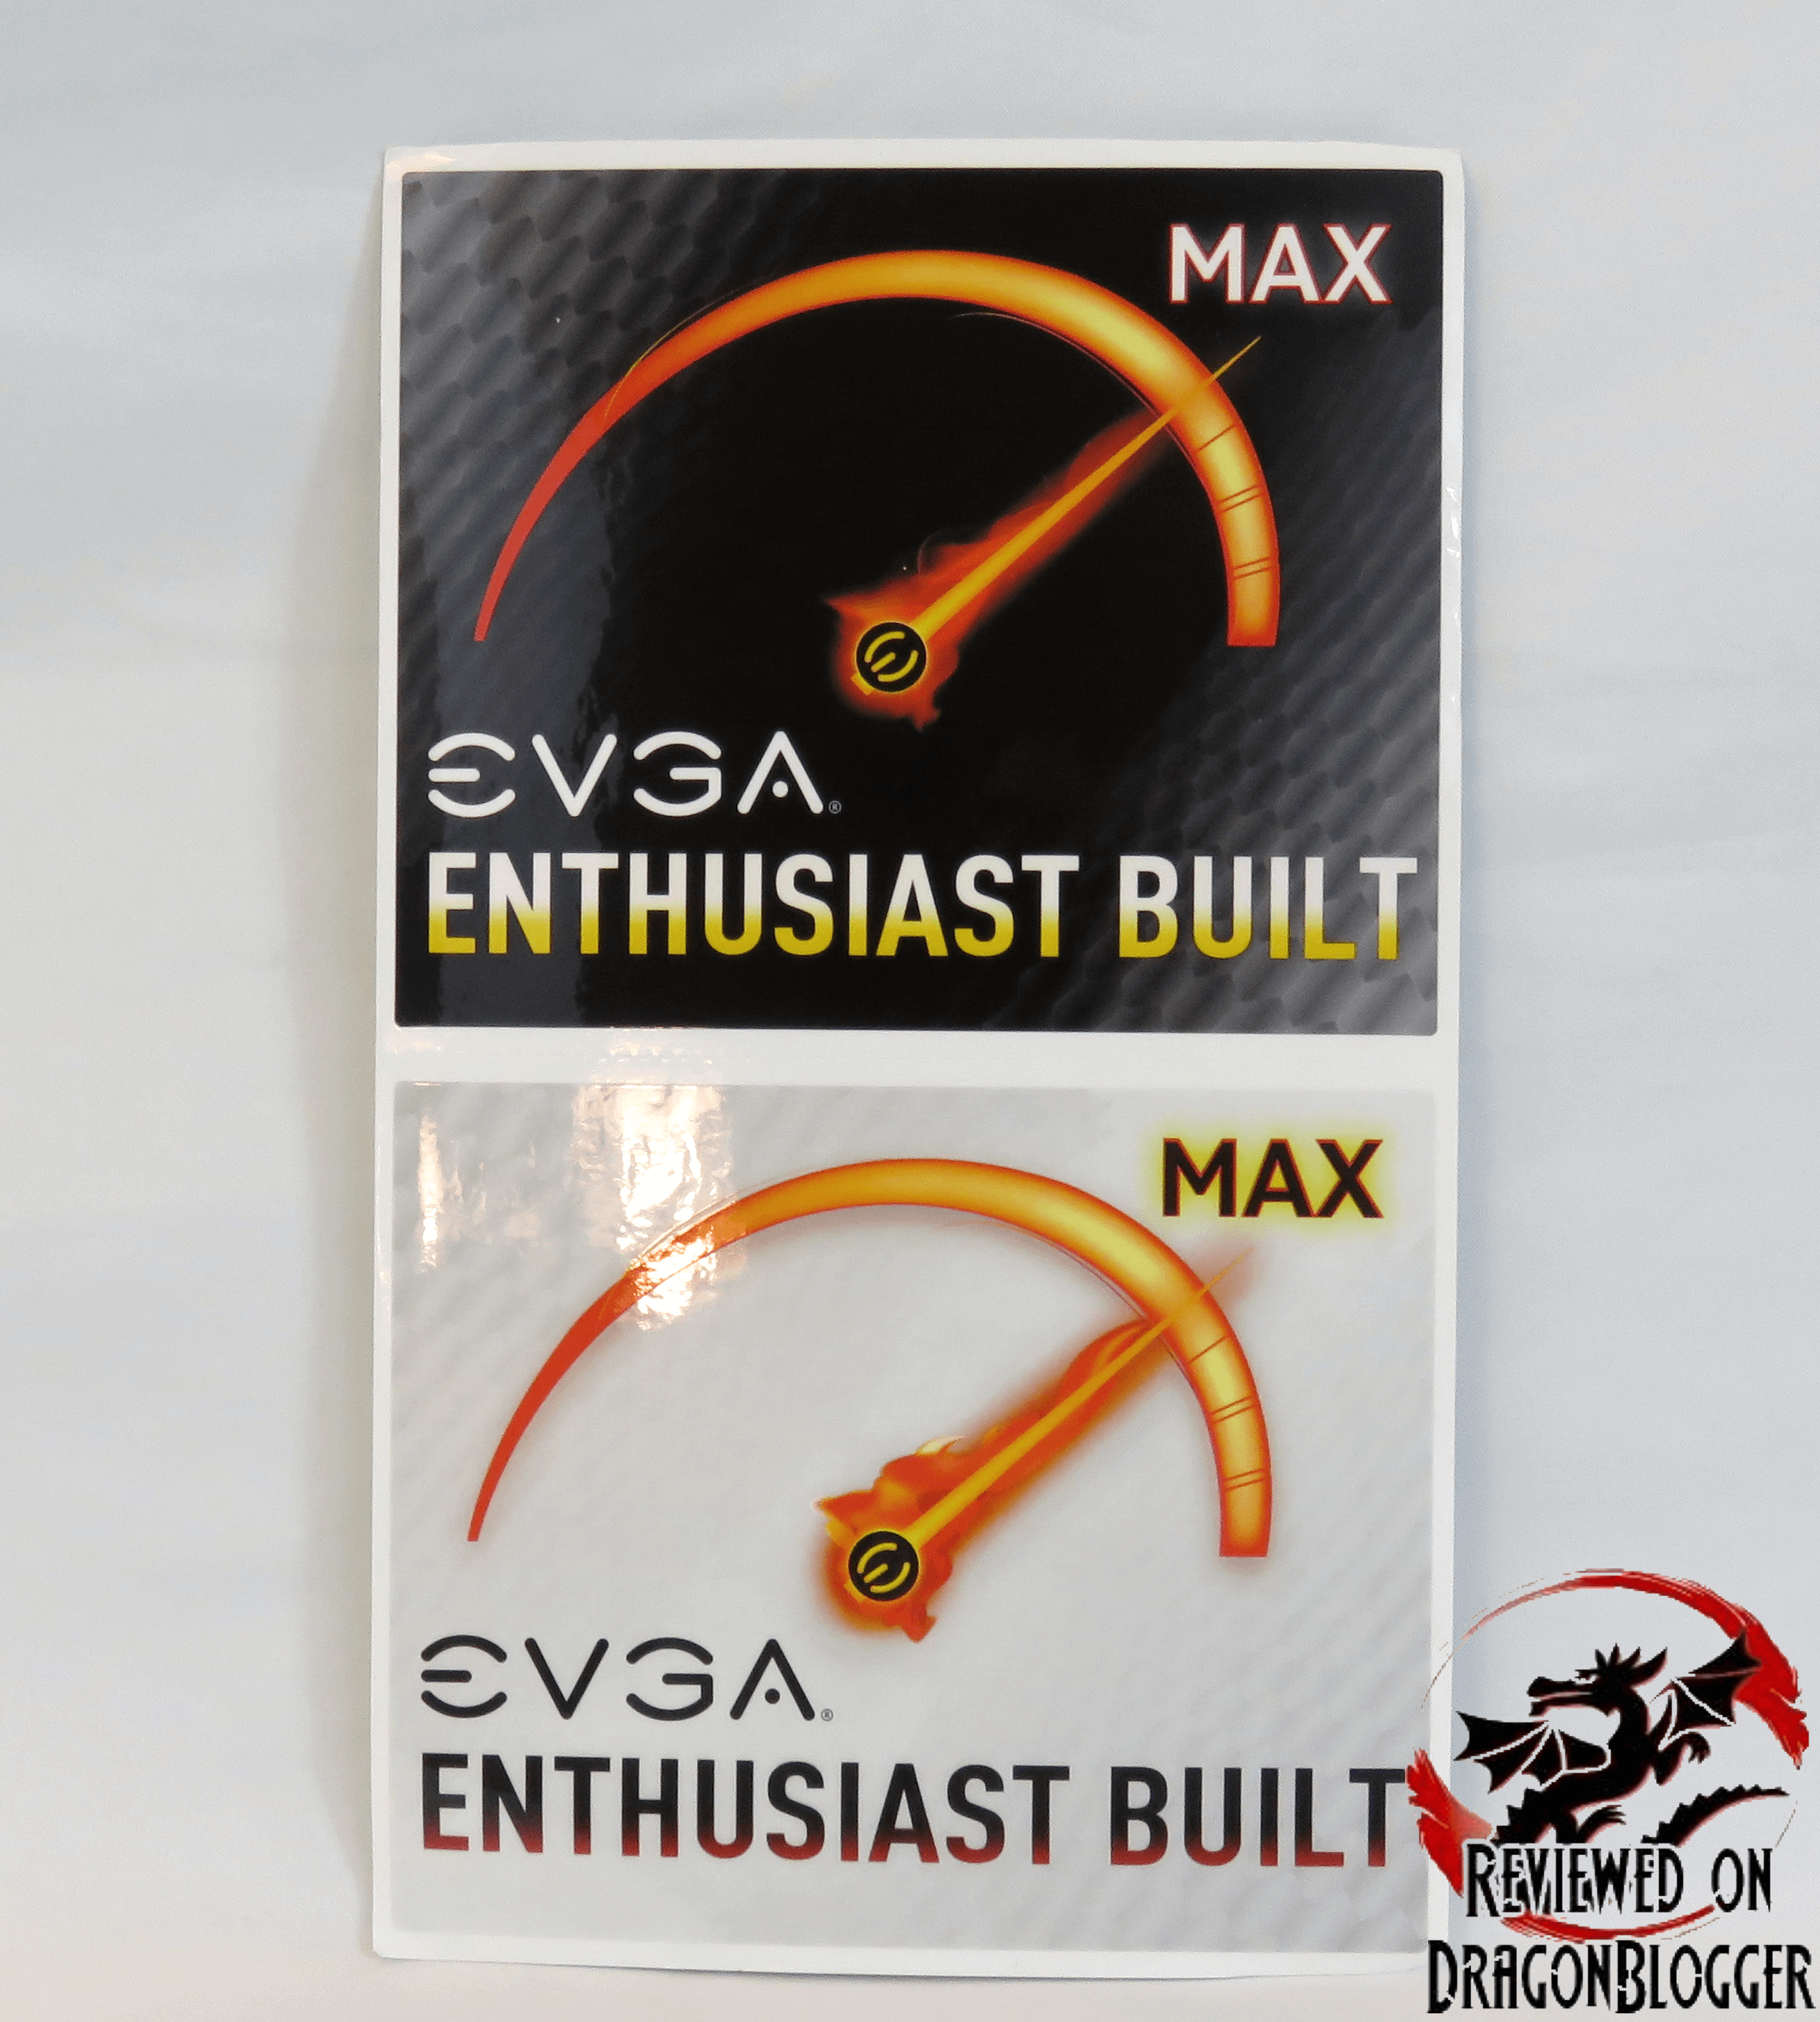
They also include 2 x Enthusiast Built sticks, one in Black and one in White.
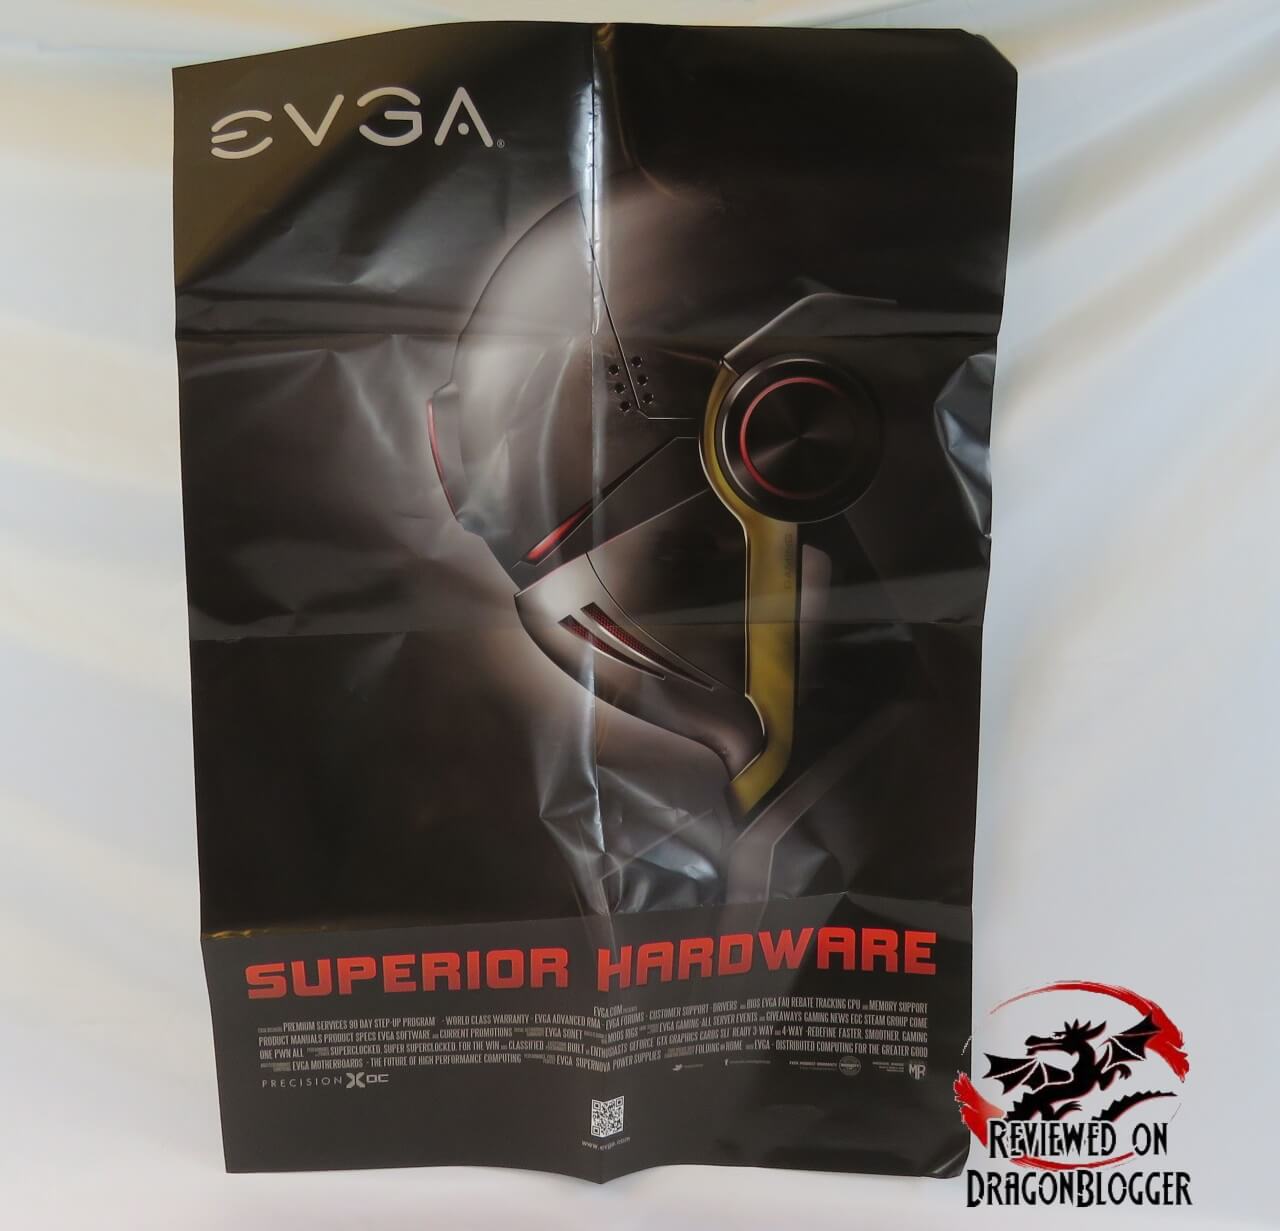
They also include a poster
Aside from the schwag, they also include a few adapters to help you on your journey.
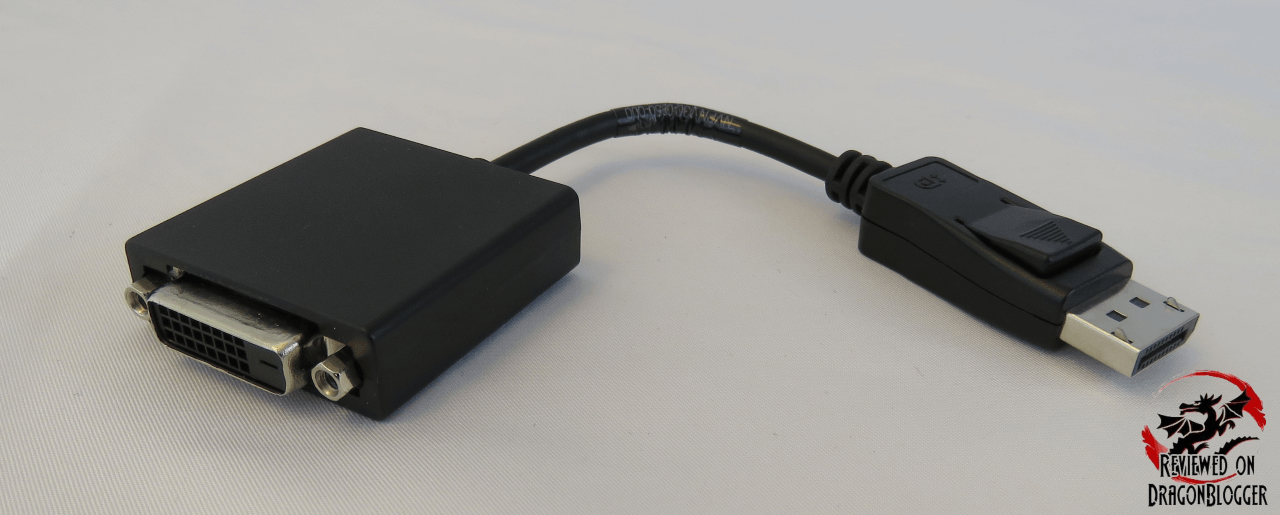
They include on Display port to Single Link DVI-D Adapter.
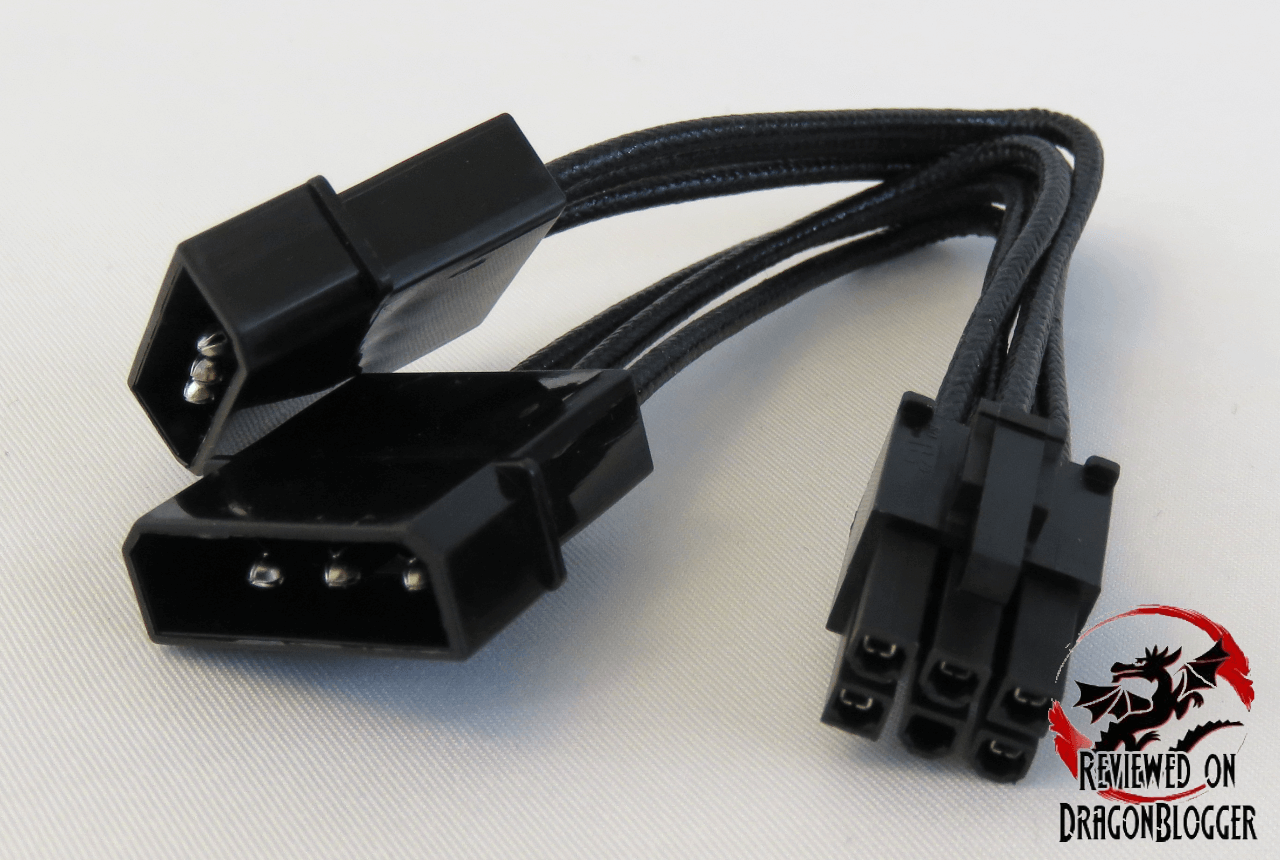
For those of you that might be missing some PCI-e power connections, they include a 2 x Molex to 6Pin PCI-e adapter.
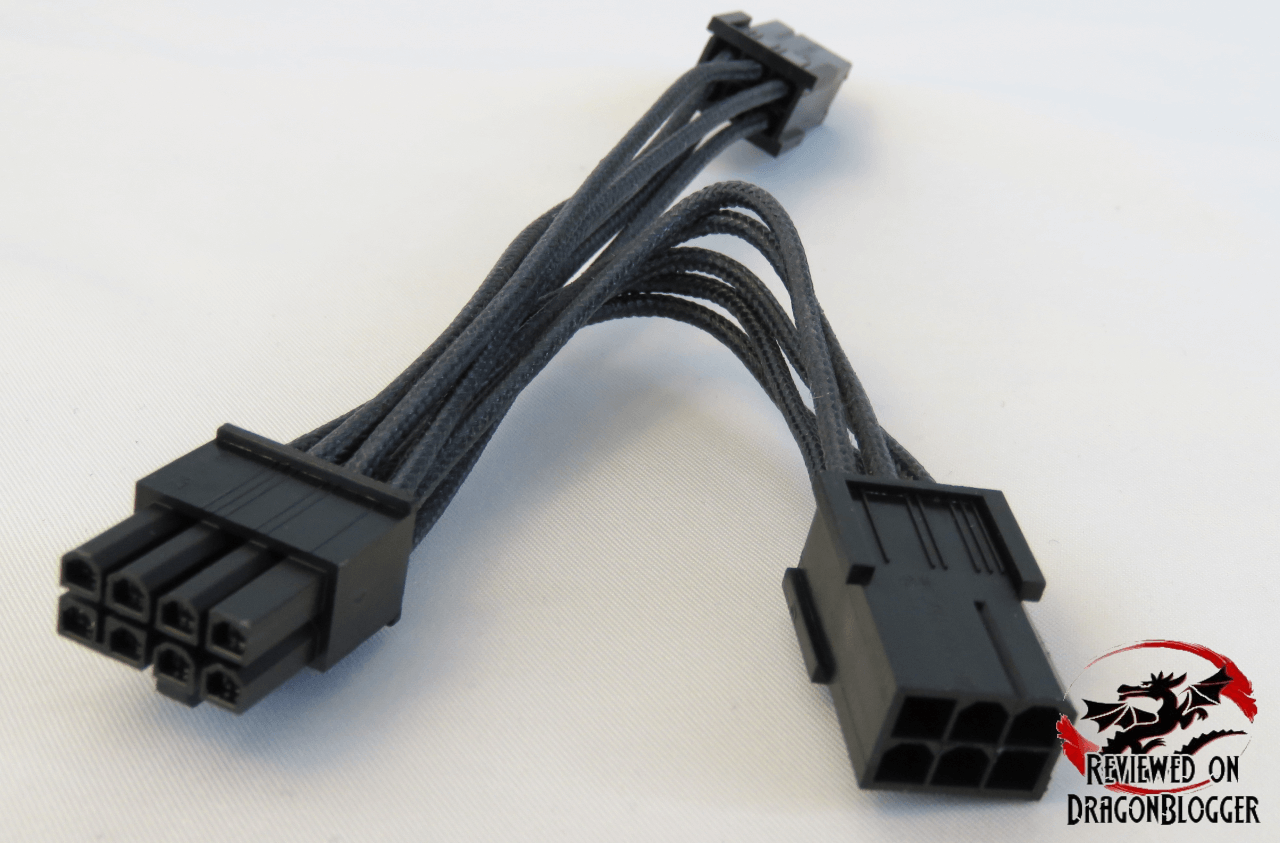
Last but not least, include you are missing an 8Pin PCI-e connection but have an abundance of PCI-e by 6 connections, they include a 2 x 6Pin PCI-e to a single 8Pin PCI-e adapter. They want to make sure you can use this video card.
OK, that’s enough with the add-ons, let’s check out the card itself in the next page.
[nextpage title=”A Closer look at the card”]
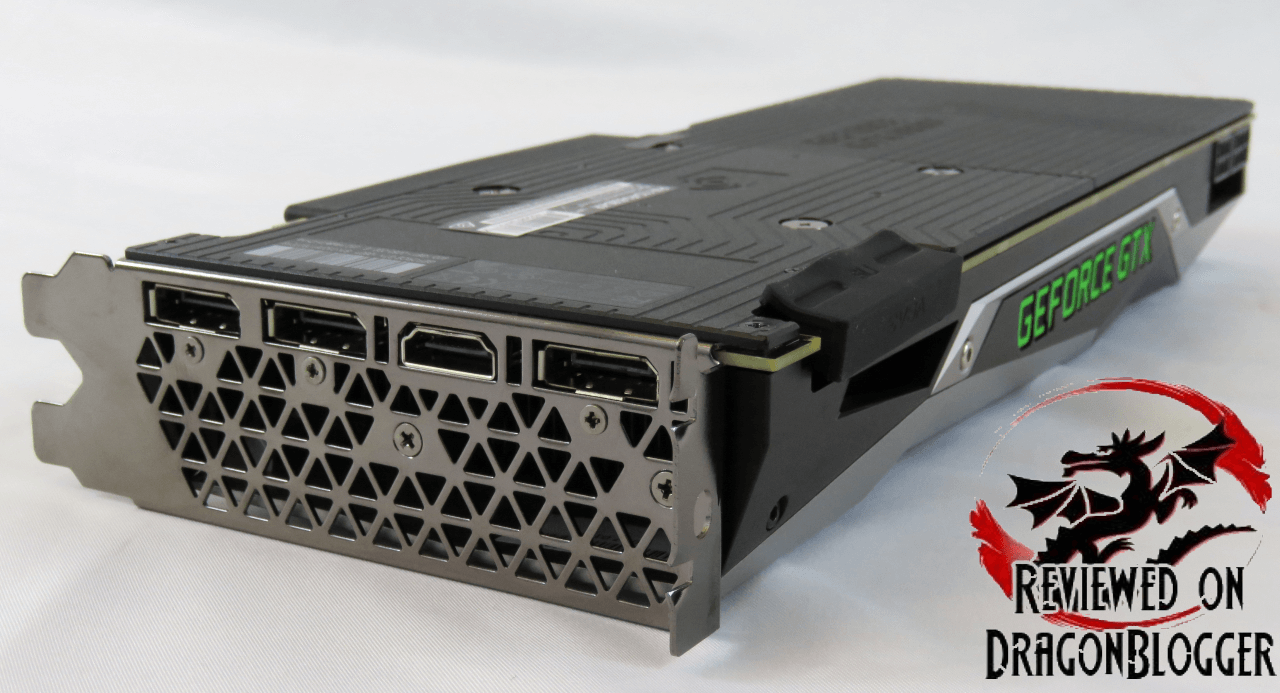
Here she is, the EVGA GeForce GTX 1080 TI Founders Edition 11G-P4-6390. It’s OK to drool, she knows she looks good. So, let’s look around the card and check everything out.
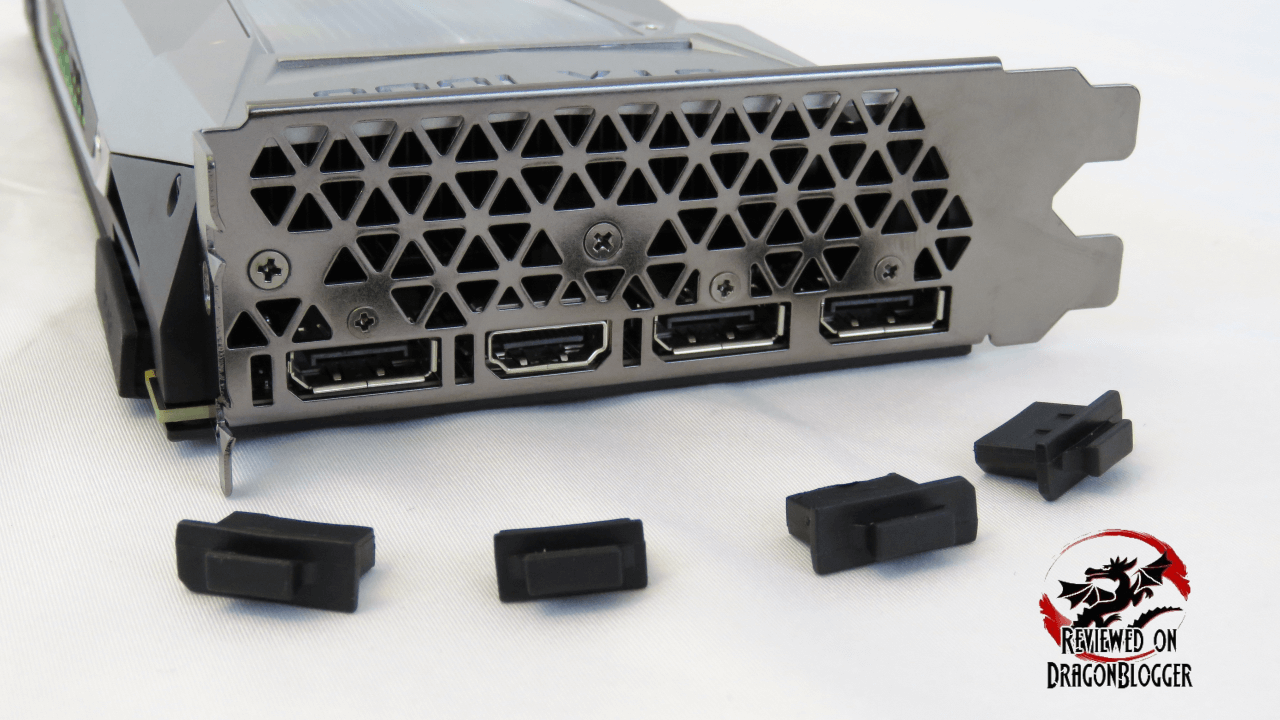
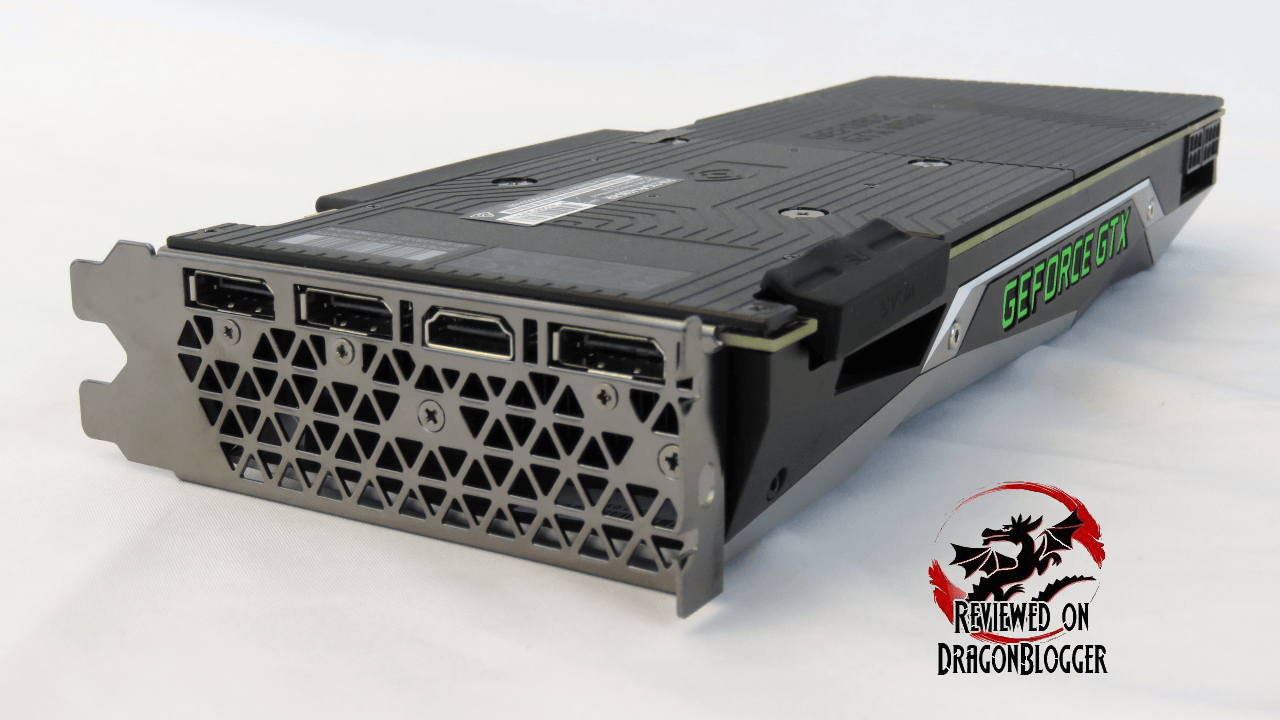
Removing the covers, we can see the card has 3 Display ports of which are the 1.4 variety and a single HDMI port which is 2.0b. You are stuck if you display is only VGA, and if it was you may want to look at upgrading your monitor as well instead of buying an adapter. If you only have DVI, you are in luck, they do include a DisplayPort to DVI adapter as I mentioned previously. You can connect up to 4 monitors here and use them simultaneously.
Moving to the right of the card, we see that the card comes with a rubber cover over the SLI port fingers. Let’s remove it so that you can see what it looks like.
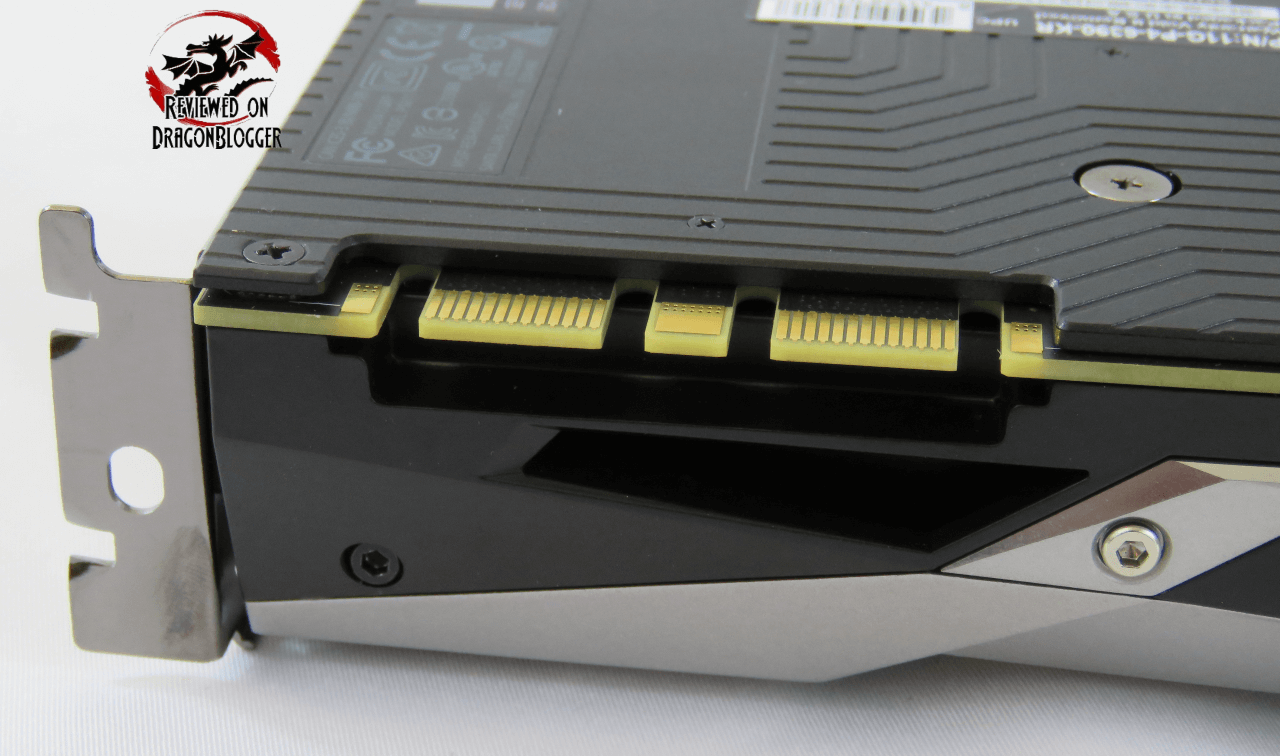
She’s a little shy now undressed but she looks amazing. While SLI is a bonus, you can remove the rubber cover even if you are not going to use SLI.

This is what the SLI HB Bridge looks like, but alas… it is not included, you will have to buy it separately.
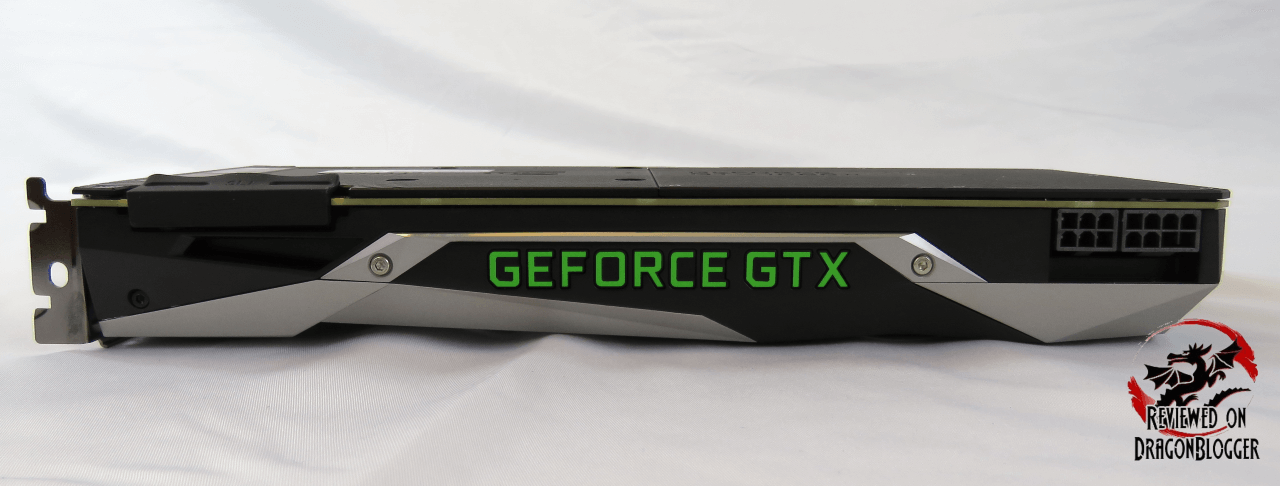
A little more off to the side, we find the “GEFORCE GTX” logo, and there is a little more of a trick to the logo that I will show you a little later.
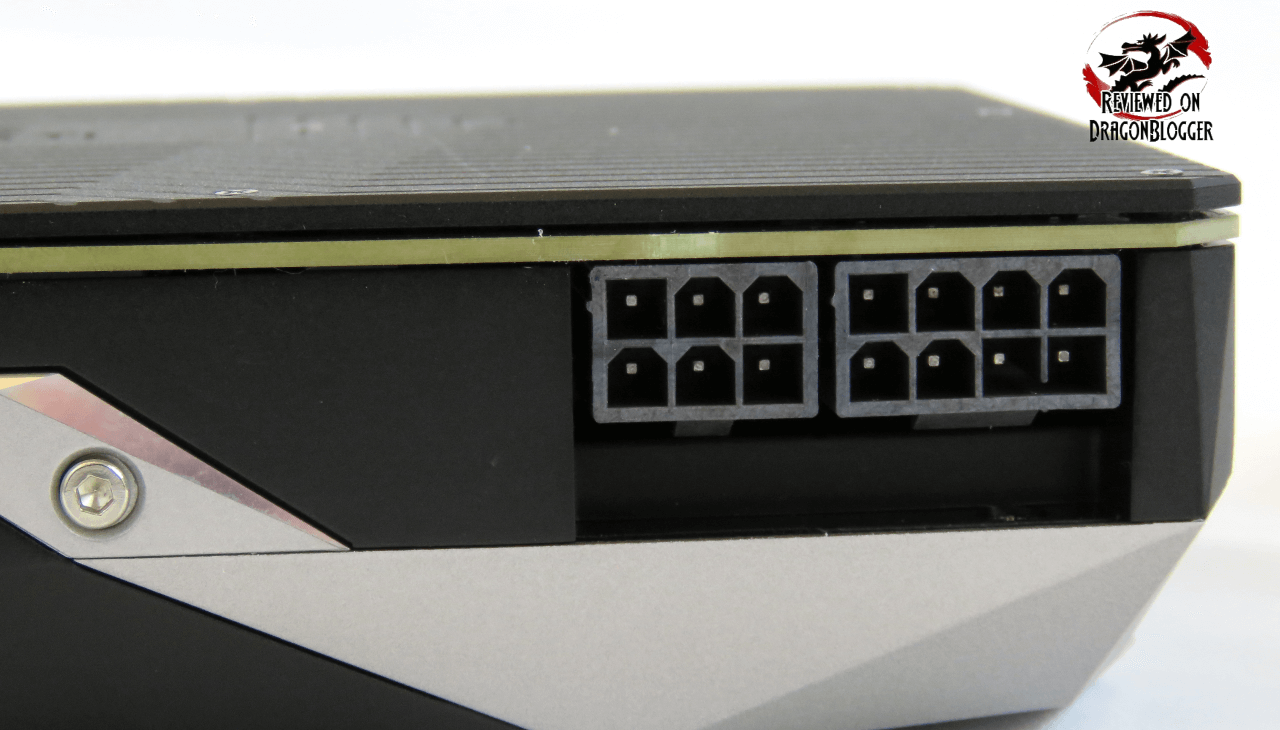
A little more to the right we find the 2 x PCI-e connections. This card has a 6Pin PCI-e connection and an 8Pin PCI-e connection.
Along the backside of the card we find the vents inside of the shroud but we also find 3 little holes.
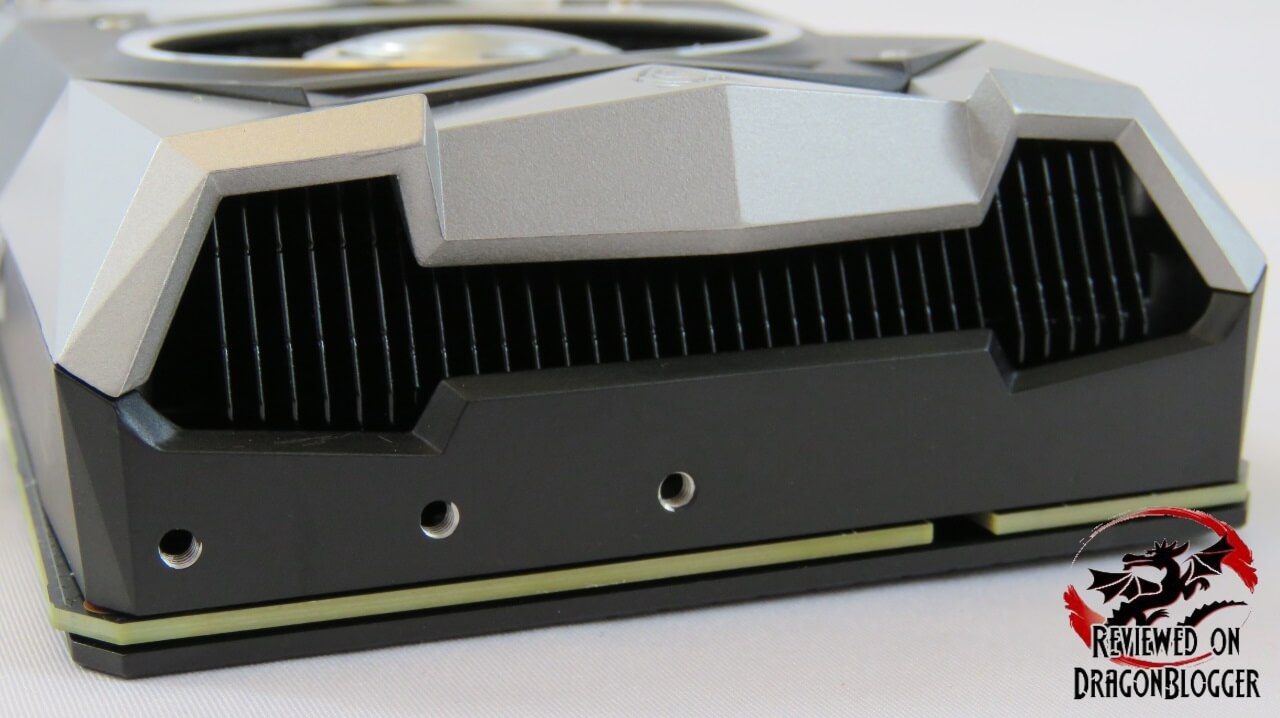
Those holes are used more for OEM’s and boutiques that wish to use them to keep the cards from sagging and also protect them and hold them in place for shipping purposes then also for aftermarket manufactures to do with what they which.
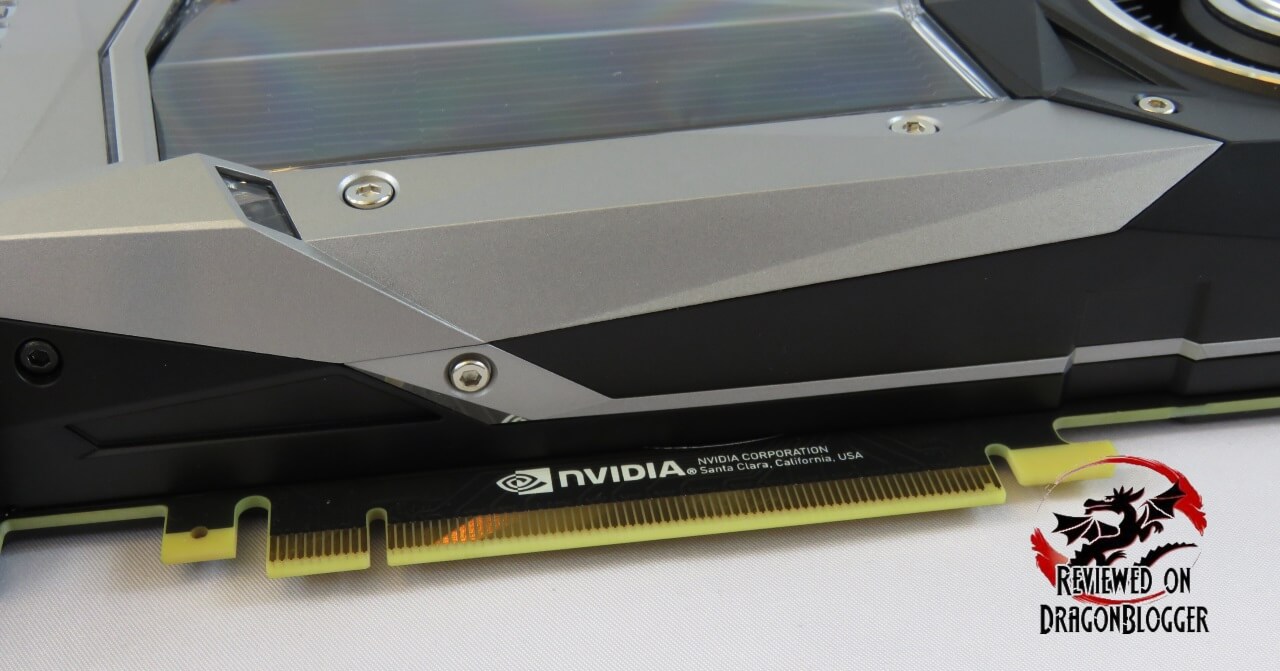
Moving more to the right we reach the bottom of the card. Here we can find the PCI-e fingers that are using to slide into the x16 PCI-e slot. This card by the way is a PCI-e 3.0 card.
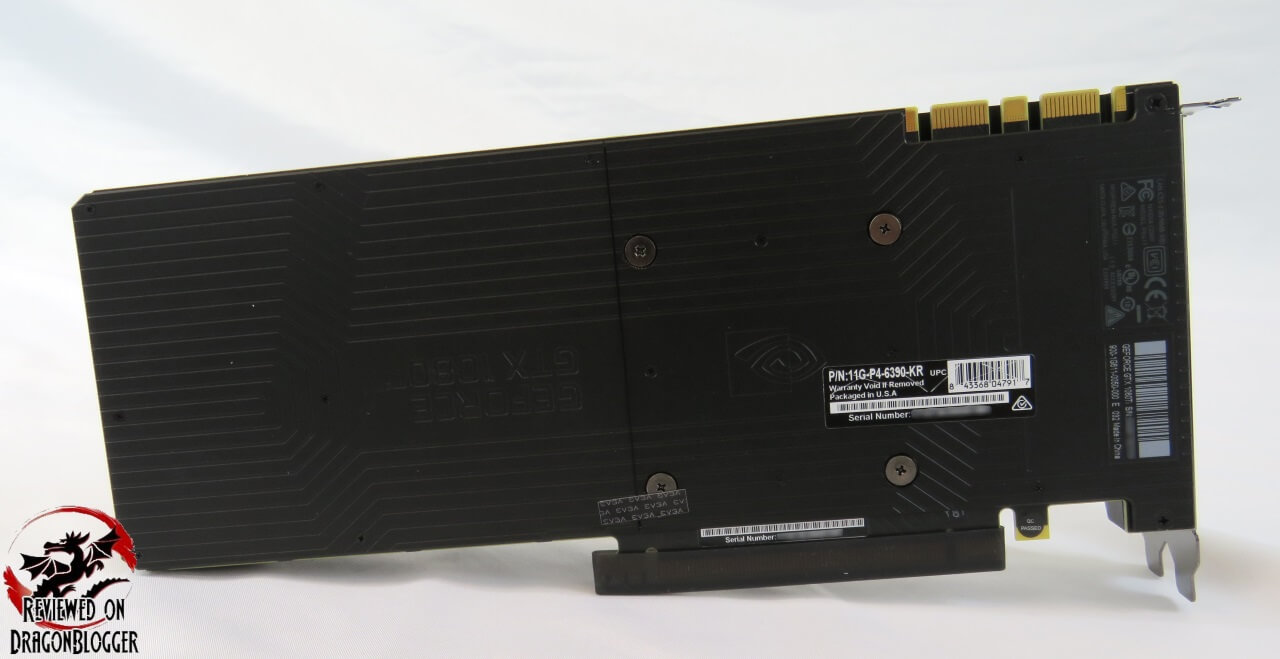
Here we can see the back of the card. This comes covered in a backplate covering up the PCB.
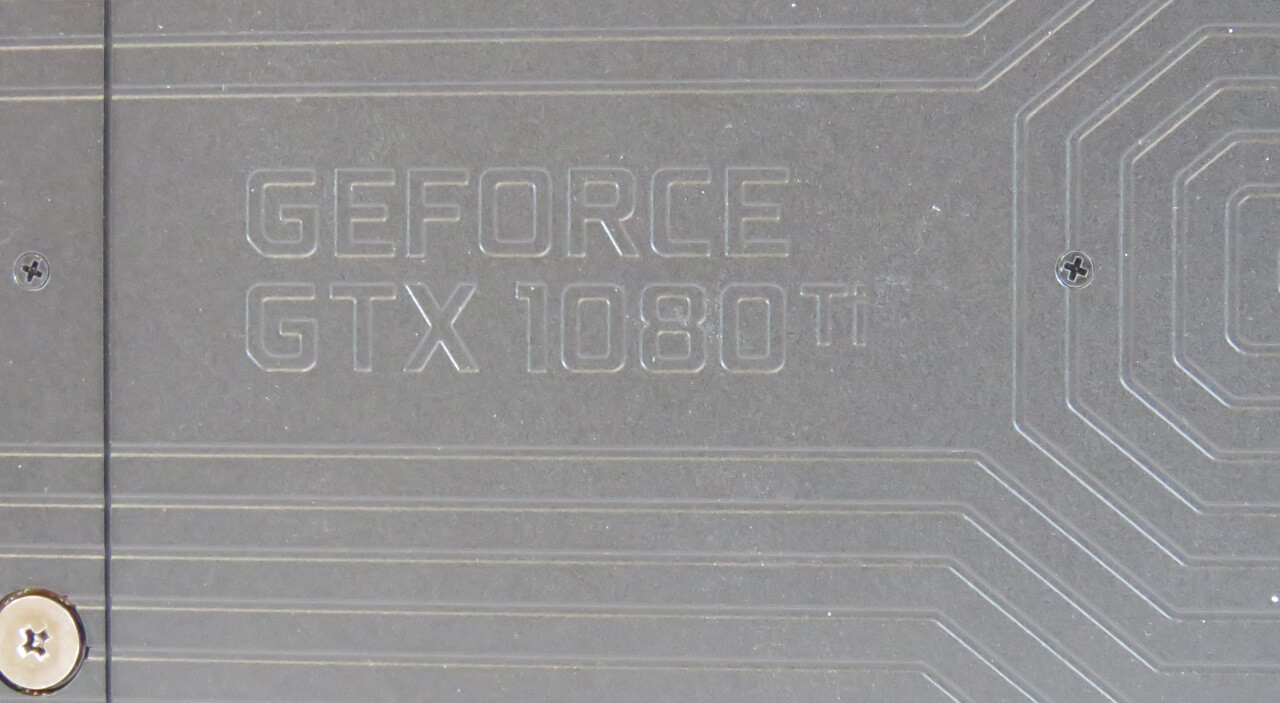
The backplate is not just smooth anodized aluminum it also has a design on it. Aside from the design, it has the “GEFORCE GTX 1080TI” imprinted on it.
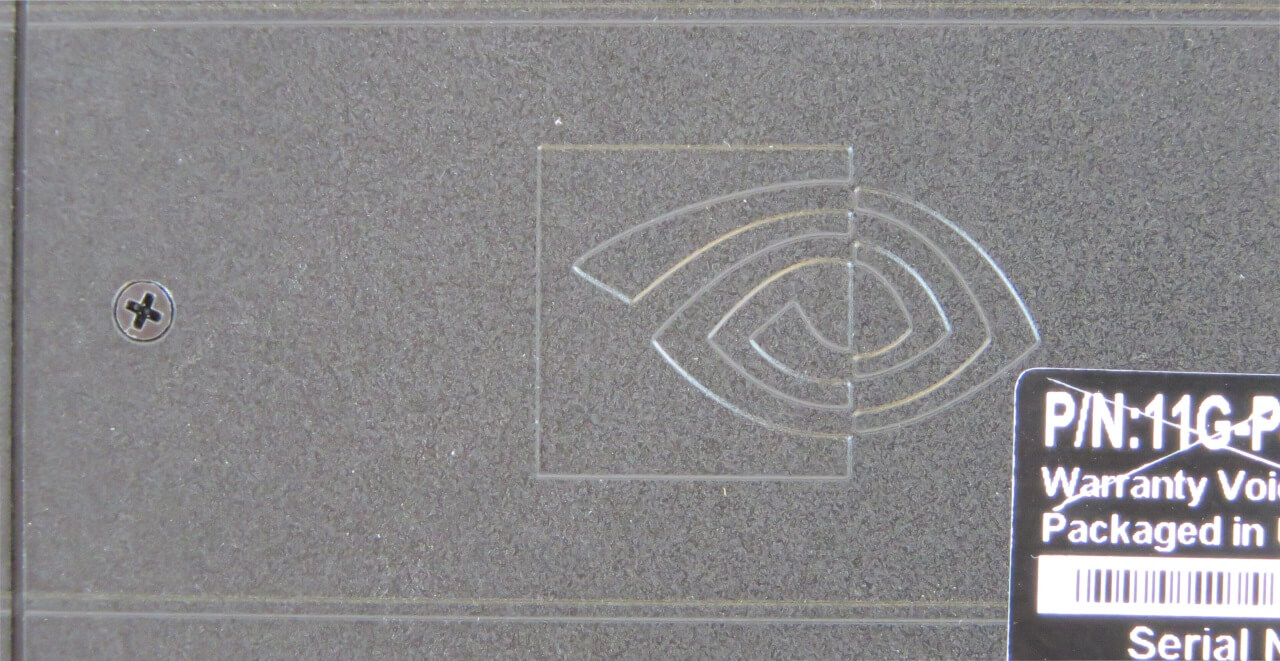
It also has the NVIDIA logo as well imprinted on it.
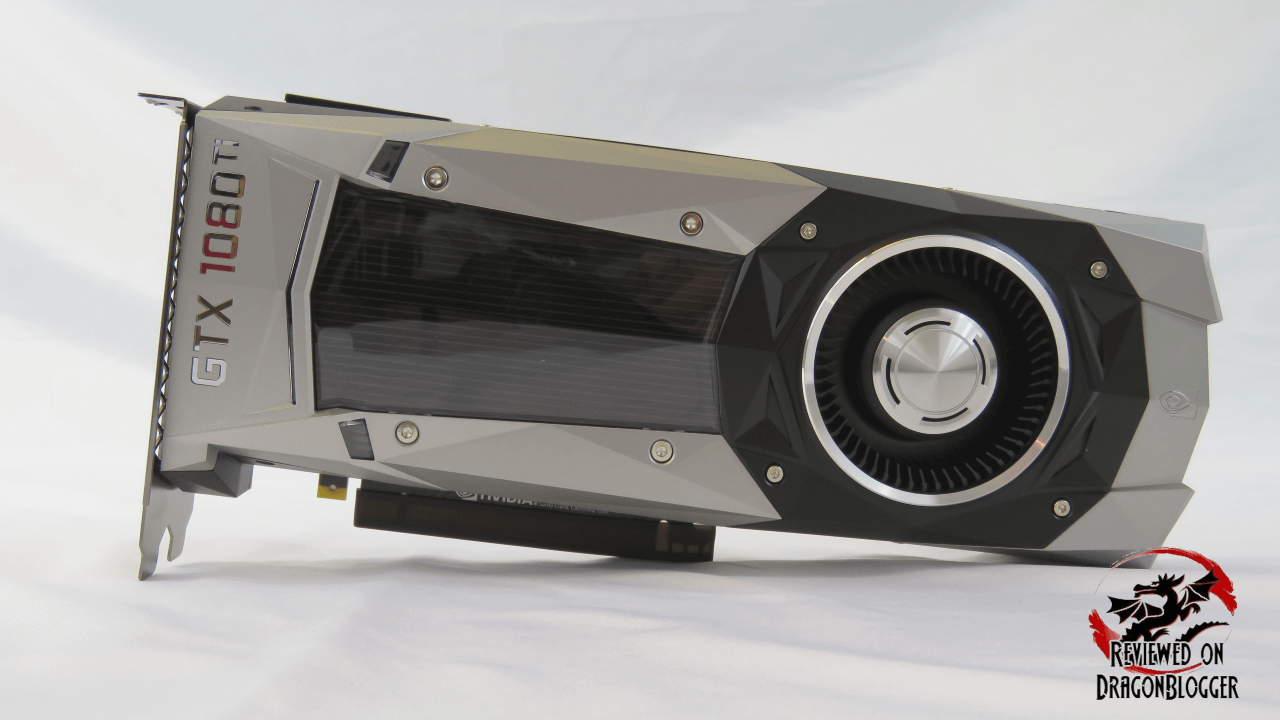
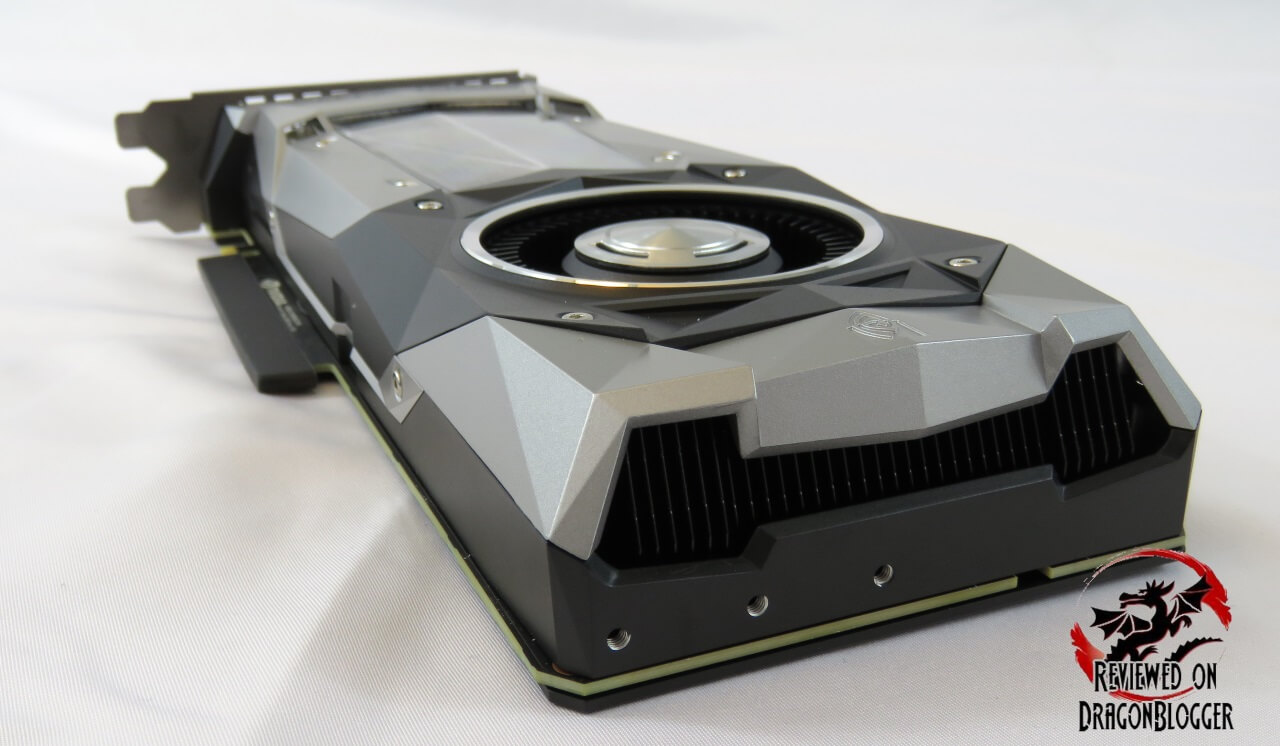
Coming around the front of the card, we can see her in all her beauty. The Founders Edition, an NVIDIA reference design only includes one fan. I will admit, I do prefer cards with dual fans, but that will be a review and a comparison for another date.
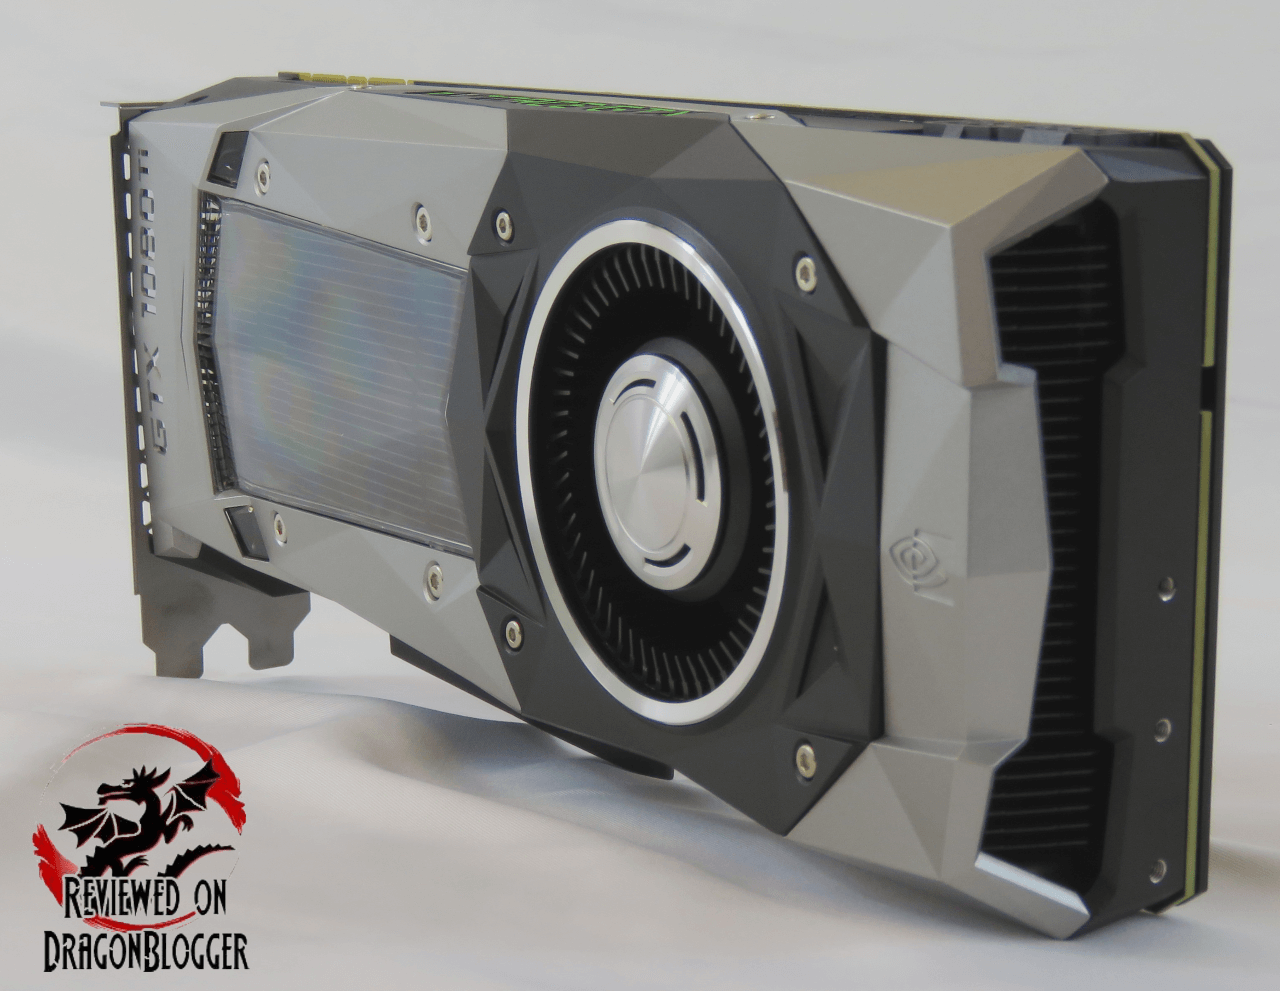
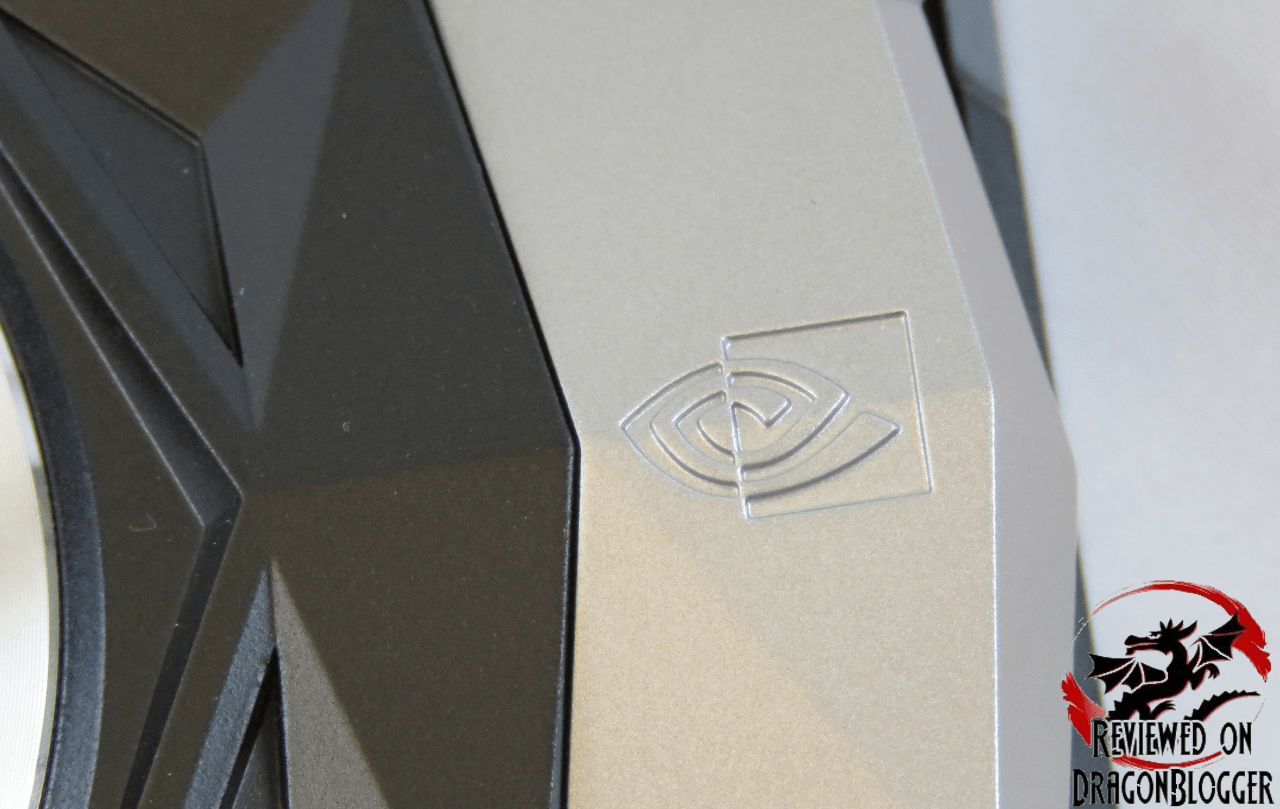
On the front, towards the rear of the card you can find the NVIDIA logo.
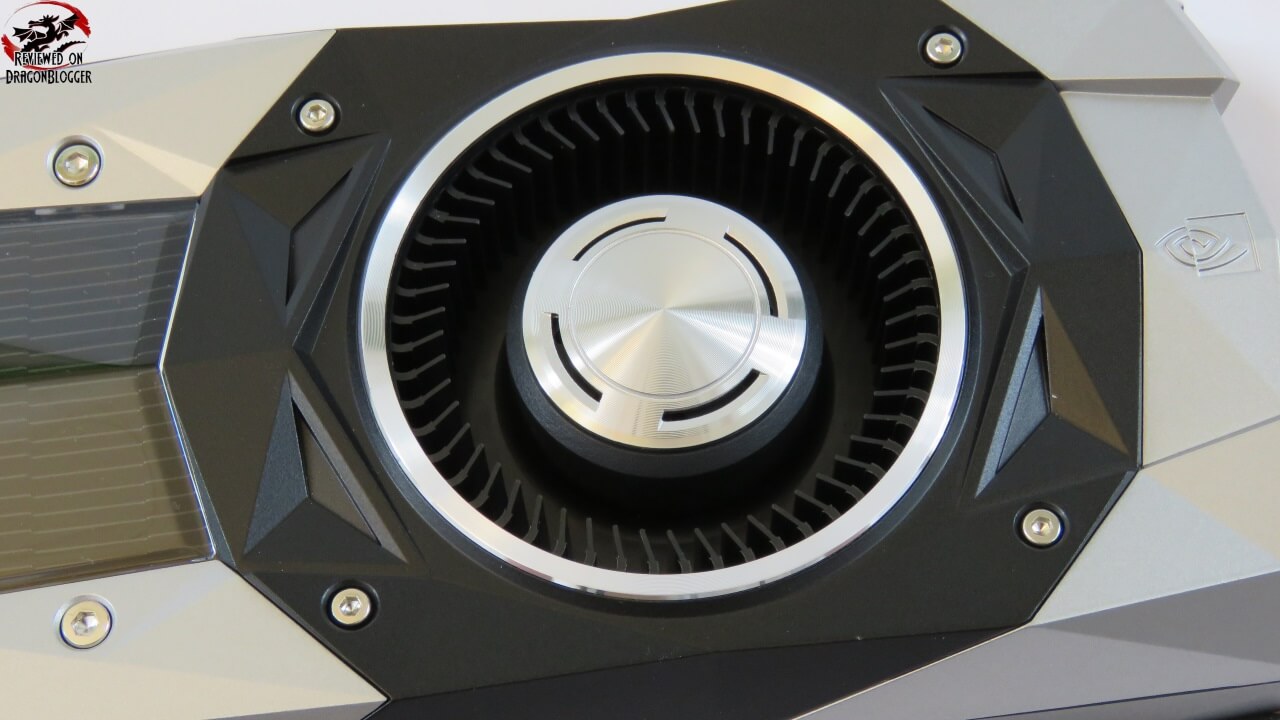
From the bottom, coming up a bit we see the single fan. They gave it a nice metallic finish.
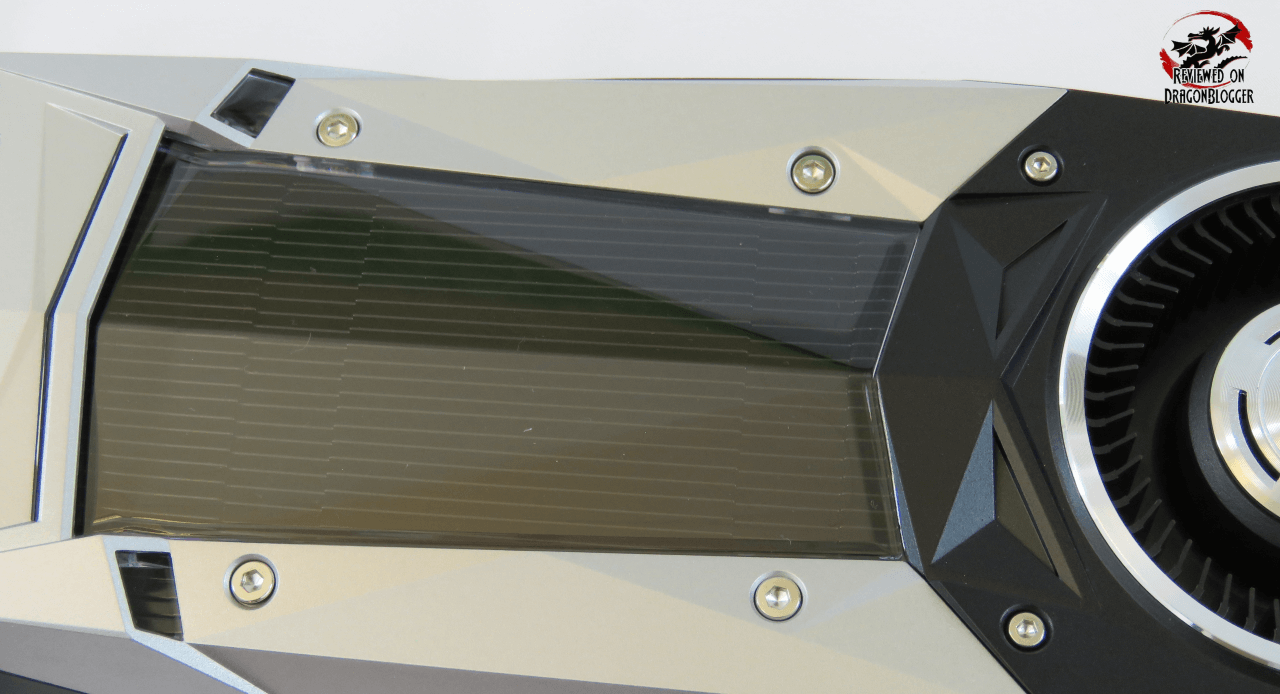
Coming up a bit more we find the vents covered in plastic to help direct airflow and some other industrial designs, complete with the bolts.
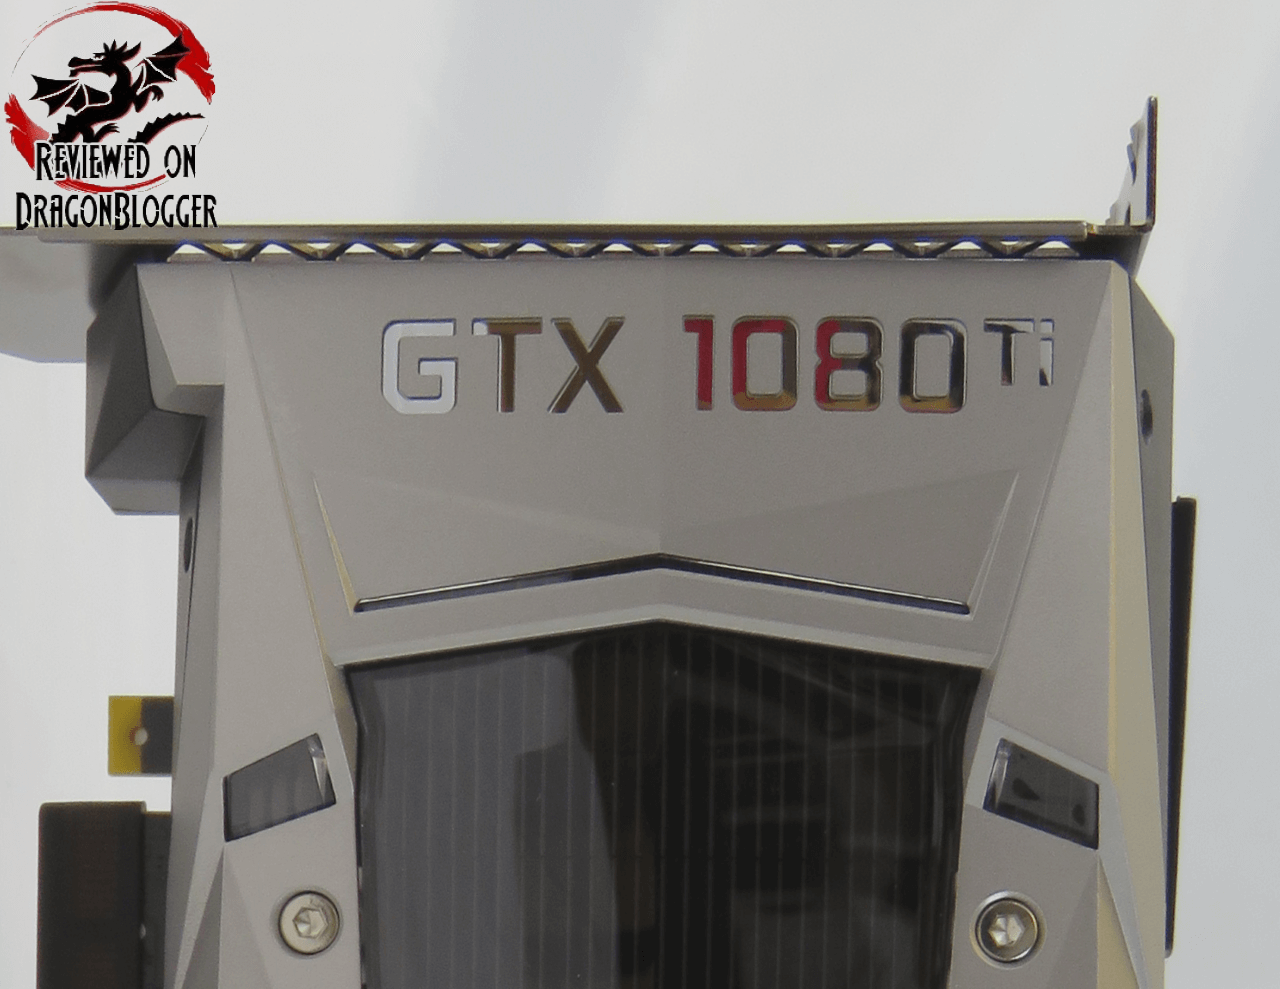
Along the front of the card as well, towards the top we find the “GTX 1080TI” brand.
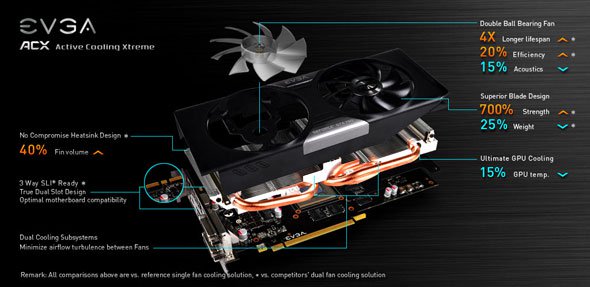
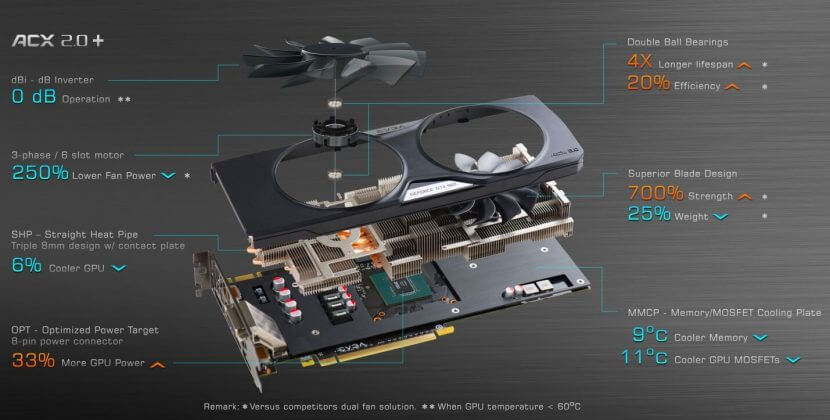
While this is a Founders Edition type card only having 1 fan, it still utilizes EVGA’s ACX 3.0. Here’s a little history on ACX.
ACX 1.0
ACX 2.0
ACX 3.0
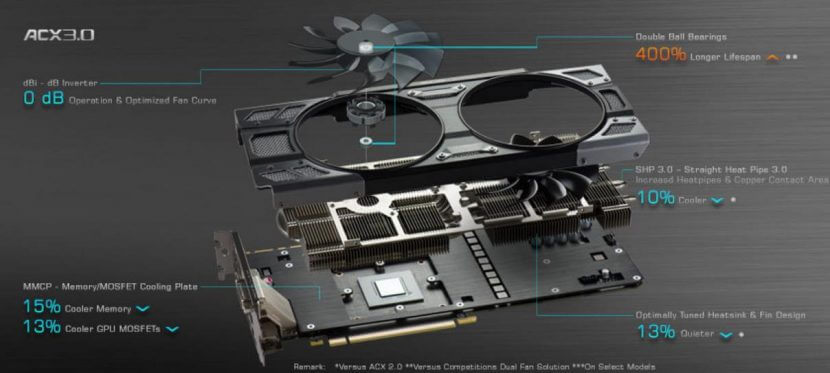
ACX 3.0 claims to have 13% more optimally tuned heatsink and fin design than that of ACX 2.0. I wonder then, being a Founders Edition card, how can this claim be made?
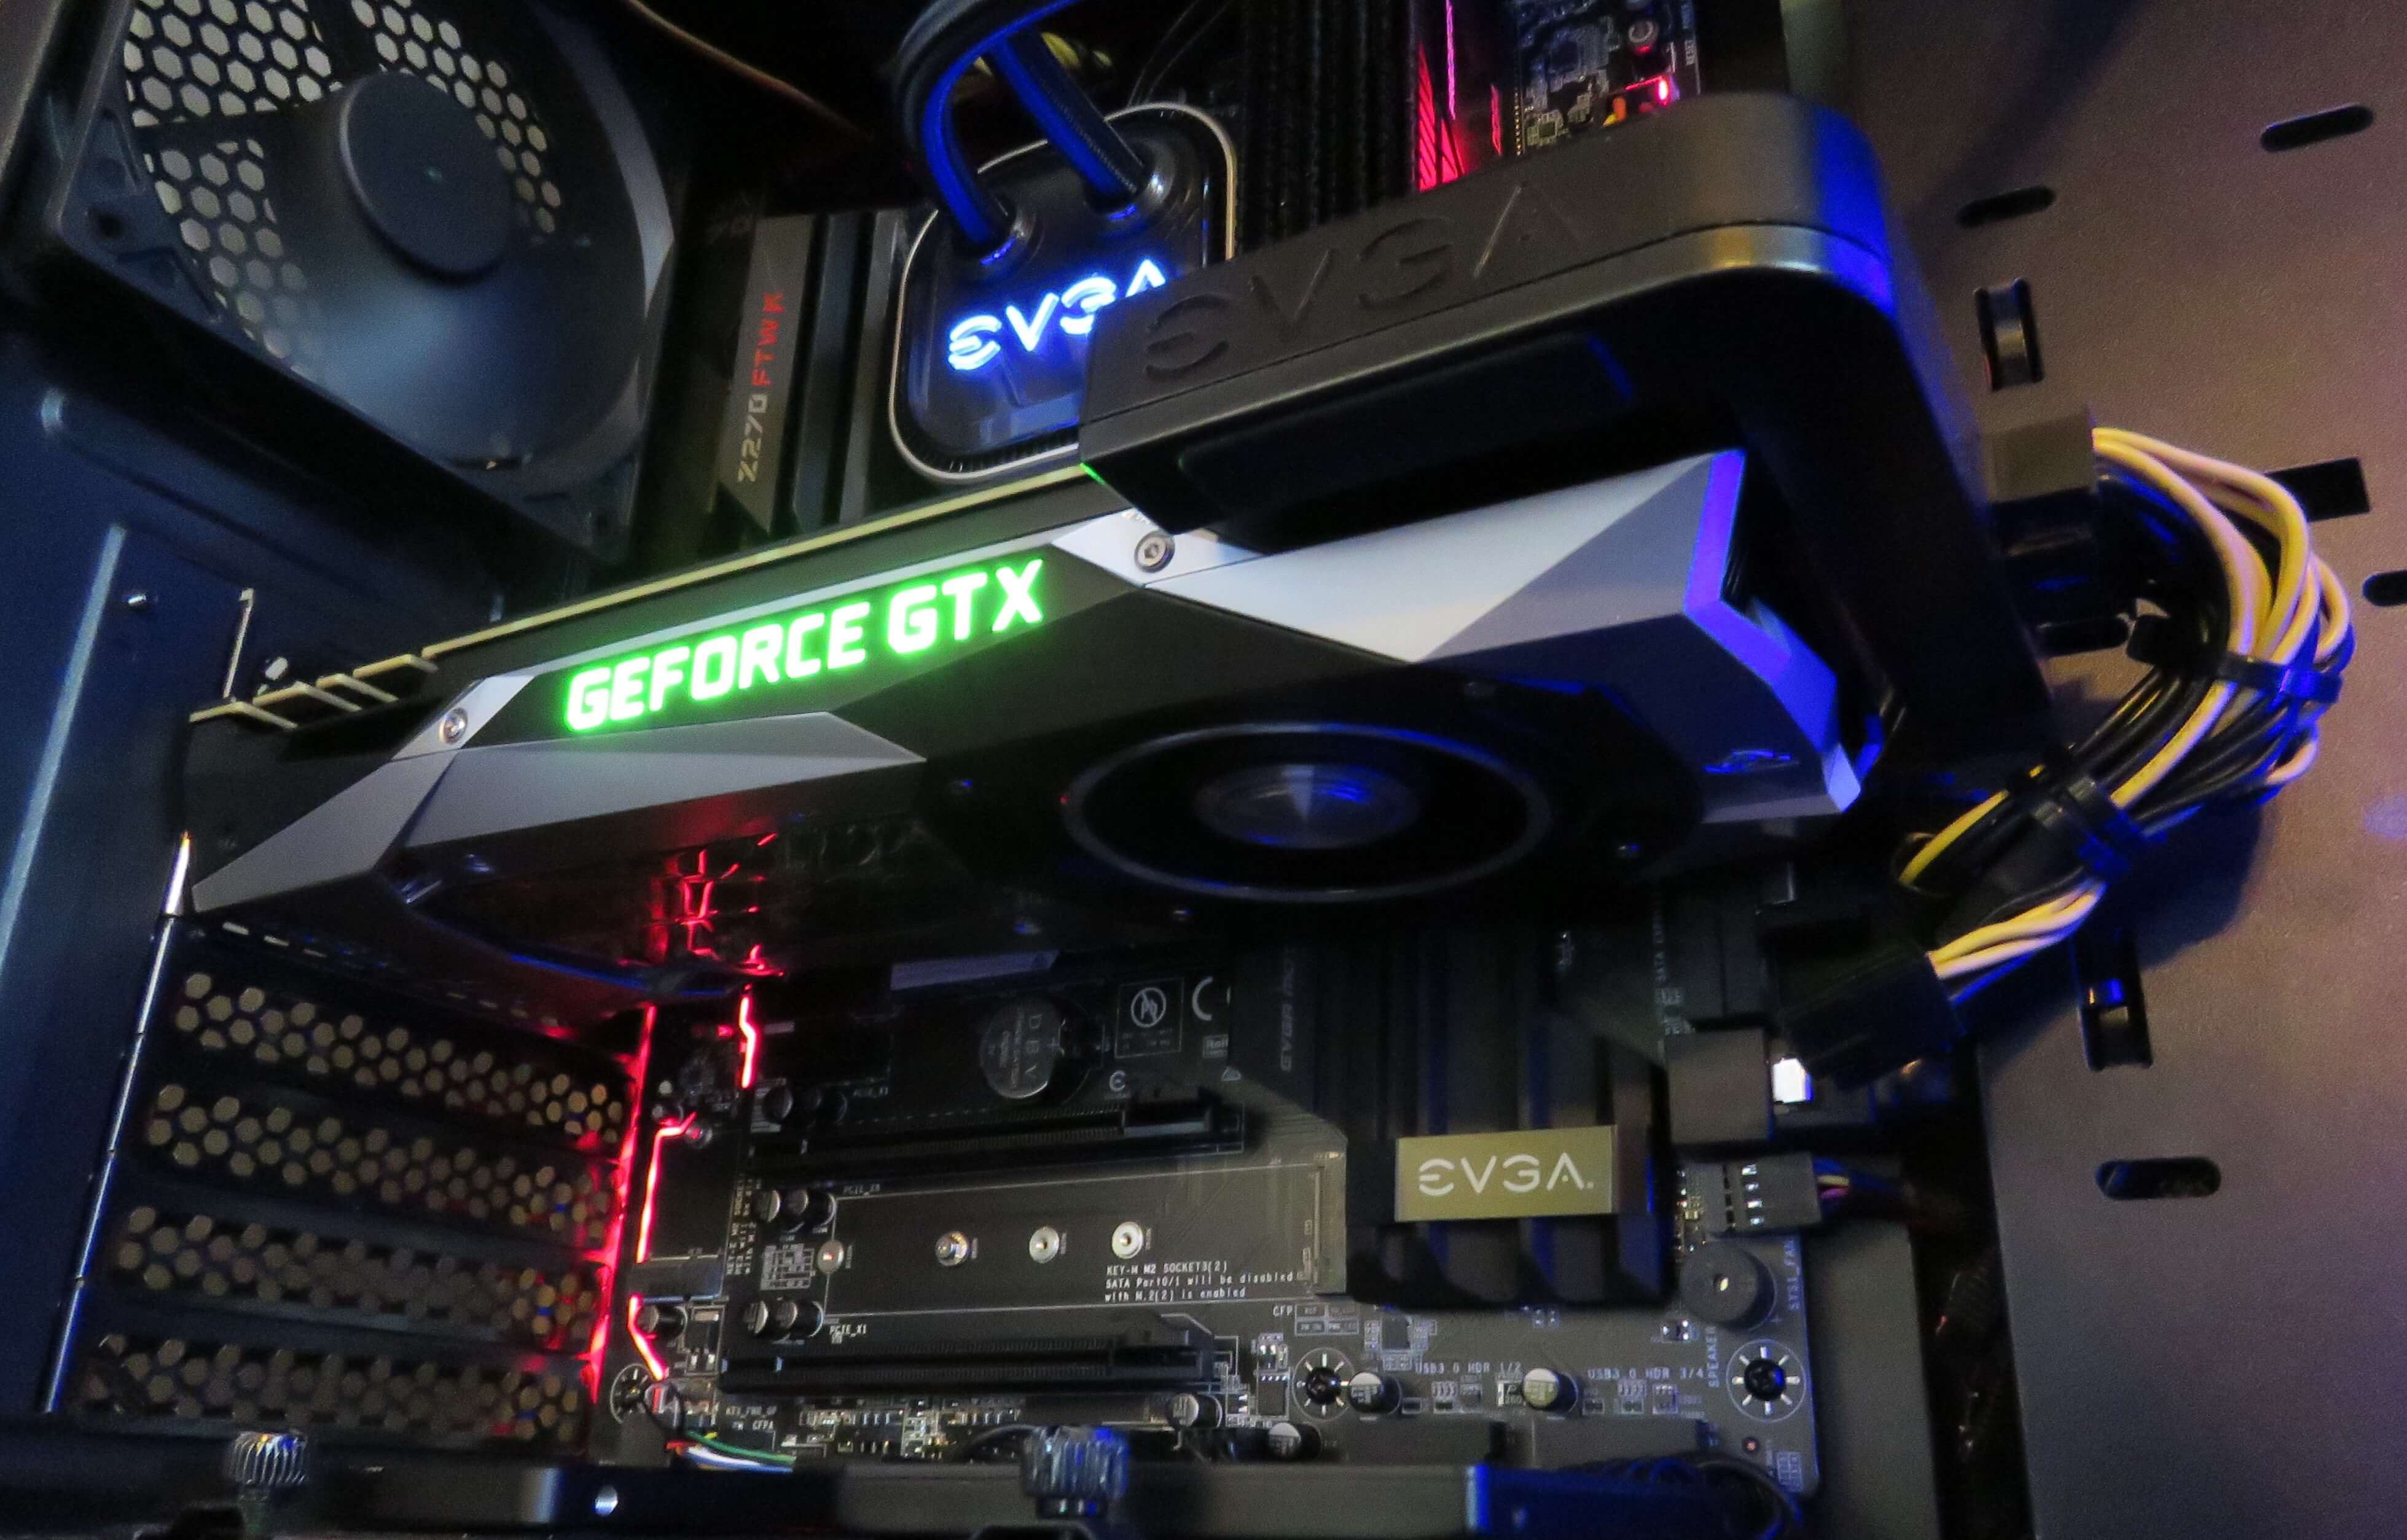
Here is the card showing off some of its style packed with the EVGA Powerlink and then showing off some LED. Now it did not just appear in the computer by looking at it, you have to install it.
In the next page, I will show you how to install the EVGA GeForce GTX 1080 TI Founders Edition.
[nextpage title=”Installing the EVGA Geforce GTX1080 Ti Founders Edition”]
This may be a section some will skip over because they may already know how to install a video card, but I do this to help those of you that do not. I do this so that you can have enough confidence installing or upgrading your own video card, even maybe building your own PC. This video walks you through installing/upgrading a video card.
Here she is installed on the EVGA Z270 FTW K motherboard, makes a nice pair.
I will have to state, I had video of me doing this install/upgrade alone but I deleted it by mistake so I had to edit a video I did on a full system build. In case it will help you, here are the 2 videos in which I extracted this video from. Video #1 is how to build a PC and Video #2 is how to cable a PC.
How to build a Gaming PC with Intel, EVGA, HyperX, Cougar and more
How to cable a Gaming PC with Intel, EVGA, HyperX, Cougar and more
Alright, now it’s time to check out how she performs. This next page has some benchmarks.
[nextpage title=”Benchmarks, Performance, Temperatures and Power Consumption”]
Before we get into the benchmarks, here are my system specs so that you can use them as reference and then also to compare with your own system.
- Anidees AI Crystal Case:https://geni.us/6NAIJBN?ygdb
- Intel Core i7 7700K Processor: https://geni.us/6NAIJBN?5e87
- EVGA Z270 FTW K Motherboard: https://geni.us/6NAIJBN?xNpK
- EVGA CLC 280 Liquid Cooling Unit: https://geni.us/6NAIJBN?m4F6
- Kingston HyperX Predator 3000Mhz 16Gig:https://geni.us/6NAIJBN?w9kPe5
- EVGA Geforce GTX 1080Ti Founders Edition: https://geni.us/6NAIJBN?cLx0
- WD Black PCI-e NVMe 512GB SSD: https://geni.us/6NAIJBN?9H46
- Samsung 850 EVO 500GB SSD:https://geni.us/6NAIJBN?1gf0fs
- Hitachi 1TB SATA 3G HD:https://geni.us/6NAIJBN?pU2QOo
- Patriot Ignite 480GB SSD:https://geni.us/6NAIJBN?eoPVsG
- Kingston HyperX 240GB SSD:https://geni.us/6NAIJBN?8leEDW
- Cooler Master Silent Pro Gold 1200W Power Supply:https://geni.us/6NAIJBN?Umwm
- Microsoft Windows 10 Professional:https://geni.us/6NAIJBN?GYbBRY
Here are the clocks and specifications of the EVGA Geforce GTX1080 TI Founders Edition as reported by TechPowerUp’s GPU-Z.
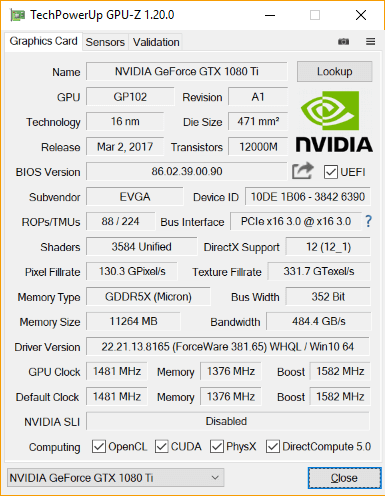
We will go over GPU-Z readings a little later in the review. The driver I was using in this review was 381.65 for Windows 10.
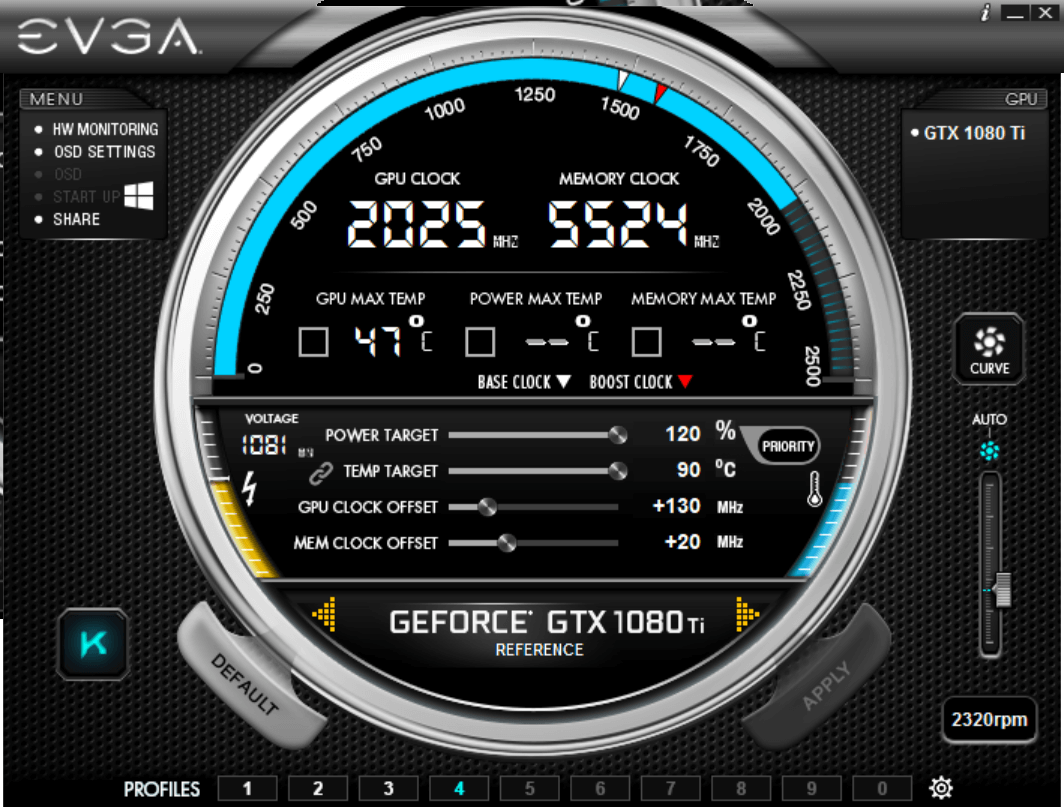
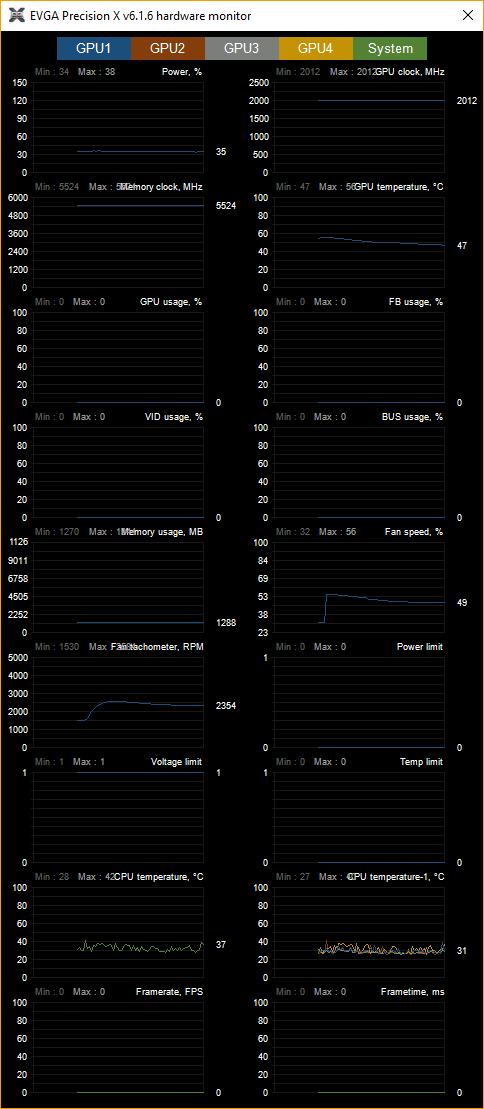
This is EVGA’s own utility EVGA’s Precision XOC used to read the GPU’s specifications and actually I use this in depth a little later on as well.
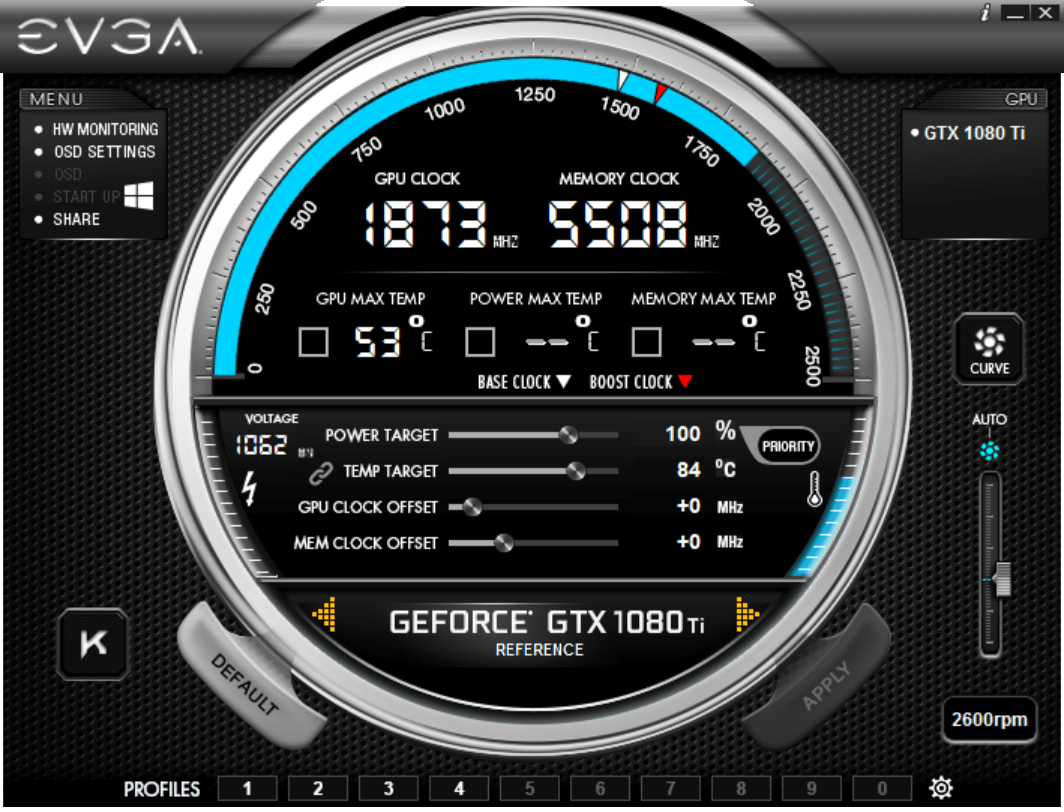
From this program, you can see the active GPU Clocks, Memory Clocks, Temperatures and you can control them as well, which means you can overclock. You can even go as far as changing the GPU fan speeds. We will get into that a little bit later.
For benchmarking, we will of course see the performance the video card provides, but we will also check the temperatures as well as the power consumption. In the tests I report on minimum, average and max usage using the “Kill A Watt” by “P3 International”.

The programs I am using in order to test the performance of these cards are the following:
- FutureMark’s 3DMark Fire Strike
- FutureMark’s TimeSpy
- Metro Last Light
- Thief
- Tomb Raider
- Tom Clancy’s The Division

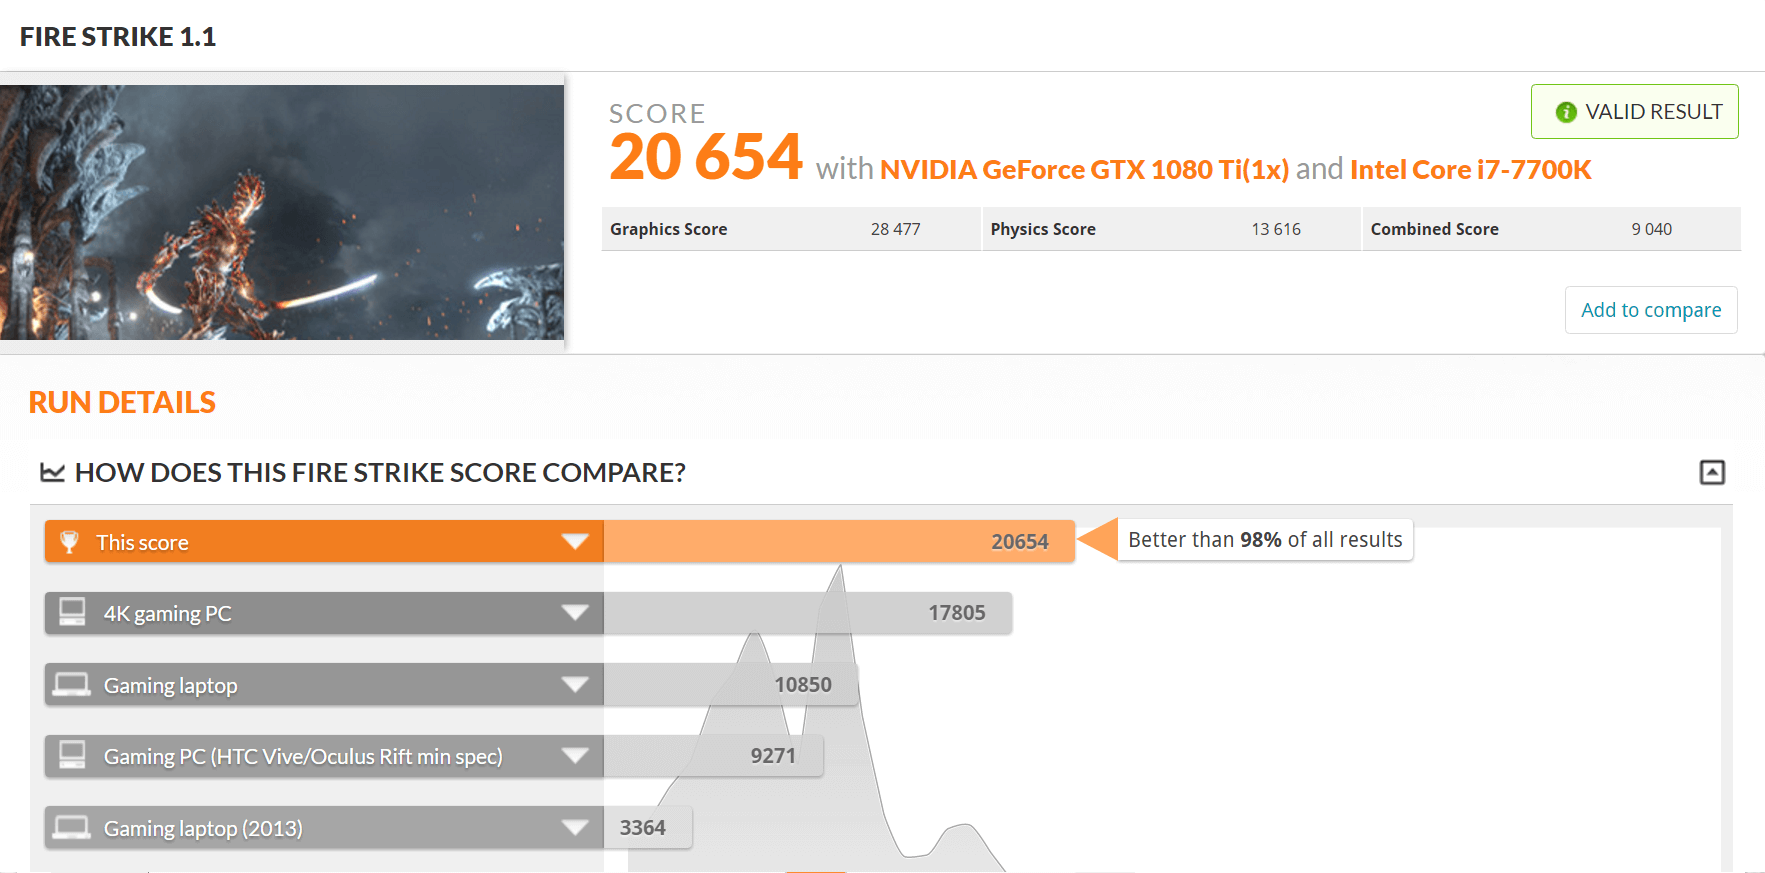
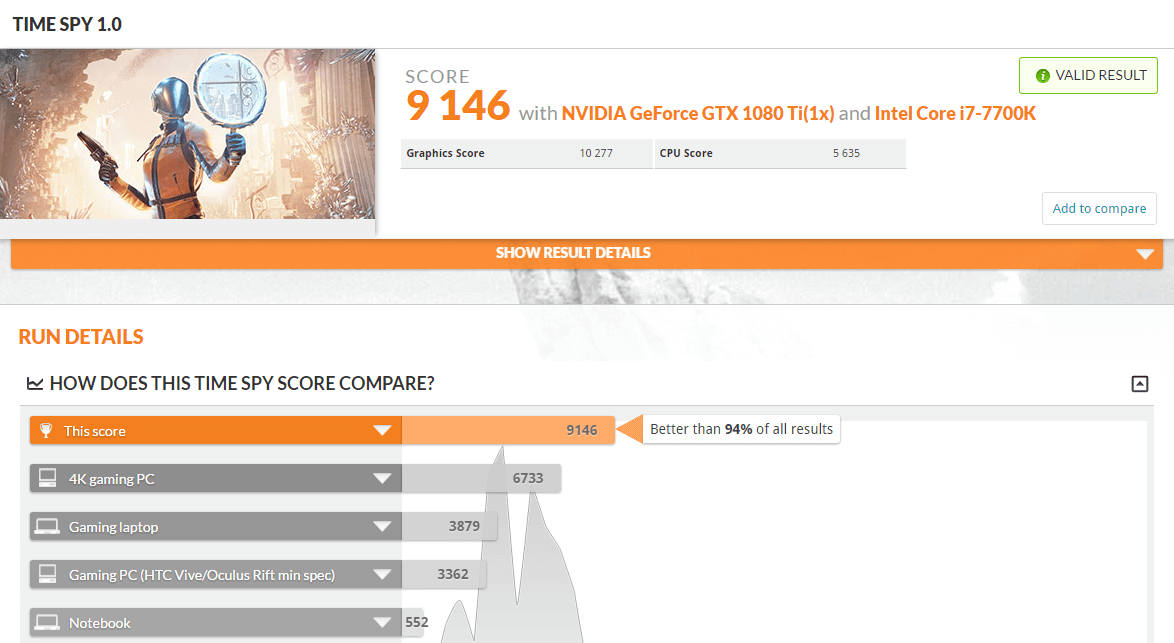
This is the best score I have seen so far, it performance 98% better than all other results. The lowest wattage reached during this benchmark was 147Watts, Pascal has done an amazing job with power. The average power consumption though was 352Watts with a peak of 364Watts at only 77°C.
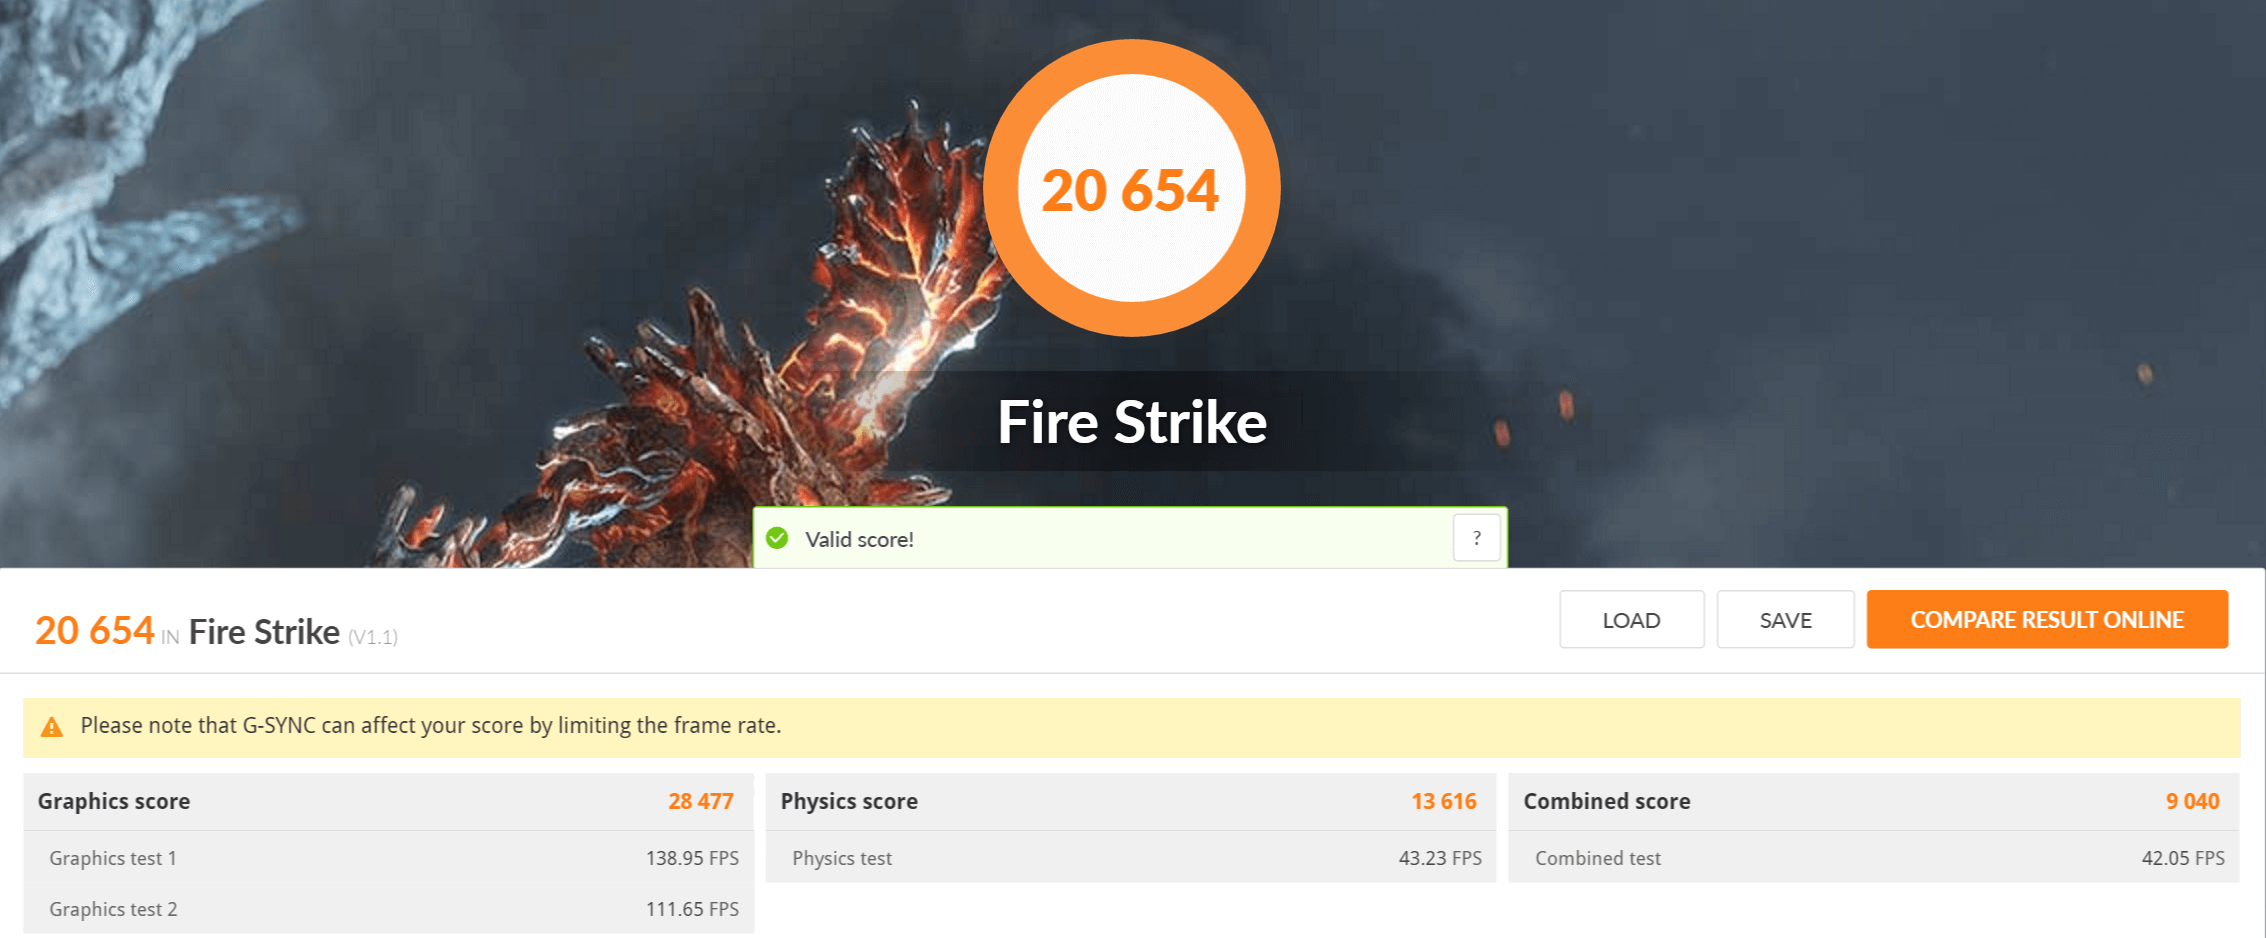
Breaking it down, we can see the total graphics score was 28,477 while Graphics test 1 was 138.95 FPS and Graphics test 2 was 111.65 FPS. The overall physics score off of the GPU was 13,616 and coming in at 43.23 FPS and finally the Combined scored was 9,040 with a combined test of 42.05 FPS.
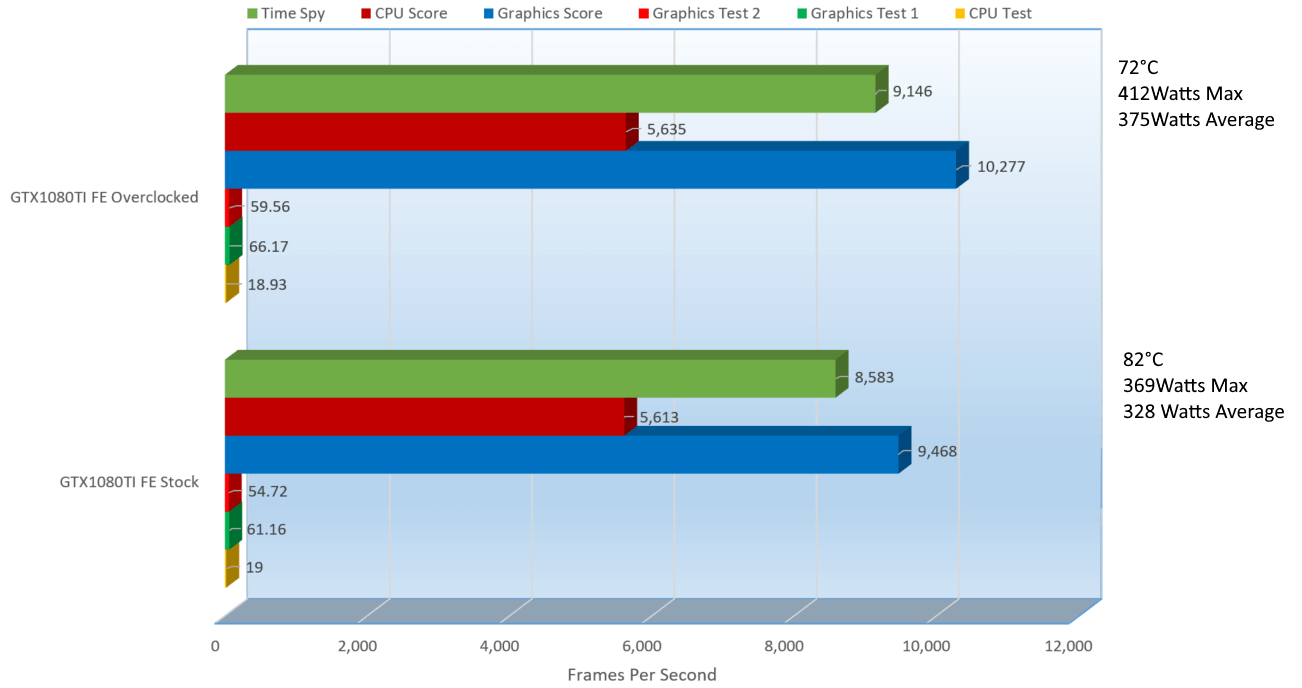
A new benchmark I am adding to the round up is Futuremark’s Time Spy. Time Spy is a DirectX 12 benchmark with support for newer API features like asynchronous computer, explicit multi-adapter support and multi-threading. Time Spy’s graphic tests while not at 4K, are rendered at 2560 x 1440.
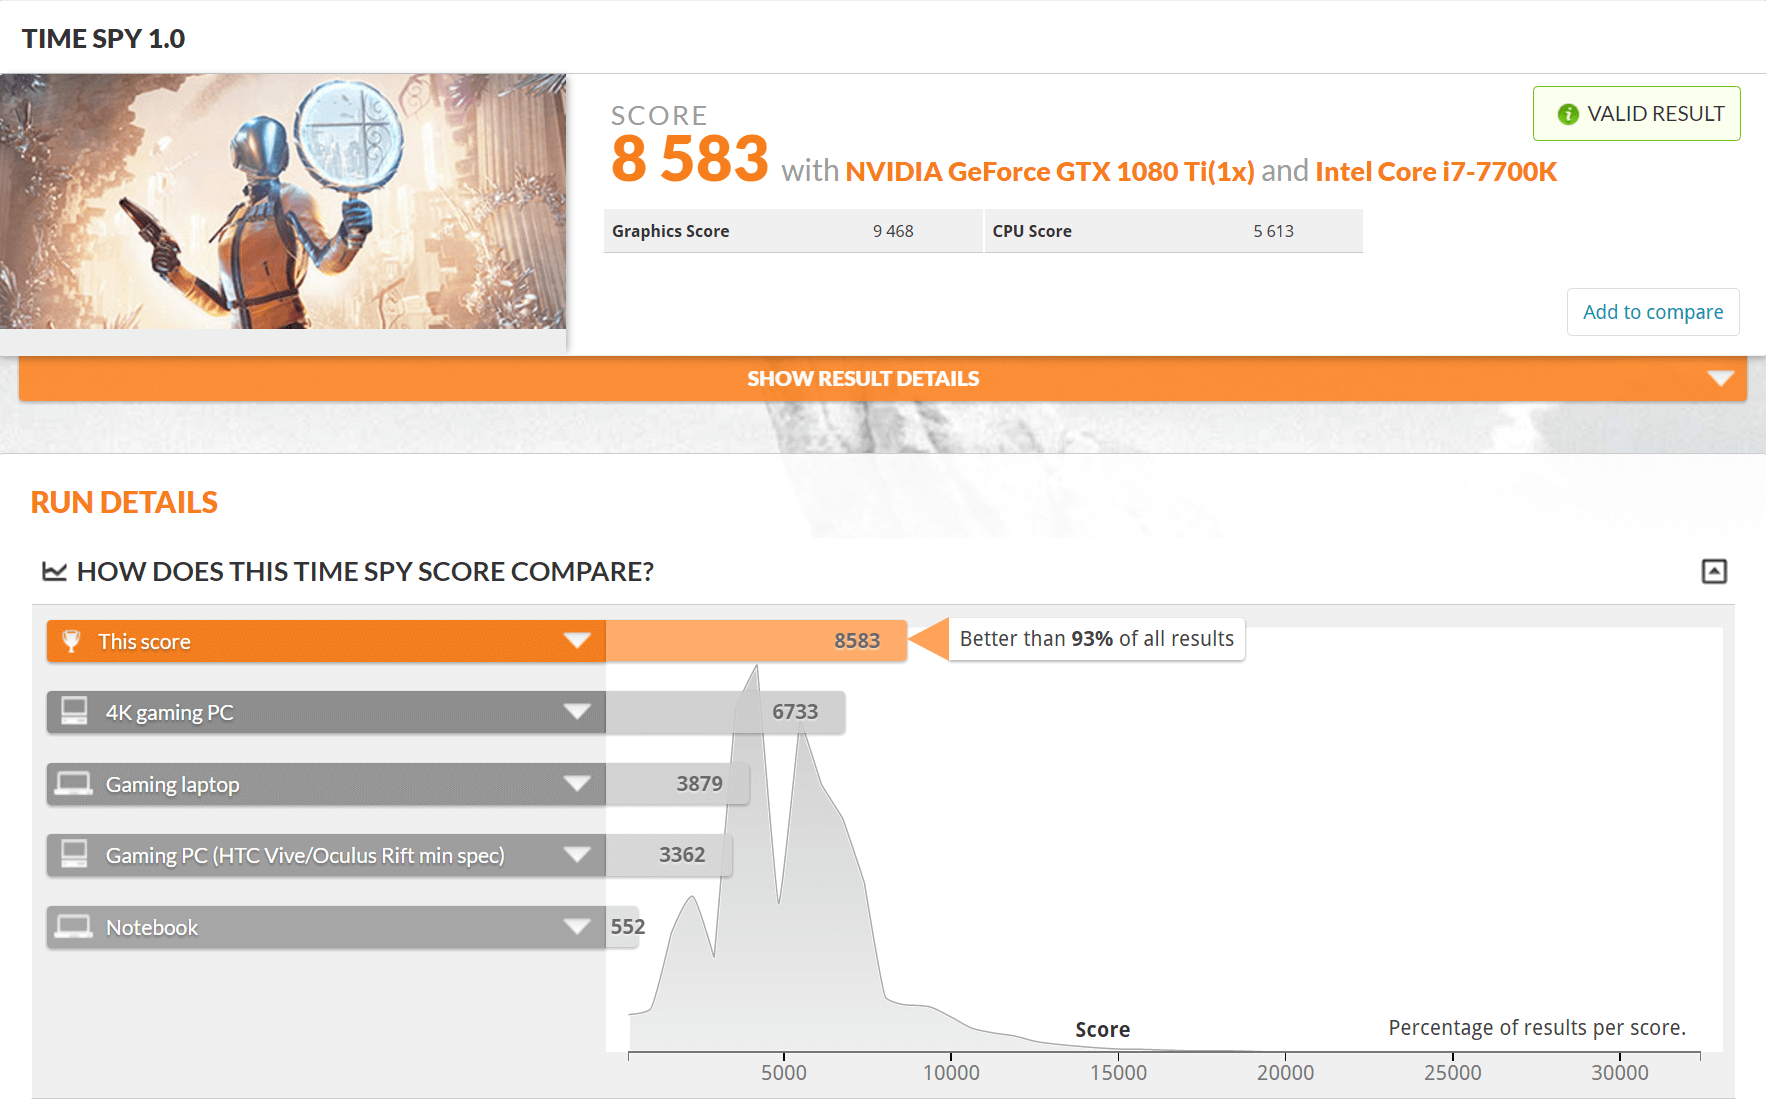
Looking at this score, many might get dismayed and go back to older versions of the benchmark because they scored higher there, it sounds odd but I have seen it many times. Using older versions might be a good reference point, but you have to move with the times and truly test your hardware.
Here we can see that even though we are at stock speeds, the results from this card and machine are 93% better than all others, that is a bit refreshing. Many of the results on 3DMark and TimeSpy are results from overclocked components, but as for right now this system is fully stock.
Here I was hitting 82°C with an average wattage hit of 328Watts. The peak power draw was 369Watts and a minimum of 149Watts.
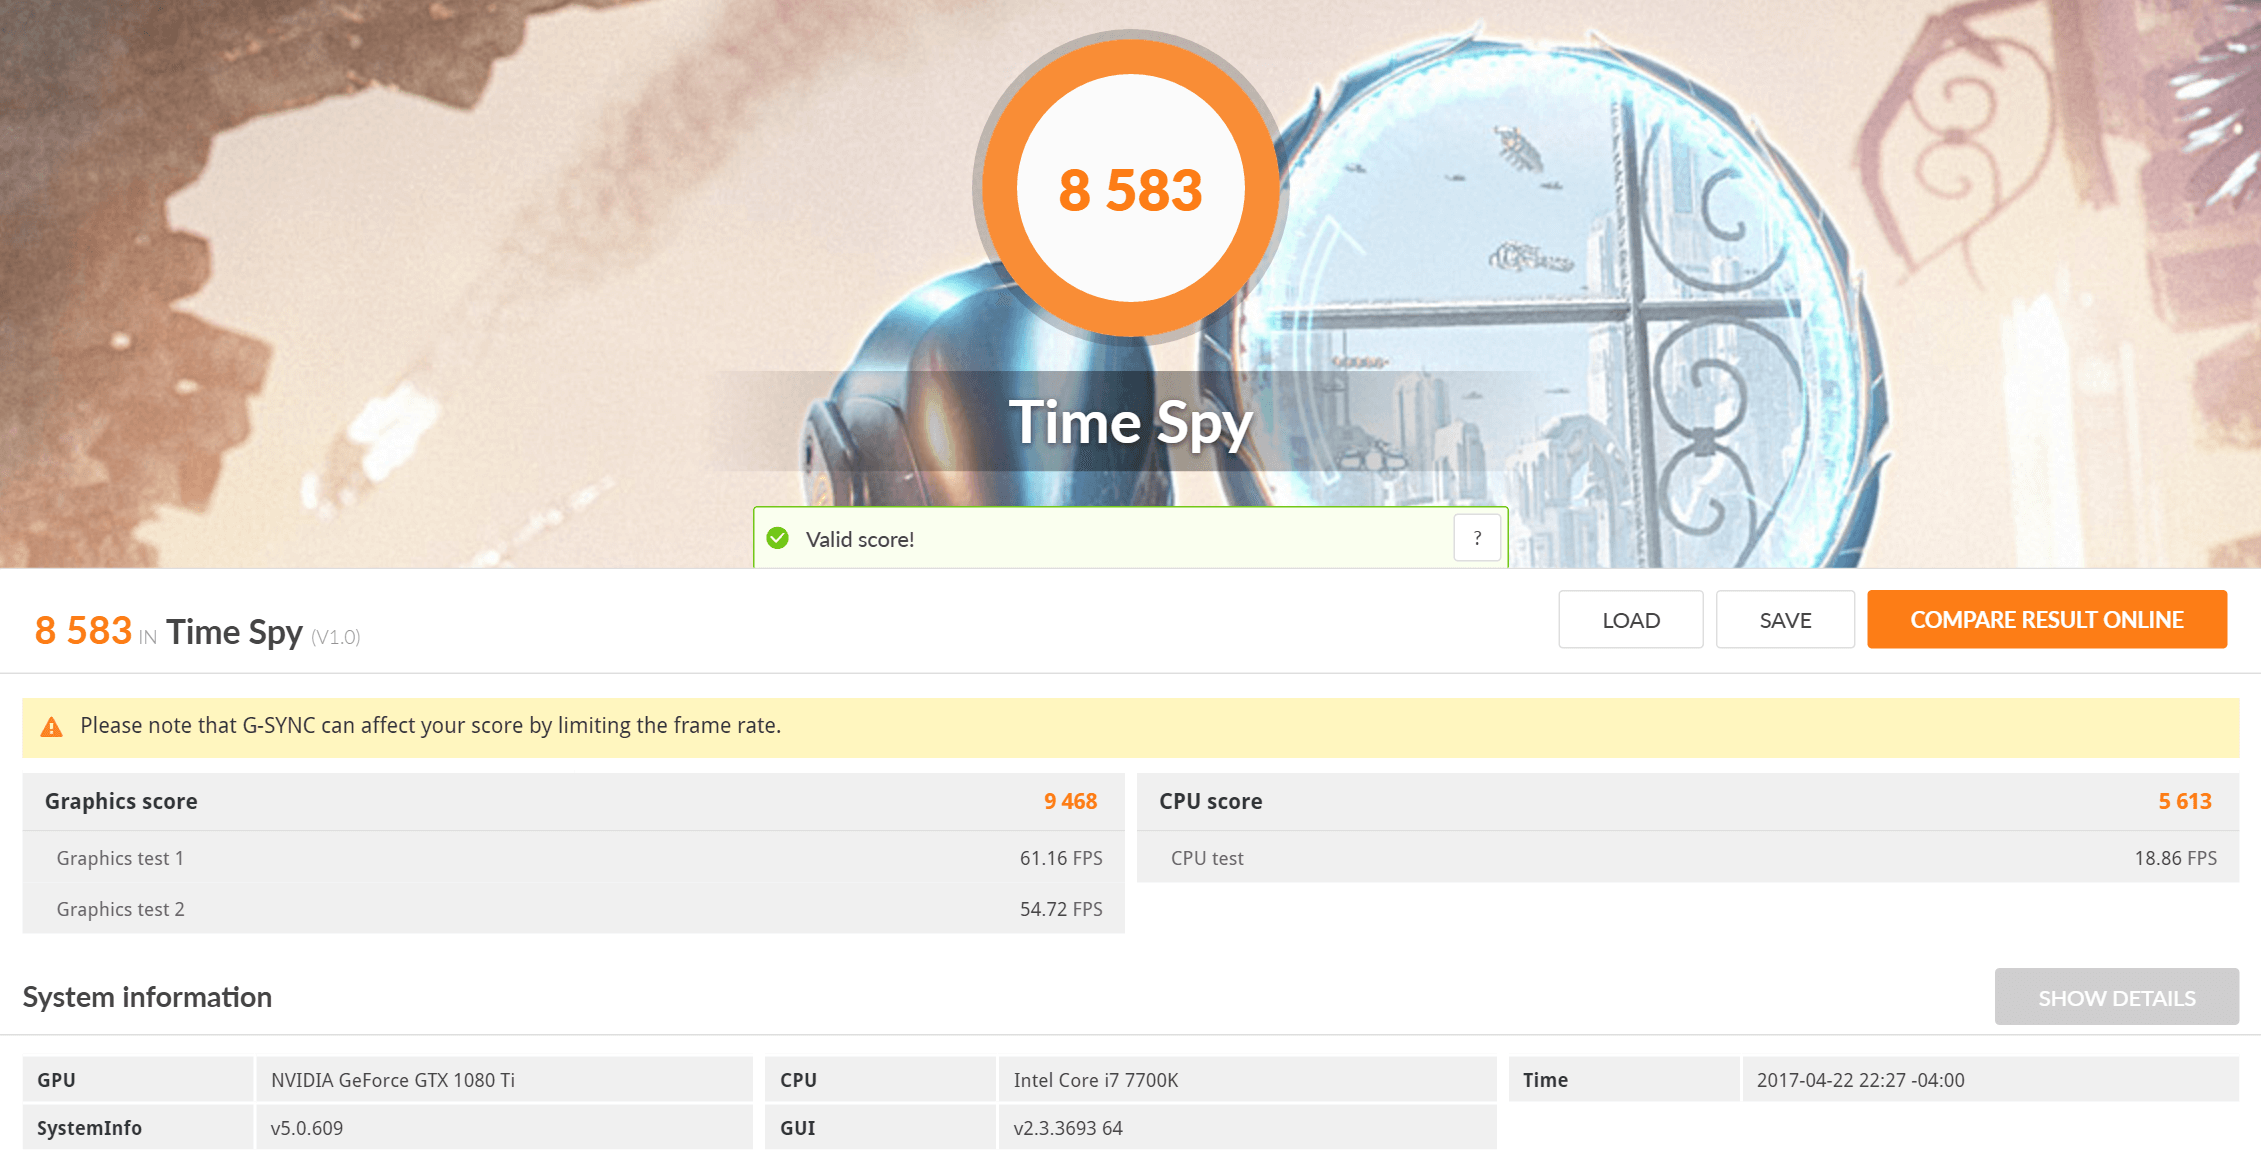
Breaking it down a bit more, we can see the individual Graphics score for both Test 1 and 2 as well as the CPU score. This is good information for a little later in the review.
One of the most grueling benchmarks that I have tested, that is not a synthetic benchmark is Metro Last Light. There could be many reasons why this makes cards perform poorly, poor optimization, high end graphics or a number of other things, and I do push it. For these tests, I pushed the resolutions a bit, unlike others because this is meant to be one of the highest end cards I pushed this card to 4K testing.
Let’s see if Metro Last Light performed well or smoked the EVGA Geforce 1080TI Founders Edition.

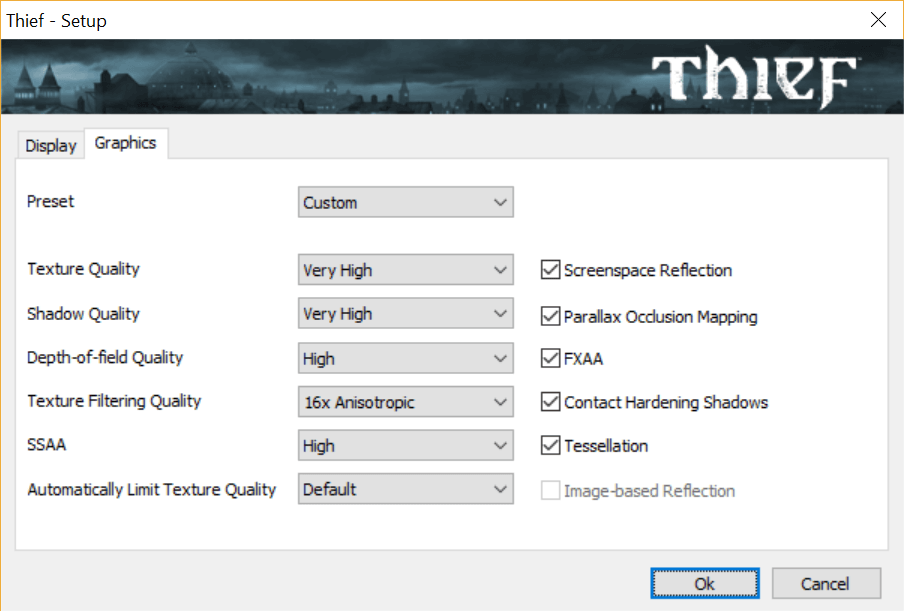
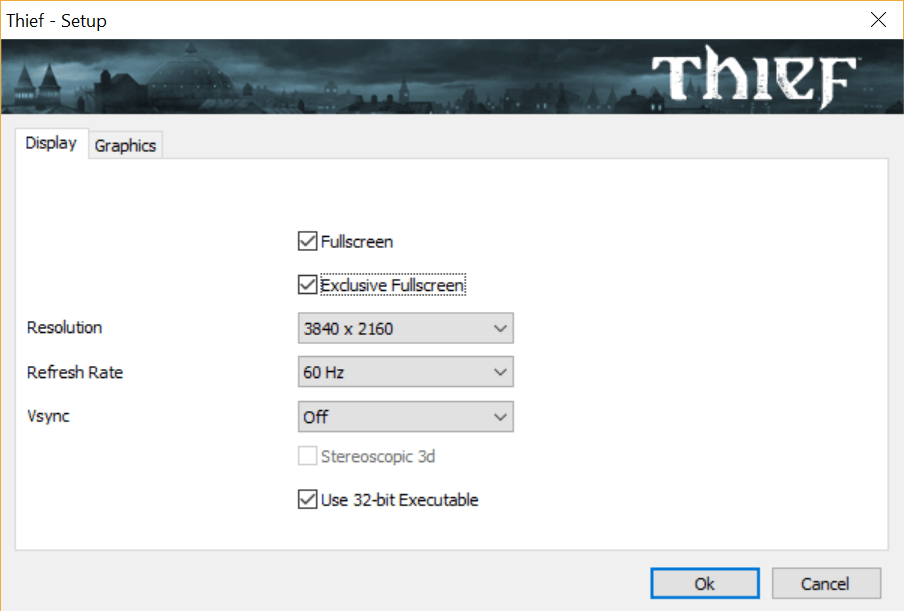
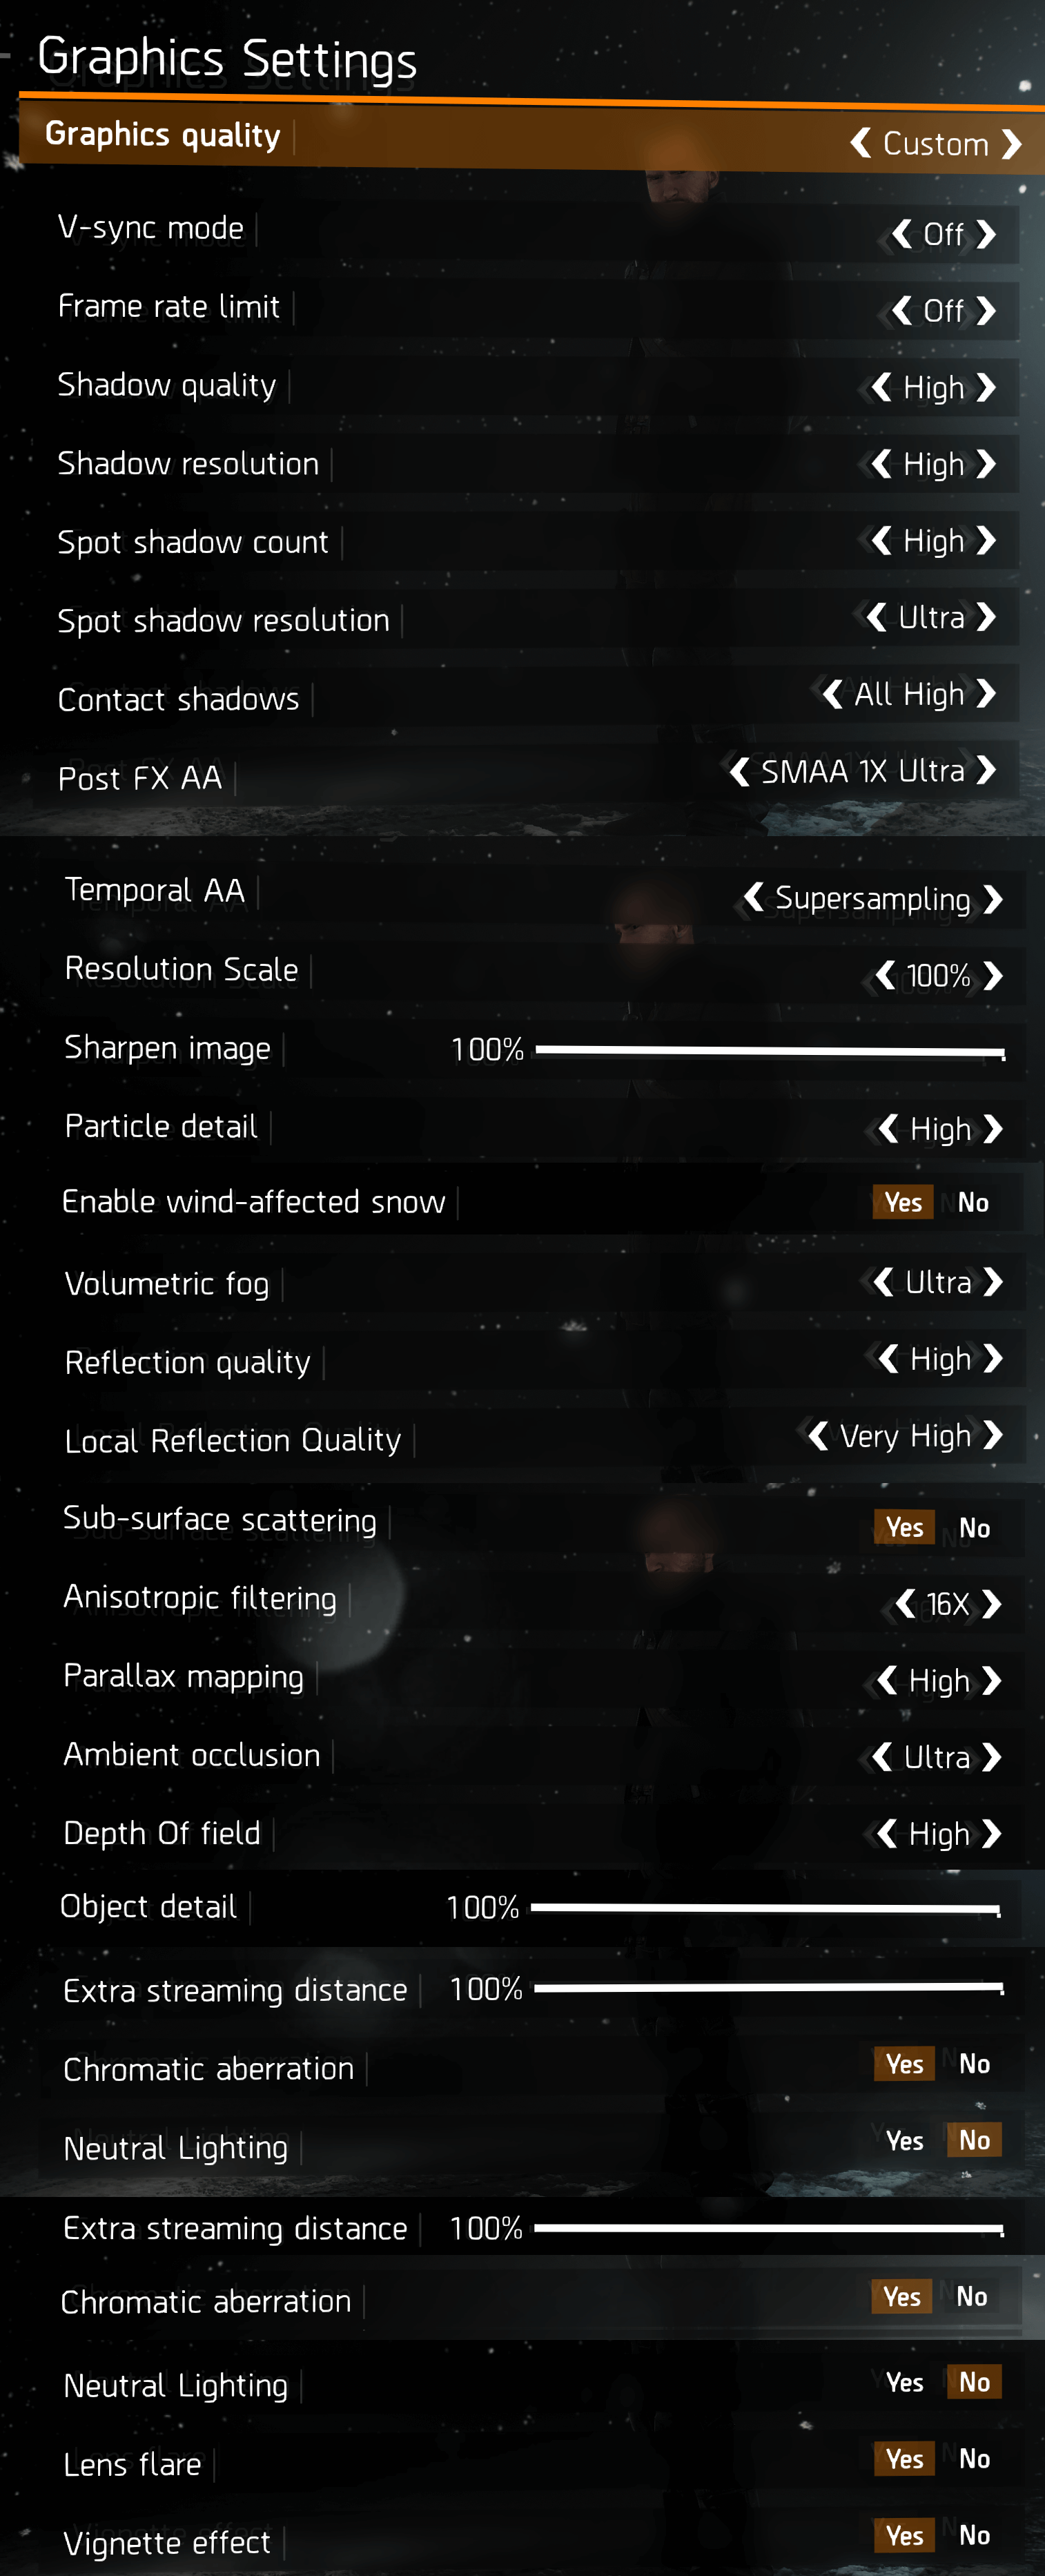
Throughout the benchmarks, I keep the settings the same only changing the resolutions. Here are the presets I use.
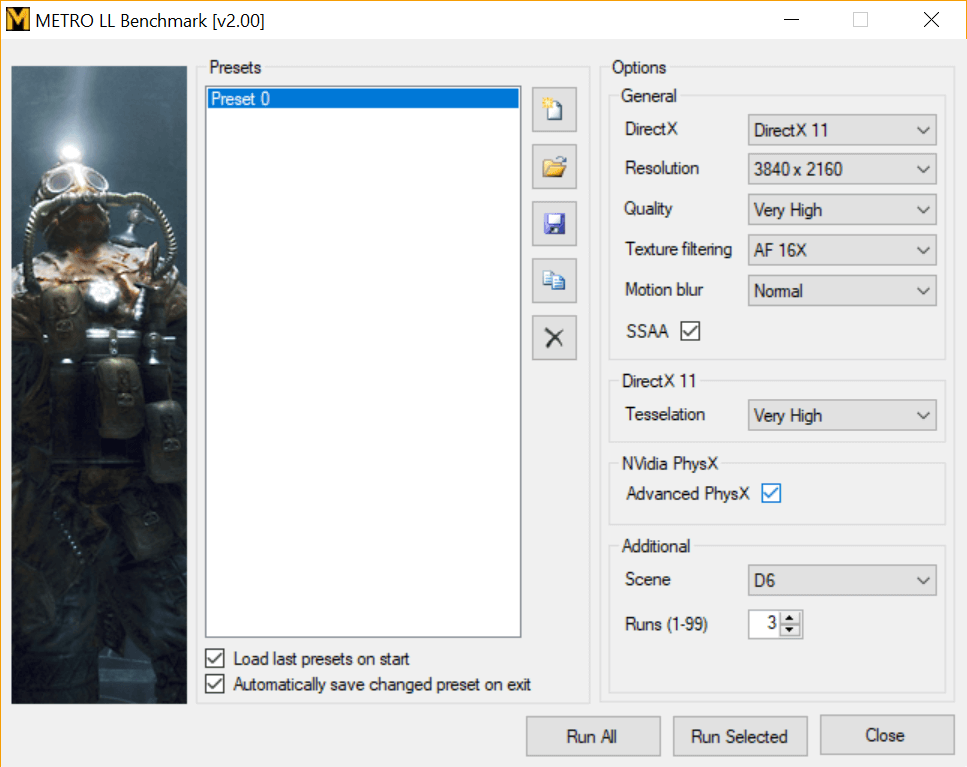
I will the show the results from all 3 presets below, 1920 x 1080, 2560 x 1440 and 3840 x 2160.
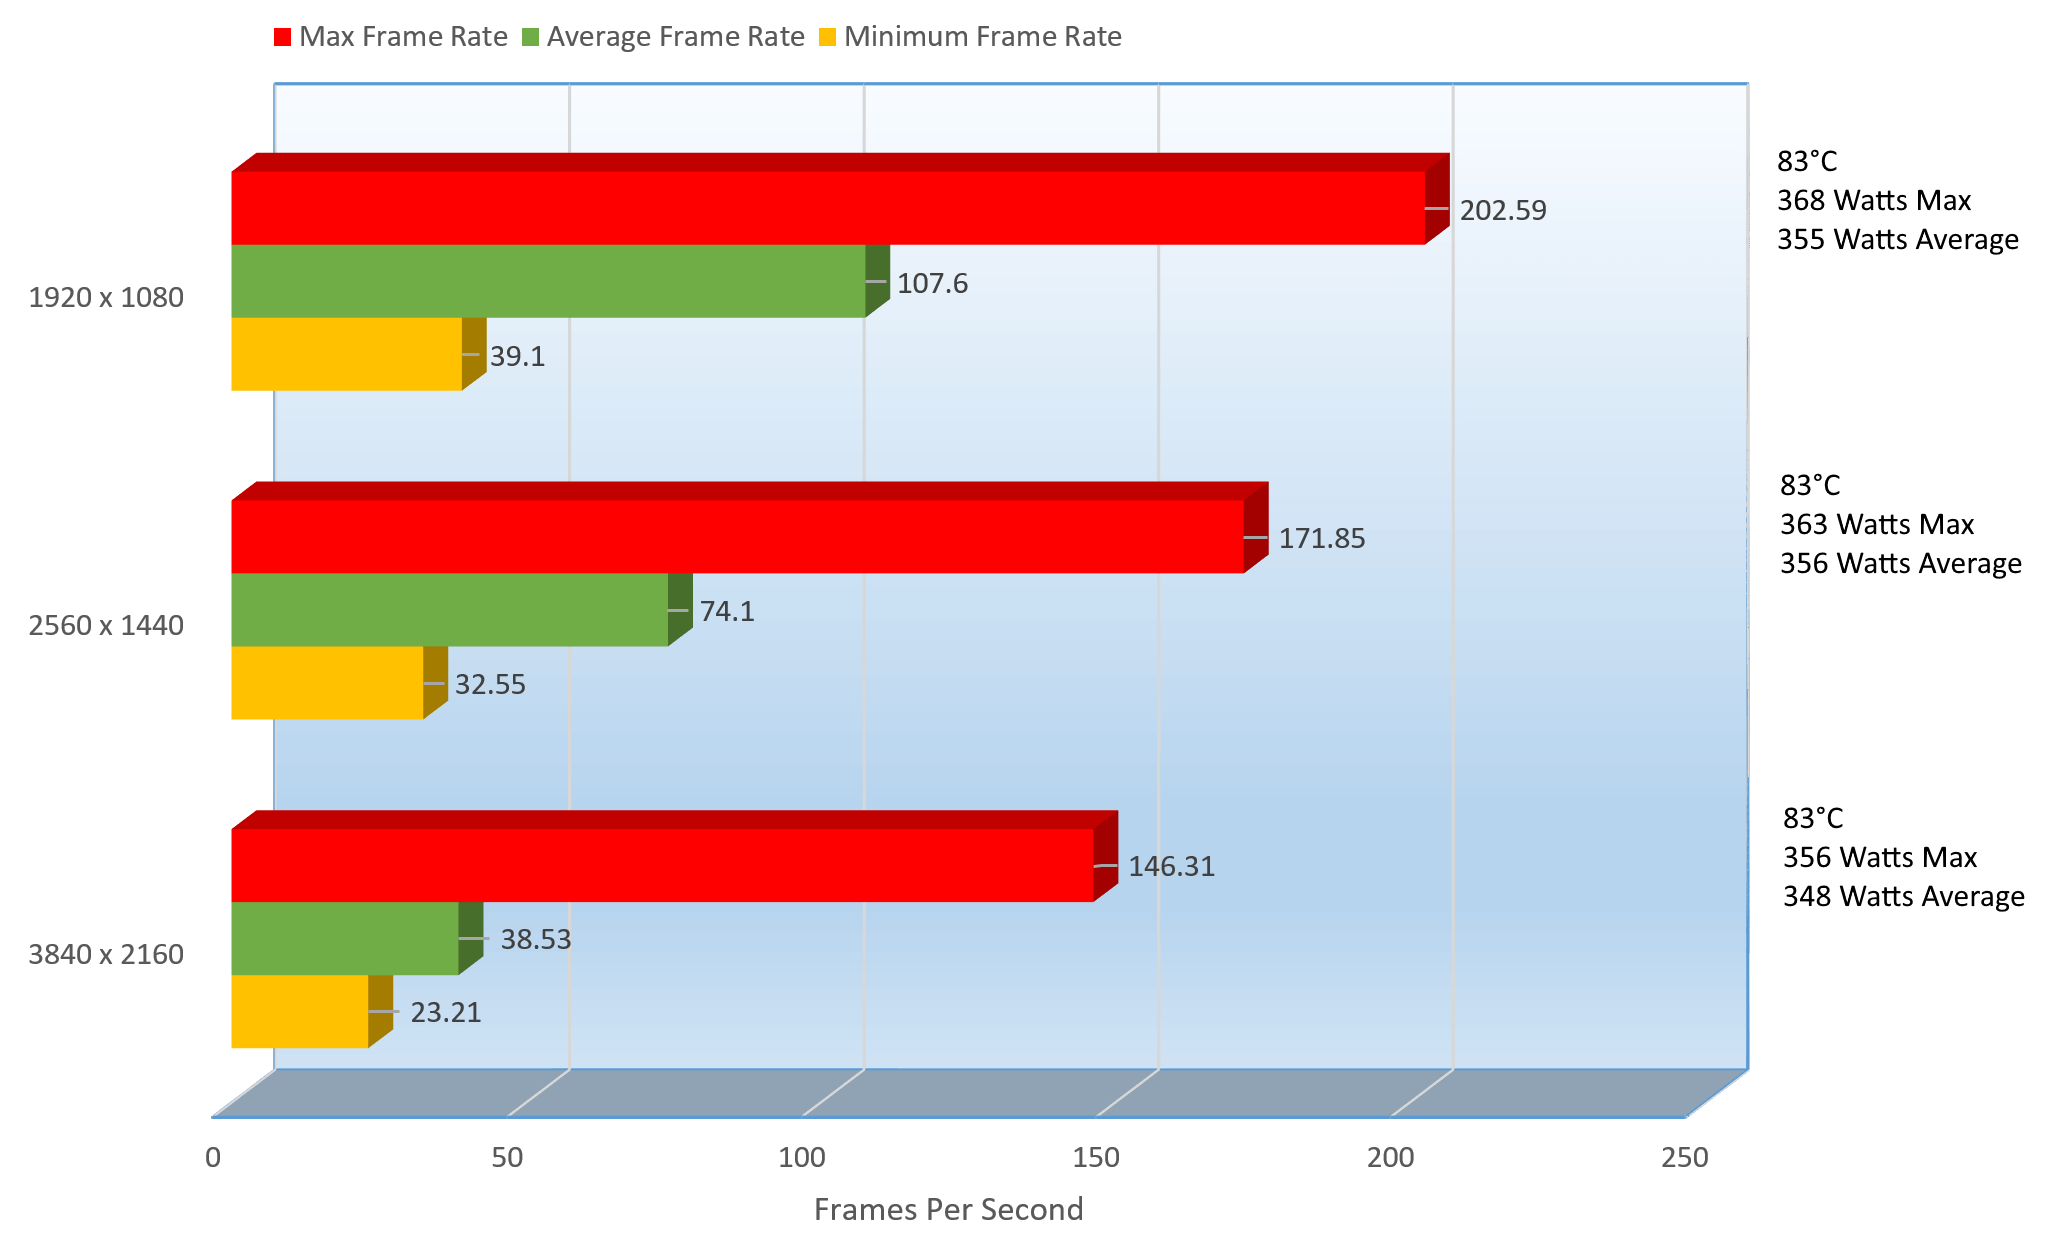
At 4K, it does look like Metro Last Light was chugging a bit a 38.53 frames per second but as usual, this would be incredibly smooth just turning down a little eye candy. Bringing the resolution down to 2560 x 1440, we can see a 48% improvement over 3840 x 2160’s score coming in at 74.1 frames per second.
At 2560 x 1440, we can see the temperature was the same 83°C but the Average wattage was slightly higher coming in at 356 Watts on average. Compared to that of 4K’s consumption of 348Watts, 2560 x 1440 consumed 2.25% more than that of 4K’s consumption. This does make sense though because since you would imagine the 4K setting would take more power, just because it would be more demanding, the 2K’s set actually did everything it was supposed to and was overly playable coming in at 74.1 frames per second.
We all want to hit or pass that magical 60 frames per second number, and while maybe I was not able to in 4K, it was more than capable at 2560 x 1440 with all of the eye candy turned up. Metro Last Light shows once again to be a great benchmark, but as these cards and driver sets improve… it may meet its day of reckoning soon.
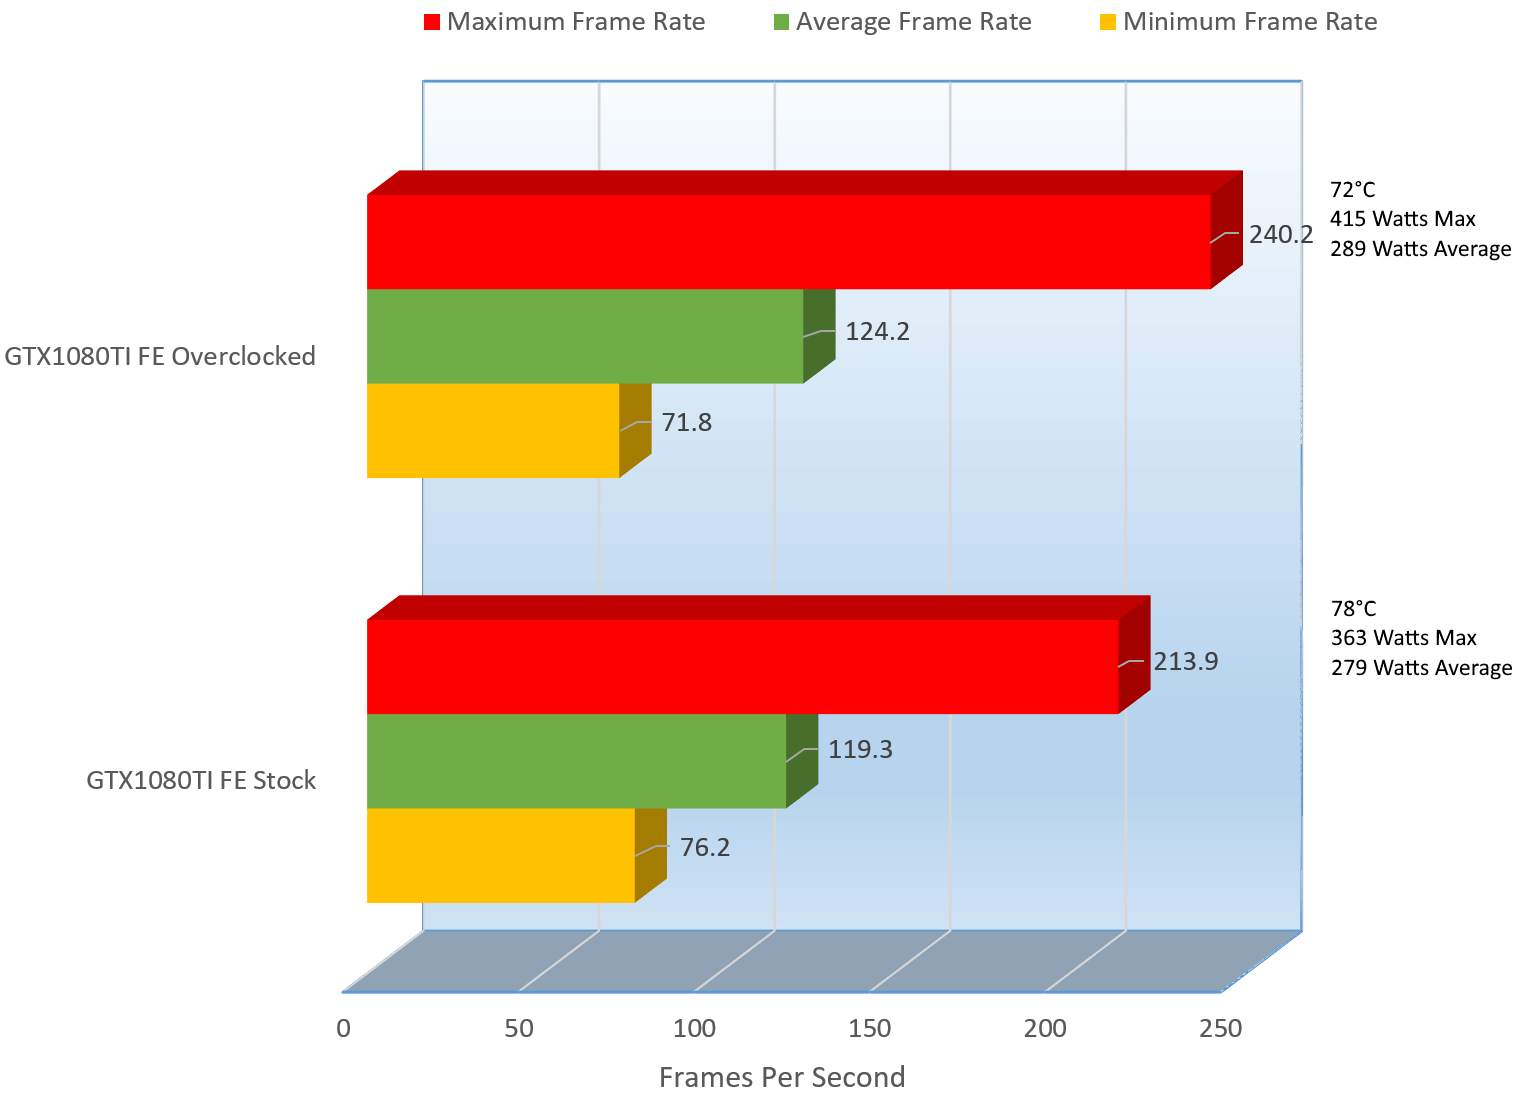
One though that tends to steal the spotlight is Thief. This game is starting to show its age, though many do still love it. Let’s see how well it performs on this card.

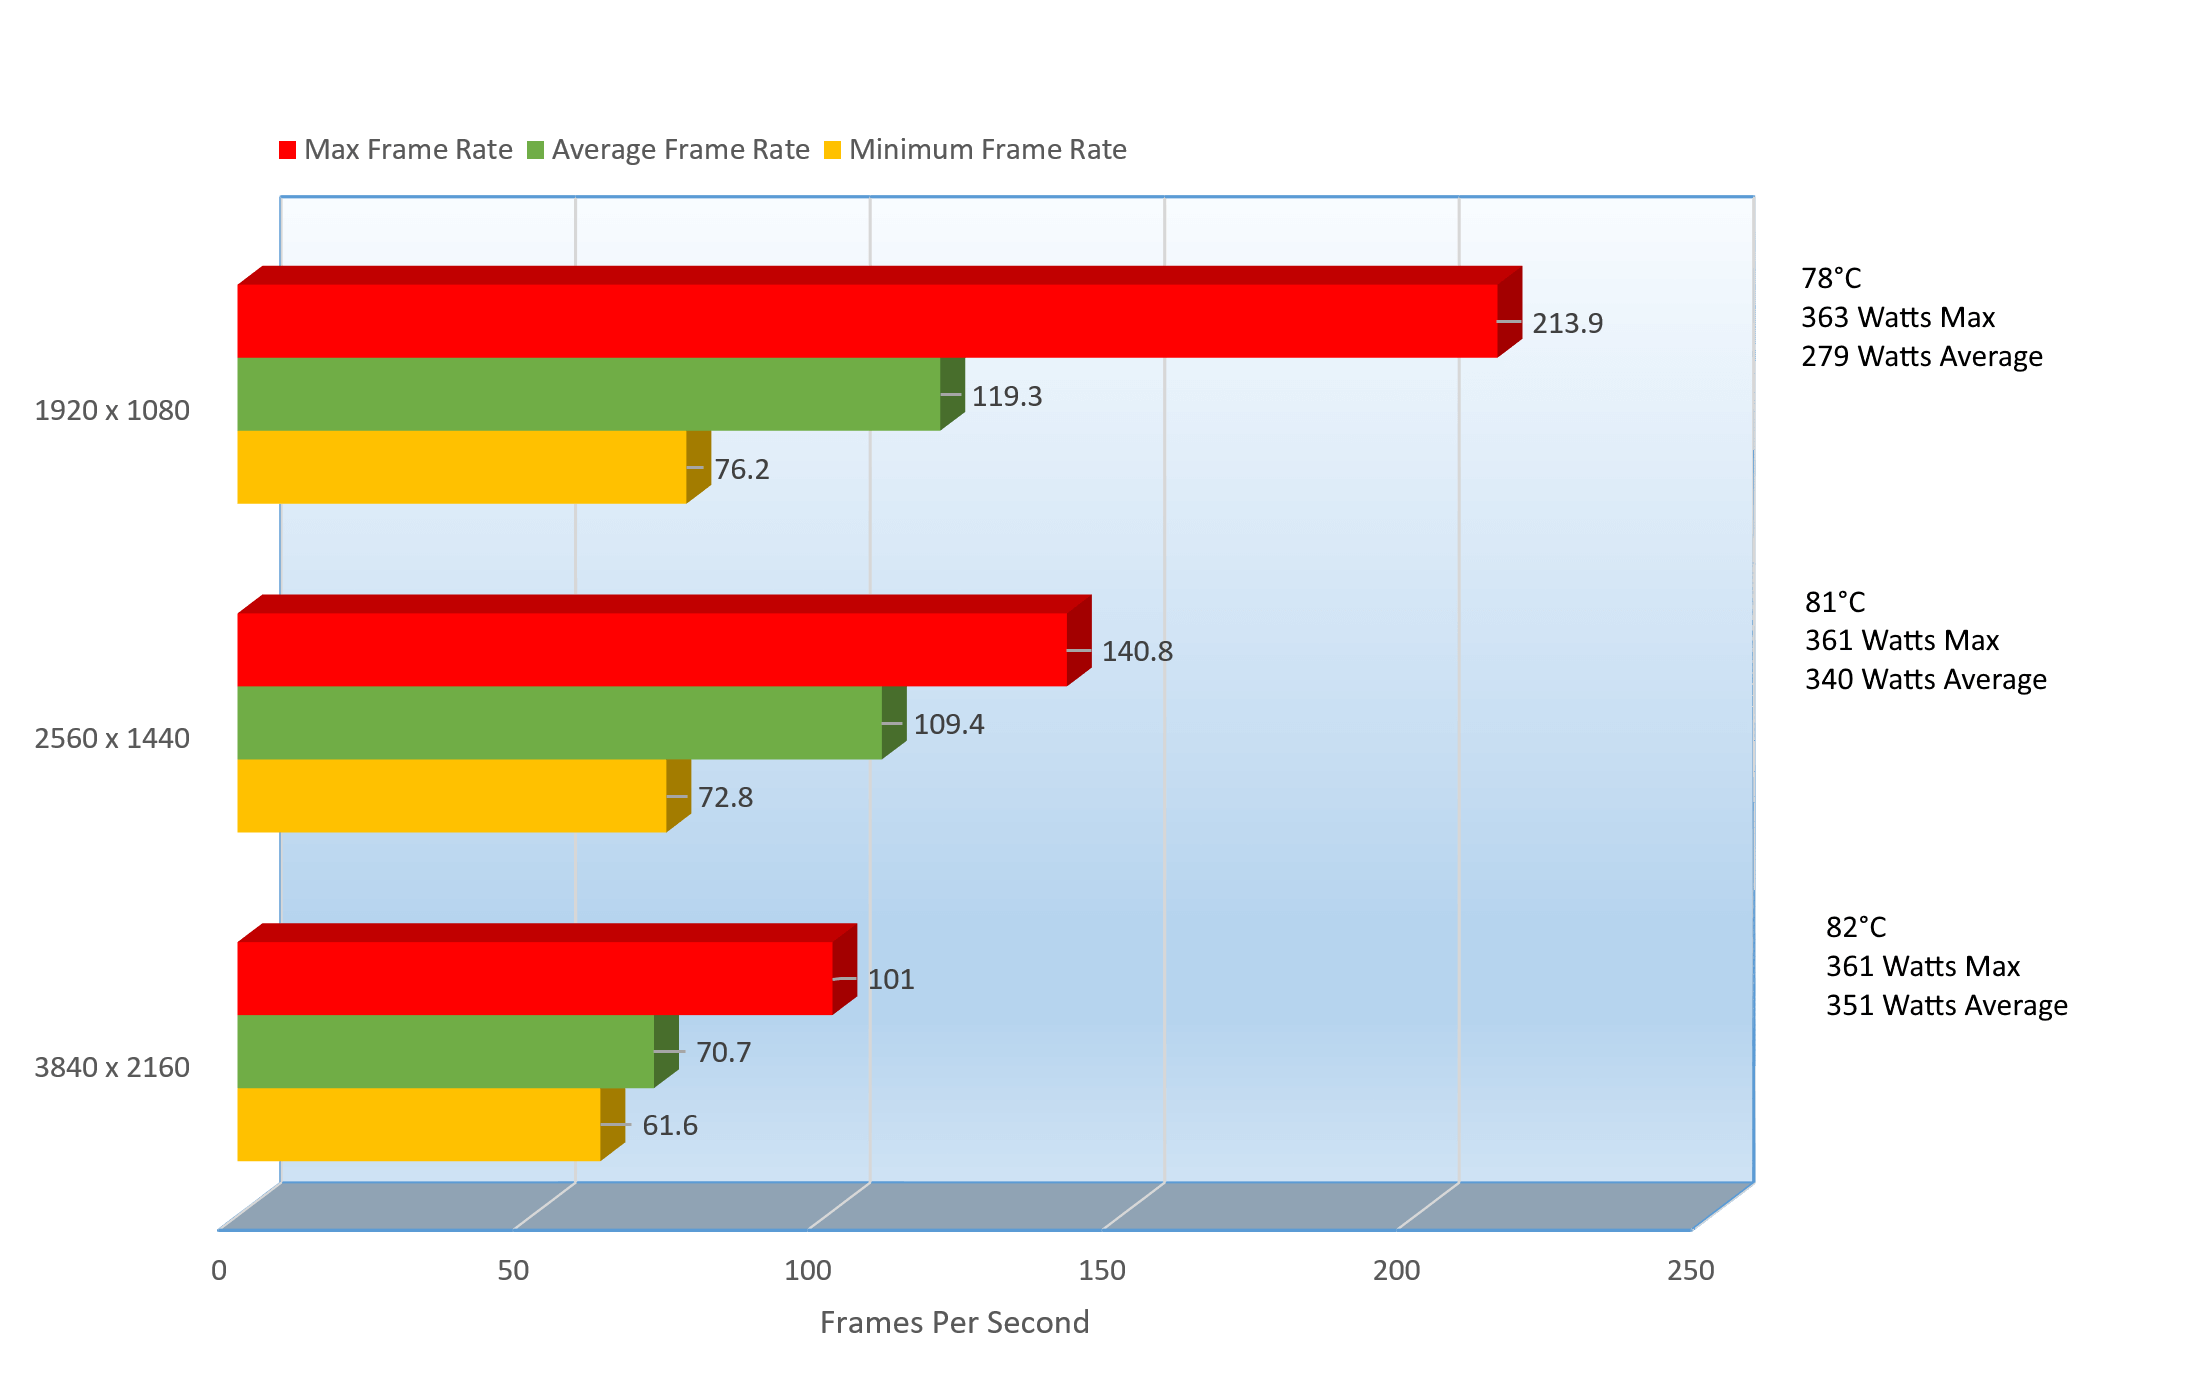
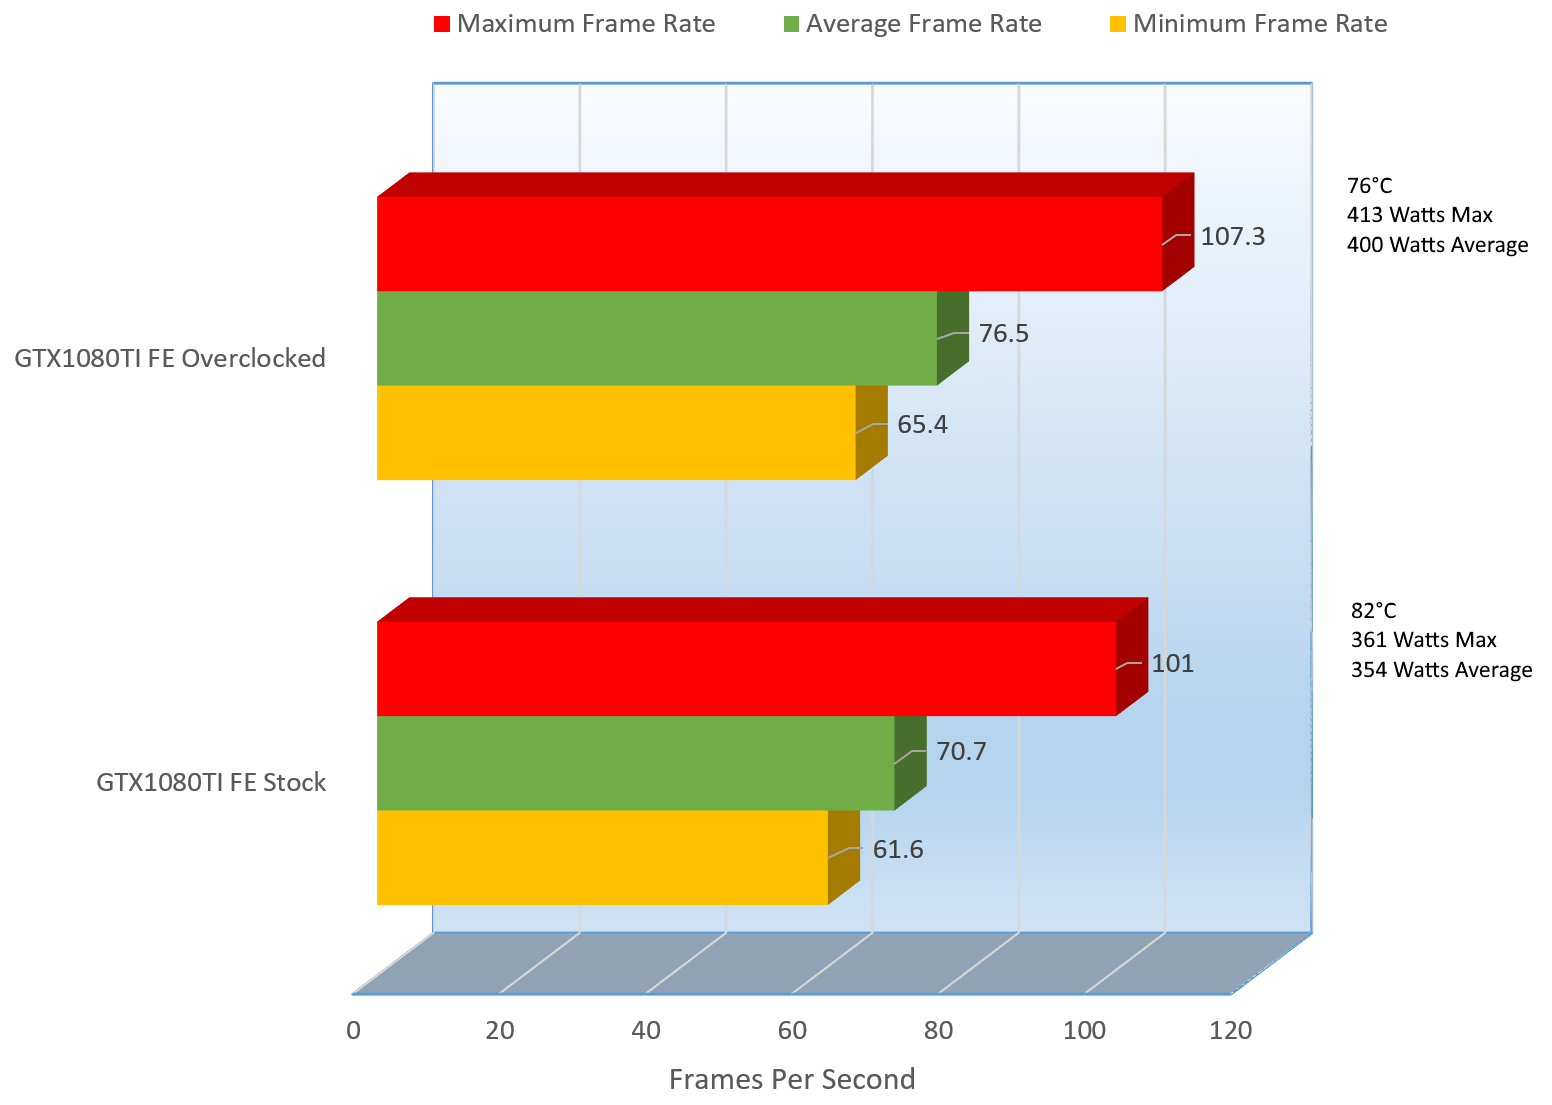
Thief actually did steal the show, but everyone noticed with these scores. With each test, even the minimum frame rate was well above playable. On 3840 x 2160, on average this card held its own with everything bumped up as you saw in the example above coming in at 70.7 frames per second and then bumping it down to 2560 x 1440 frames per second, a 35.37% improvement, though not like it was needed. The bump in resolution to 4K only consumed 1 additional watt though the average temperature went up 3.13%, not bad for such a high resolution.
At 1080p, you will enjoy this game thoroughly at 119.3 frames per second, only an 8.30% improvement over 2560 x 1440 coming in at 109.4. The lowered resolution did decrease thermals by 3.70% and the average power consumption dropped an impressive 17.94%.
Hopefully Thief did not steal the entire show though, Laura’s got something nice for us over at Tomb Raider.

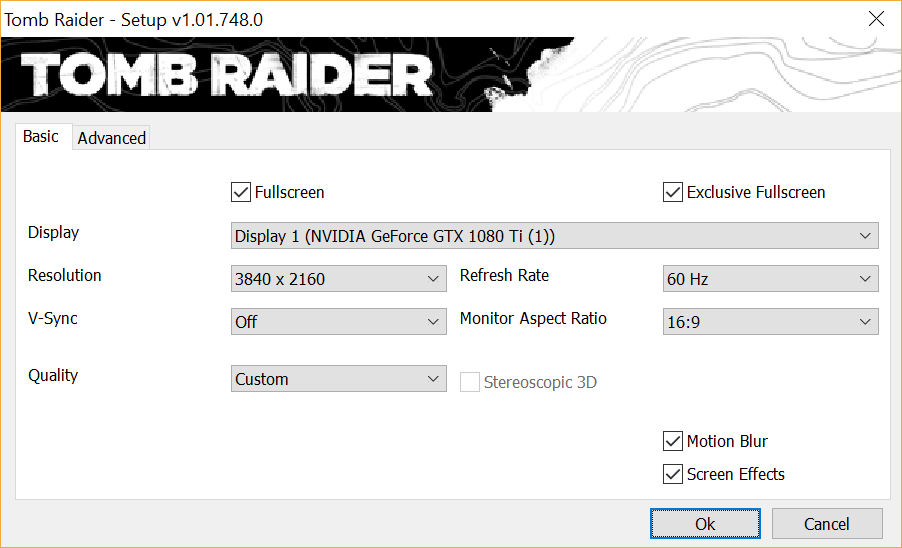
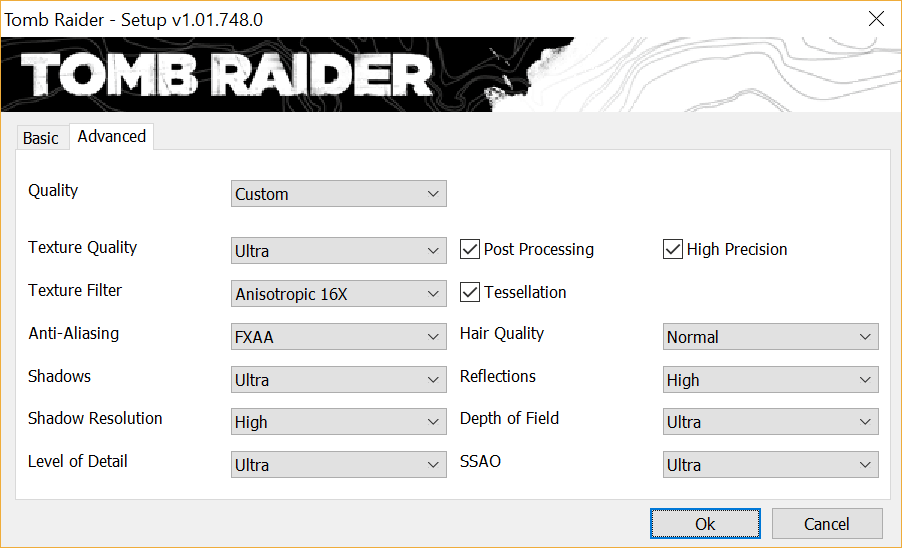
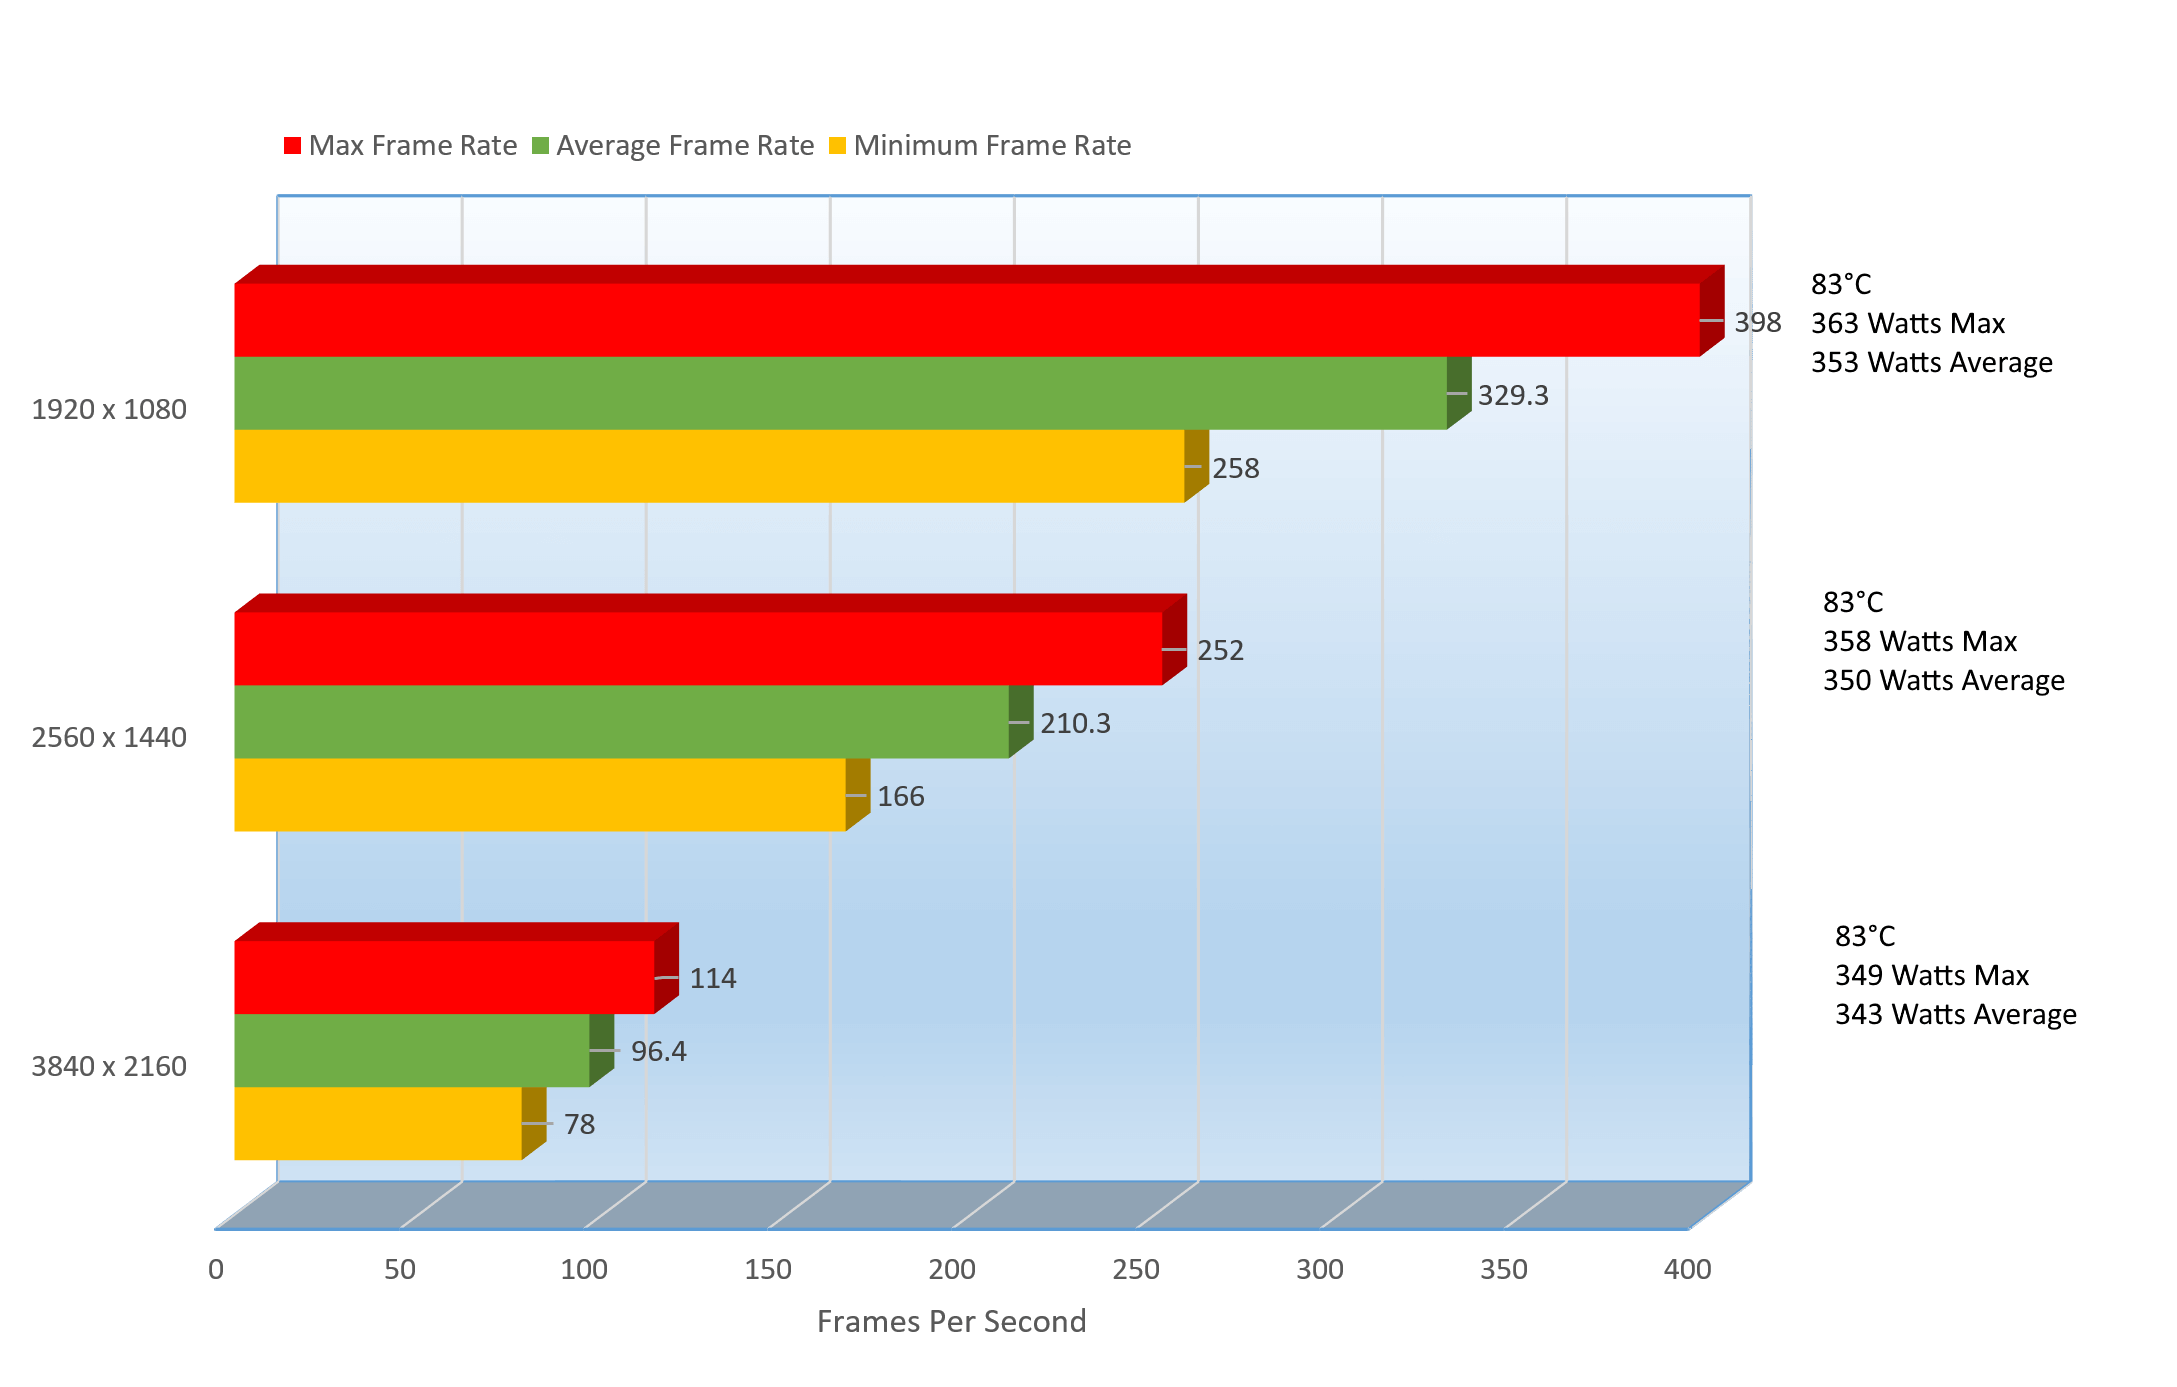
It seems that Laura Croft is a better thief than Garrett as Laura has stolen the show thus far. Top thermal ceiling here was 83°C. At 3840 x 2160, our average frames per second count was 96.4, which is great but at 2560 x 1440 there is a 54.16% increase in performance and with that only a 2% increase in power utilization from 343 Watts to 350 Watts.
Laura might actually be able to help us in the NYC in Tom Clancy’s The Division.

Here are the settings I used for The Division changing only the resolution each time.
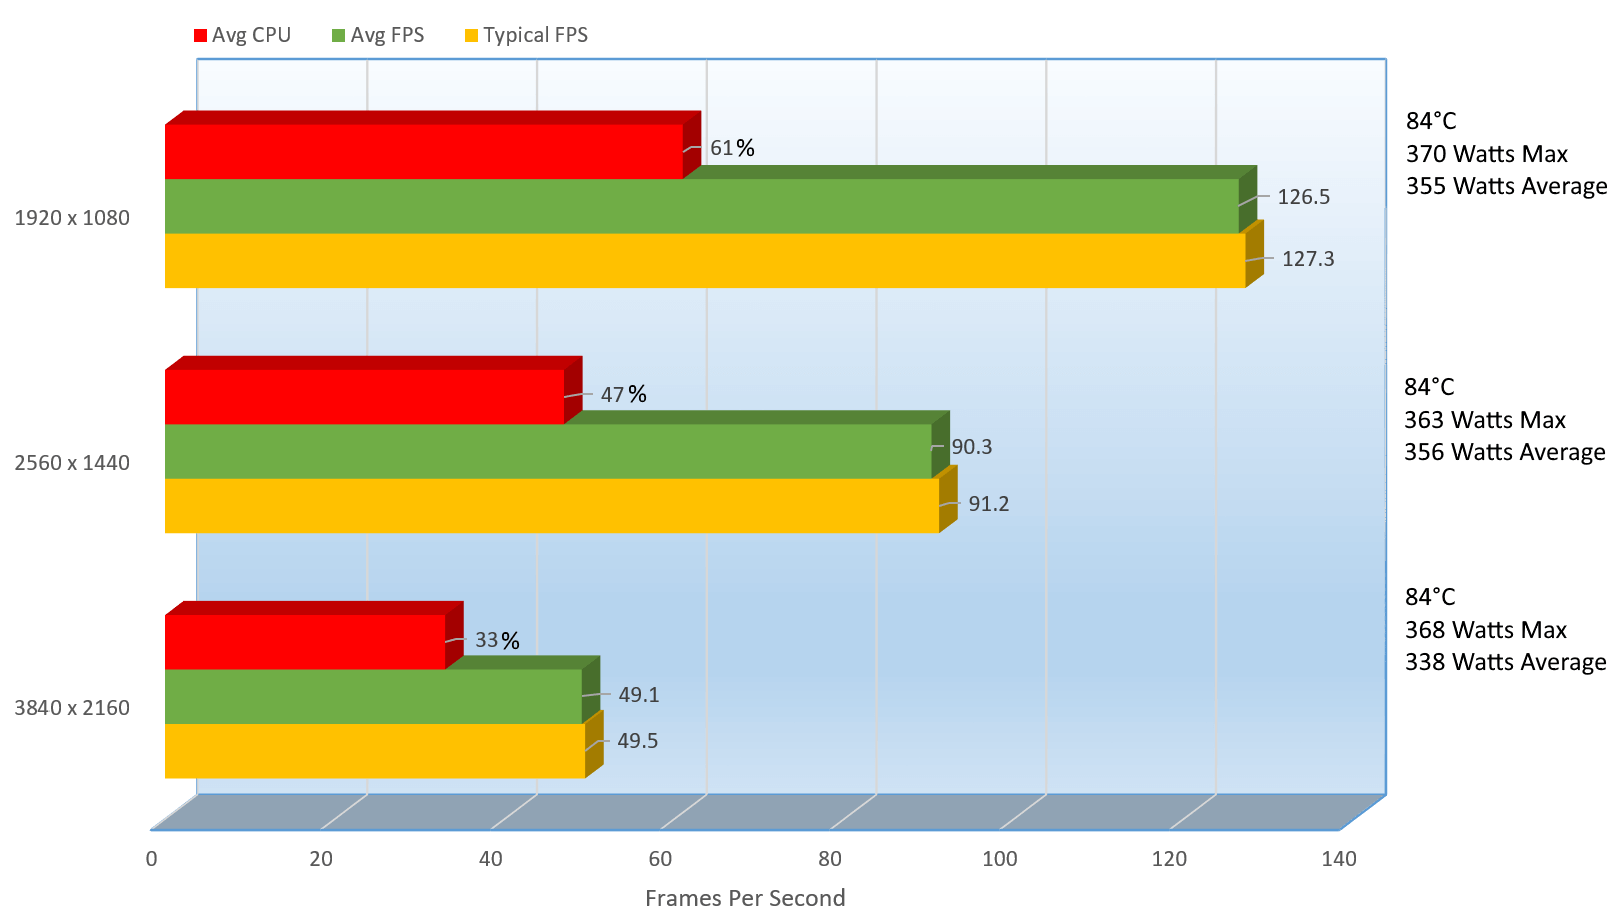
As we can see, The Division is optimized to take better advantage of the CPU than older games. Here we can see the average frames per second came in a 49.1 FPS at 3840 x 2160 and while it does sound a tiny bit low, it was incredibly playable. At 2560 x 1440 we had a much more playable 90.3 frames per second, 45.63% faster than that of 3840 x 2160 though with a 5.06% increase in power usage, not bad I would say.
If you notice, the temperatures never rose above 84°C and there is a reason. The maximum GPU temperature this card can handle is 91°C so it seems the 84°C is to protect the card from getting close to that 91°C, it’s not that far off. So when you see it hit 84°C, there is a bit of GPU throttling going on, but not by much and not affecting the performance by much.
I mention this of course not only to let you know, but because that will come up a little later in this review.
So a benchmark is cool, and can be exciting, but nothing is more exciting and fulfilling than actually playing a game. In this next page, I will run through a few games at 3840 x 2160.
[nextpage title=”Gameplay and Performance”]
While reviewing is a very time consuming and frustrating hobby at times, these are the times I look forward to in between. In this page, I get to play some games to show you just how well this card performs. Here I will be playing Grand Theft Auto V, Battlefield 4, Battlefield One and Tom Clancy’s The Division all at 3840 x 2160 and yes, I will show you the settings.
Not too bad, anywhere from the upper 40’s to the low 60’s. Need some more action, let’s check out Battlefield 4.
Sadly there was no one really on the server, but I did run around a bit, lots of shooting and some driving as well. With everything turned up, we saw frame rates from the upper 50’s to the upper 70’s. Smooth gaming, but if this a little too futuristic, let’s go back in time to Battlefield One.
In Battlefield One, there was tons of action and here we can see frames per second in the upper 40’s all the way up to the 80’s.
The Division suffered a bit at everything maxed out from the 30’s up to the 50’s.
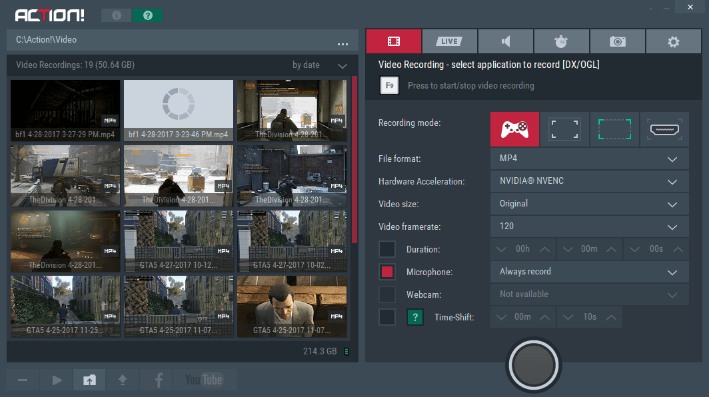
The problem with recording is that the framerate will drop while recording, anywhere between 10 and 30 frames per second. The reason this occurs is the card you are playing the game on, rendering all those high-end graphics is also doing the processing of the video recording. For all of these recordings I was using Action! Screen Recording software utilizing Action!’s NVIDIA NVENC Hardware Acceleration feature.
For those of you that want a little more, check out the next page where I overclock the EVGA Geforce GTX 1080 TI Founders Edition and then compare the results with the base results.
[nextpage title=”Overclocking Performance, Benchmarks, Temperatures and Power Consumption”]
If you do need to squeeze out some more FPS, this page is for you.
Overclocking in general is not easy and is incredibly time consuming taking hours, days maybe even weeks to get it just right. Getting it just right means you have to make sure that there is no tearing or artifacting while the benchmark is running and of course no freezing or bluescreens.
I will show you my settings but just remember, not all cards overclock the same, even if you bought the same card. These overclocks are by far not the farthest I could push it, but I wanted to get this review out in a timely manner so just use these as a reference.
To start off, let me show you GPU-Z’s before and after screenshots and I highlighted the improvements.
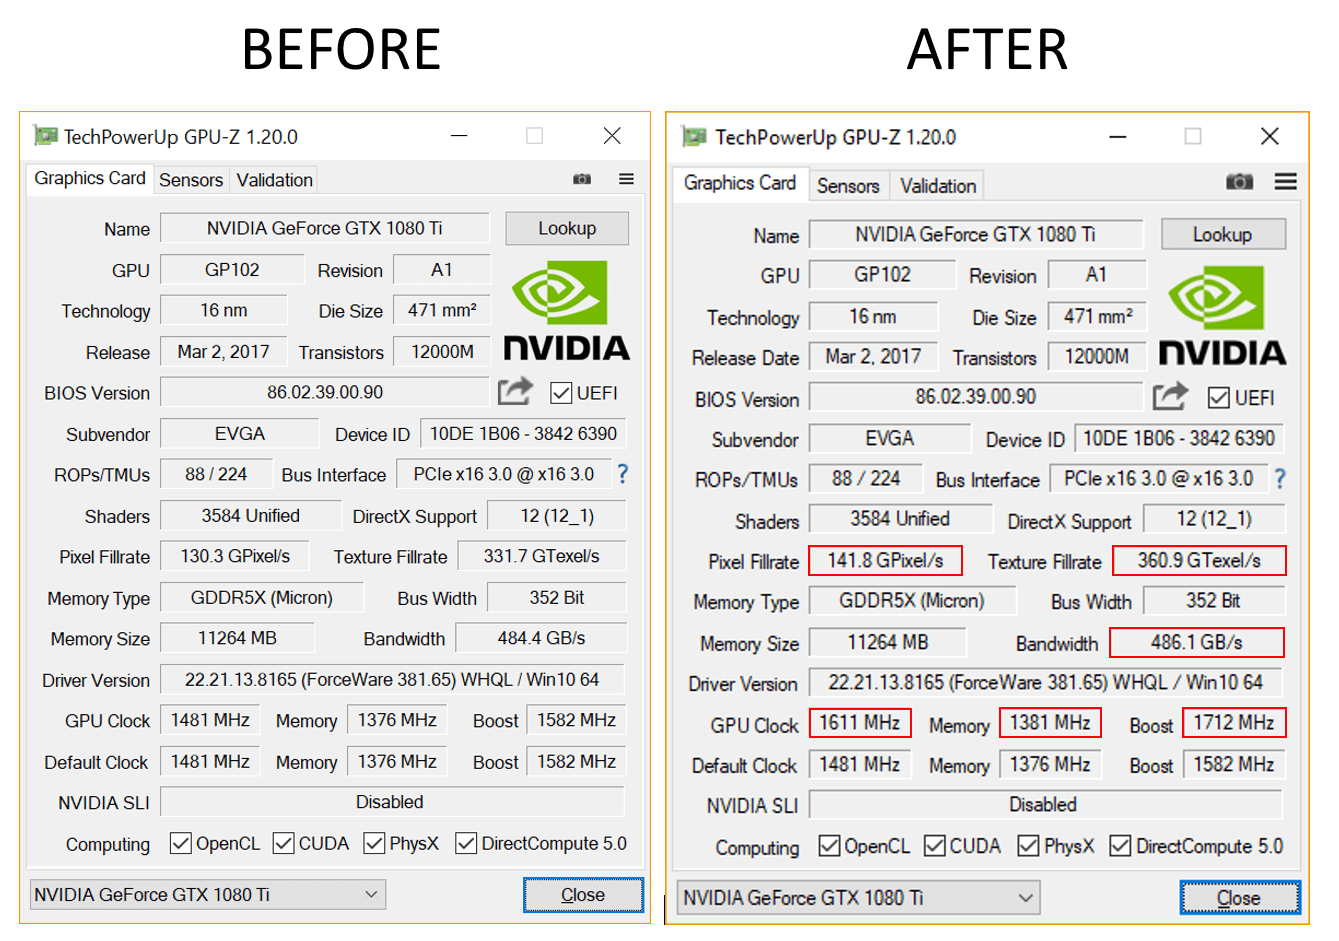
I spent a lot of time on the GPU and left the memory behind, but you can of course go higher.
I overclocked the GPU by 130Mhz and the memory only by 5Mhz, but it does make a nice difference you can see below.
To overclock, I used EVGA’s Precision X OC, like GPU-Z I will paste below a before and after screenshot.
BEFORE

AFTER
Using the “Curve” button

Which brings up the Curve menu
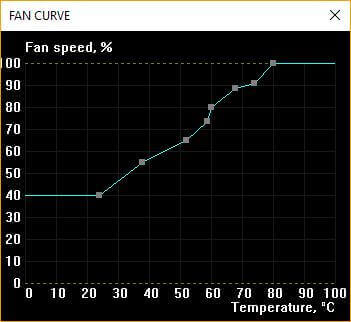
With that, you can set your curves on how you would like the fans to ramp up once the heat rises.
Clicking the Fan Curve button actually brings up this menu and the Fan curve menu, but I won’t go into this one right now, I will a little later in the review.
![]()
You are also provided 10 different profiles to save your work to. The way I used it was I overclocked a little, to where it was stable, then I saved it as profile 1. Using Profile 1, I overclocked a little more till it was stable, then I saved it as Profile 2. I used the same method each time till I reached profile 4.
Now on to the benchmarks.
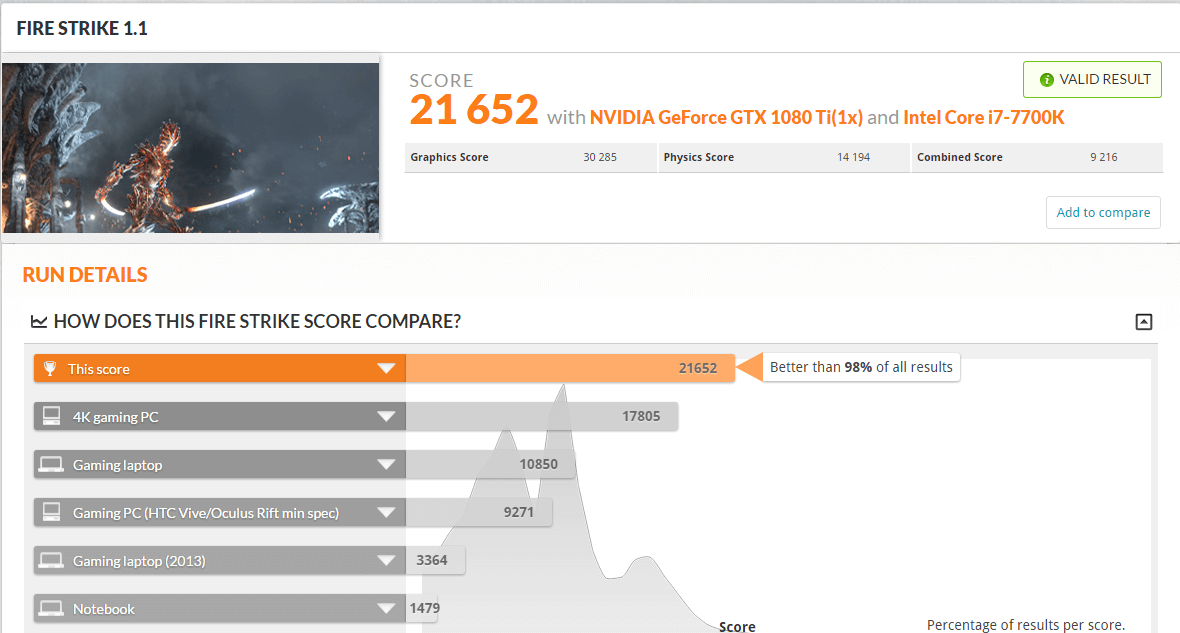
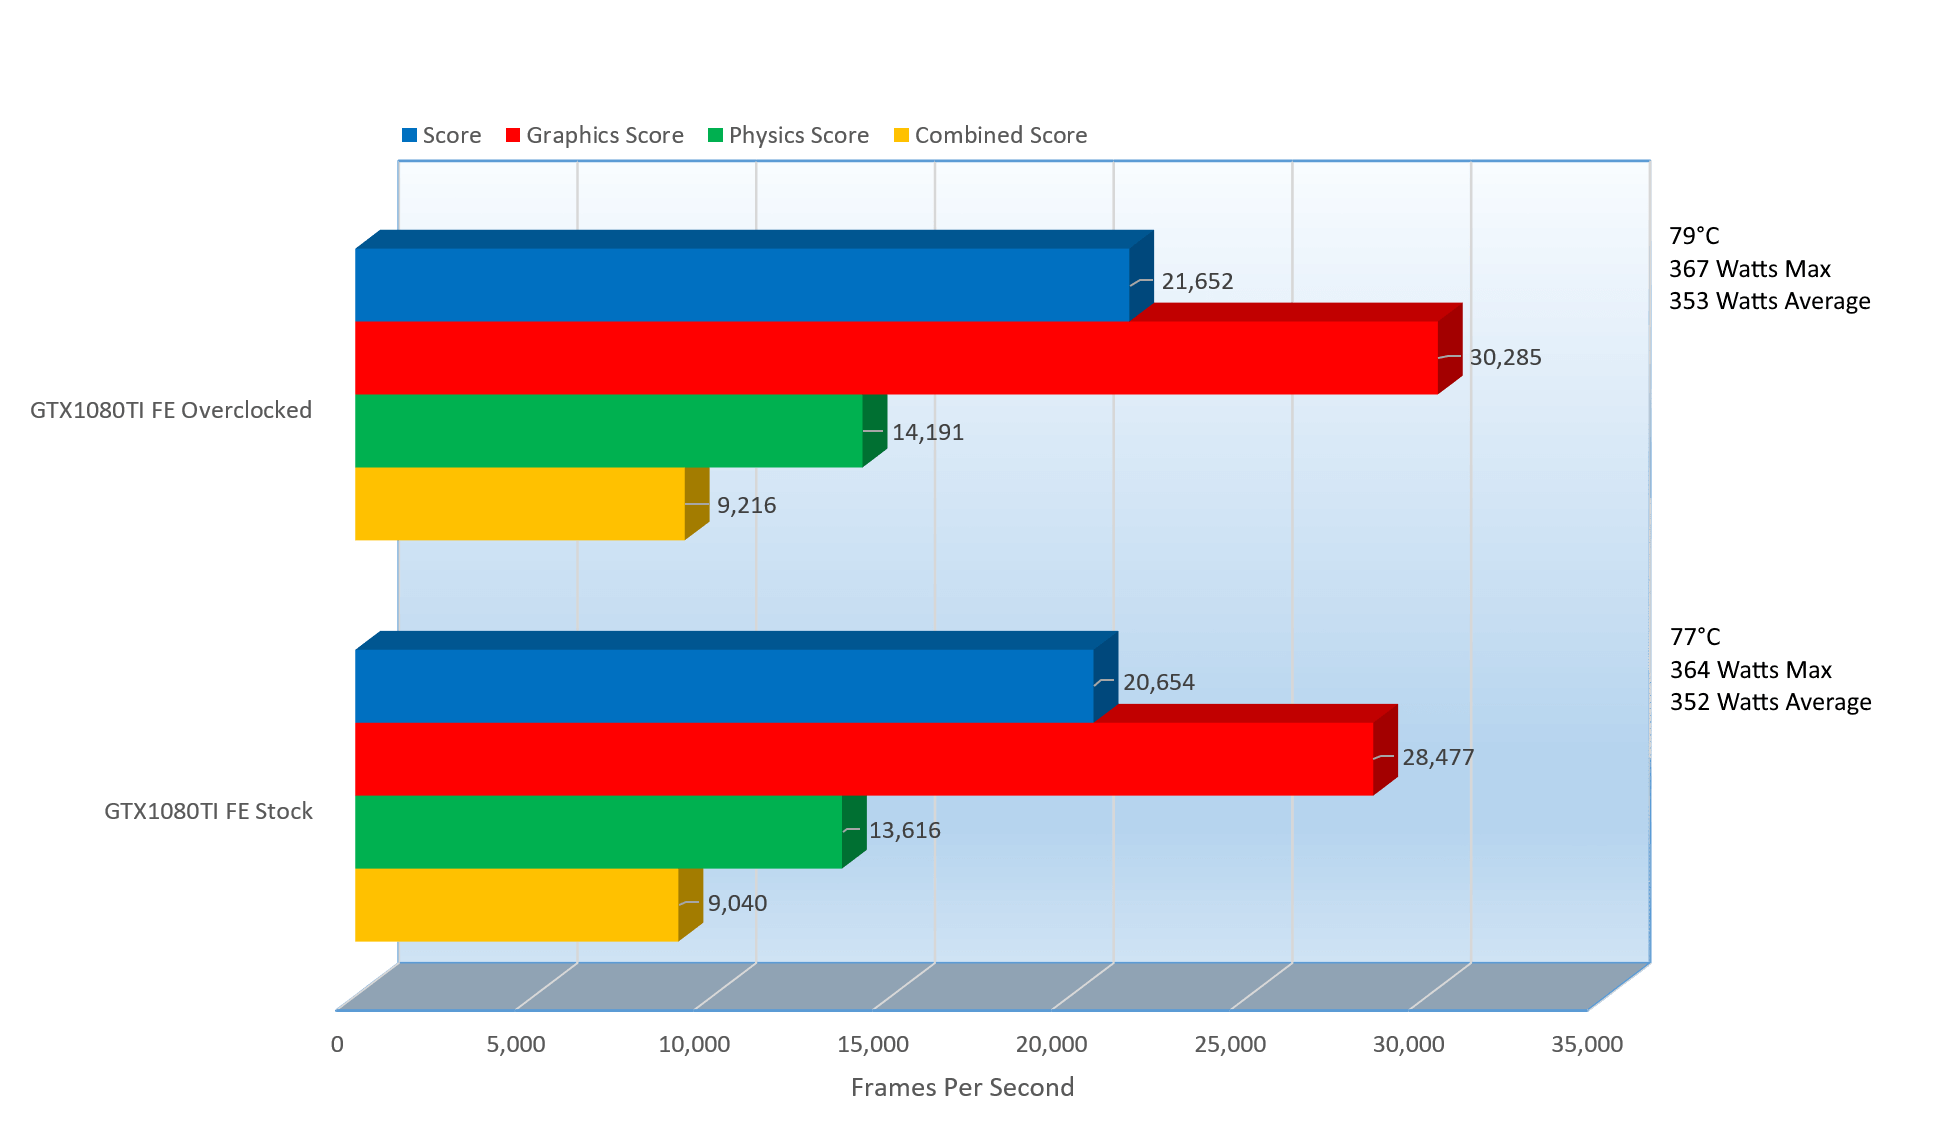
So on the comparison, on the initial bench, we received a decent score of 20,654 and the overclock gave us a score of 21,652. While it looks amazingly high, there was only a 4.61% improvement and with that only a 2-degree bump in temperature. As for power, we only saw an increase of 0.29%.
Breaking down the results more, we can see that there was a 5.97% improvement in performance on the Graphics score from 28,477 up to 30,285. Keeping up with that improvement, the physics score increased by 4.051% from a decent score of 13,616 to 14,191. Lastly, the combined score was only bumped up 1.91% from 9,040 to 9,216. So all across the board we saw an improvement with only a slight overclock. Let’s see what in store for our future in Time Spy.

I need to start it off by saying, if you remember the initial results, they were only 93% better than all other results, but this tiny but in speeds gave us an extra percentage up to 94% better than all other results. Please remember, many if not all other results have the CPU and the memory, the physical DDR4 overclocked as well, everything here aside from the GPU and the negligible GDDR5X speeds are overclocked here. On to the comparison.
For the longest time it seemed people were trying to get the highest 3DMark score, to get to that top and now people are fighting to get the best Time Spy score. We’ve already climbed 1% on this tiny overclock, imagine what more can be done with a CPU and Memory overclock and some more attention to the video card, you can easily pass 10k, get some LN2 in there and you can even hit the famous K|NGP|N’s score… well maybe not but you can try. As of writing this review, K|NGP|N’s score was 32,089, but he is running these cards in Quad SLI.
The main Time Spy score here went from a decent 8,583 to a nice 9,146, that’s a 6.13% improvement. The biggest improvement here though was the Graphics score, that come up to a 10,277 from the prior score of 9,468, a 7.87% gain. Now the bad part was the Average wattage went up 12.53%, though oddly enough the temperature dropped an almost equal 12.20%. Not incredibly odd that the temperature dropped since we did bump up the fan curve.
Ok, now back to the game benchmarks.
For the games, we are going to break the result sections by resolution so that we don’t have a microscopic diagram. We will start off at 1920 x 1080.
1920 x 1080
With this tiny increase, we see a 4.96% increase in performance. Even though the increase was slight on the average frame rate, the see the Max wattage increase greatly and the average wattage increased by 7.31%, with the fan curve we dropped the temperature by 8.43%. Any decrease in temperature is welcome.
Let’s see if 2560 x 1440 does any better.
2560 x 1440
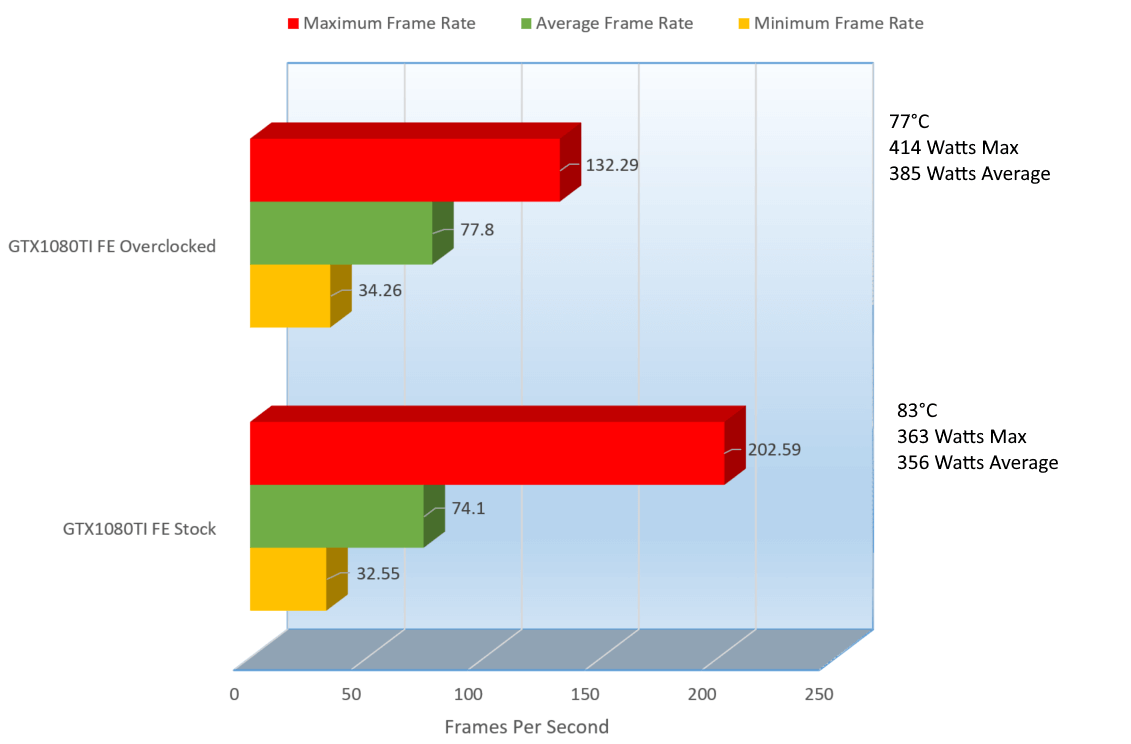
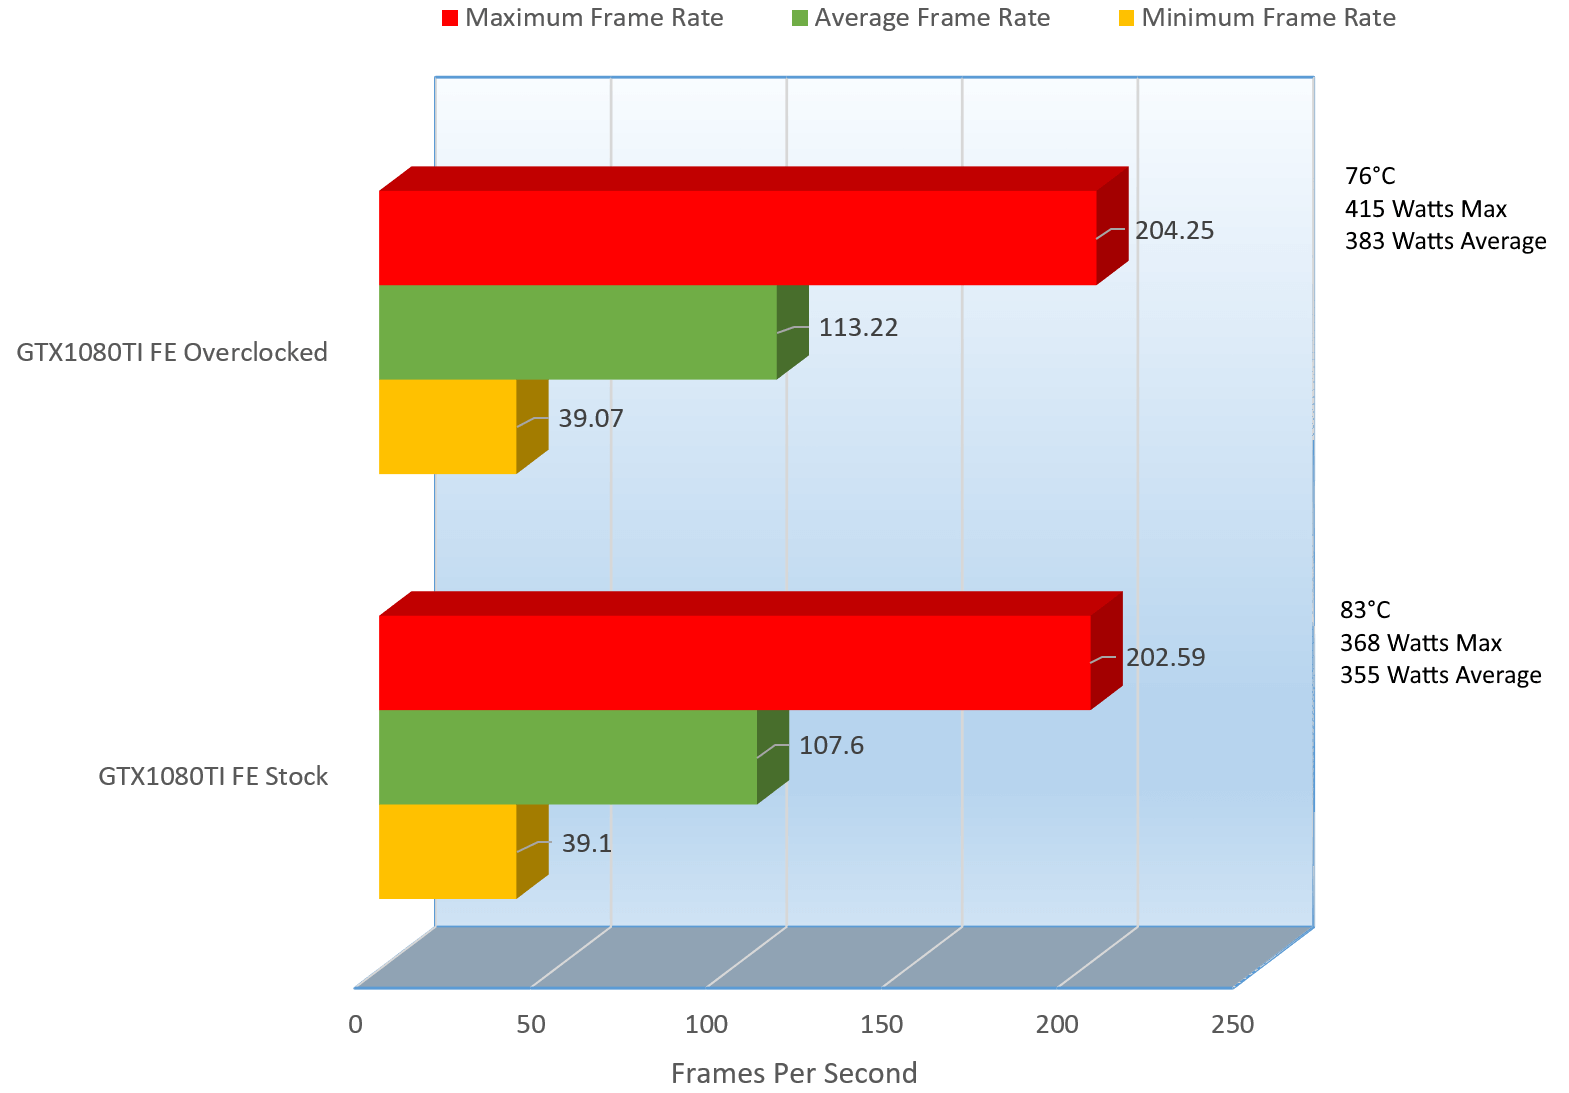
Here we can see there was a frame rate gain by 4.75% from 74.1 frames per second to 77.8 frames per second. You might notice that the Maximum frame rate on the stock is actually 34.70% above that of the overclocks 132.29 frames per second, but please remember while the Max is a nice to have, that is literally a blip of performance. By blip I mean, for a split second the score shot up to 202.59 then shot right back down to let’s say somewhere in the lower 100’s.
With that bump, the wattage again climbed up on the max side from 363 to 414, a 12.32% jolt of power but like the Max Frame Rate, it was a blip and only there for a second. The average power consumed rose 7.53%, which is not horrible but with the slight frame increase, not warranted, though this does mean there is still a lot of headroom for overclocking.
Now on to 4K.
3840 x 2160
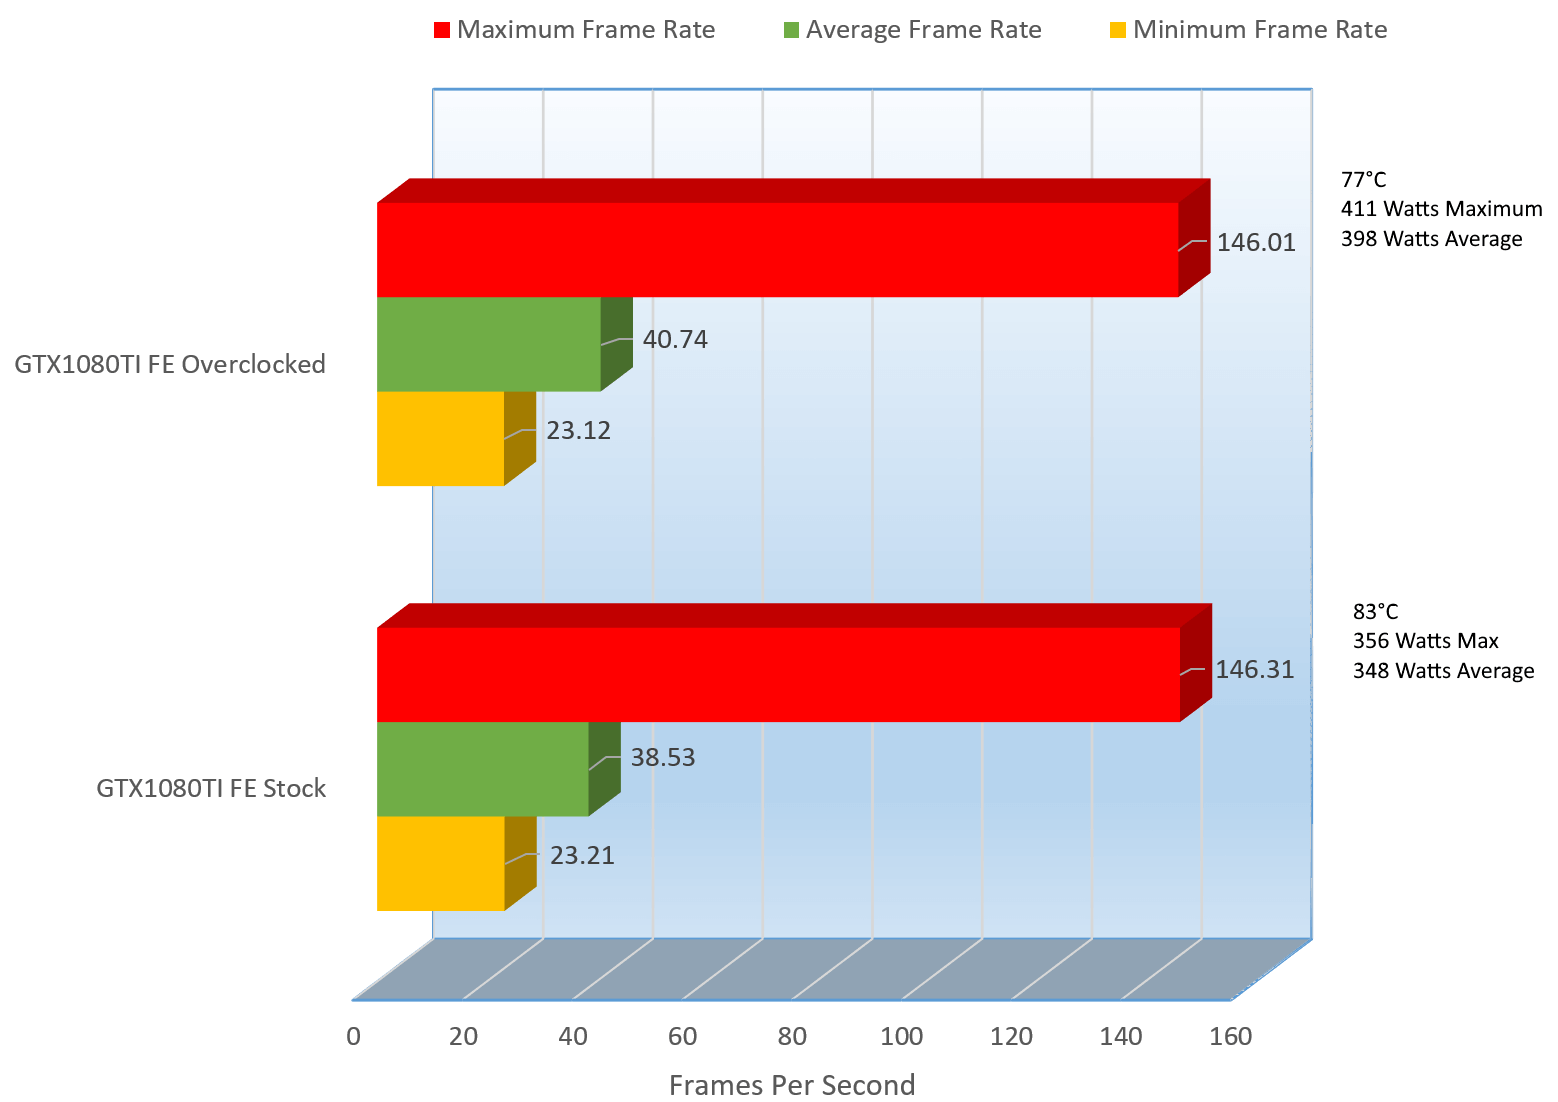
Looks like I might need to work a little more on that overclock but at least we can see there was an improvement on the average frame per second count. On the overclock, we see a 40.74 frame per second mark, which is a 5.42% improvement over the stock clocked 38.53 frames per second. Here though we can see the average wattage an unwarranted 12.56% though the temperate did drop 7.23%. It looks like I may have raised the voltage too high, though soon I will show you how to adjust this and more, so stay tuned.
1920 x 1080
OK, now here we can see the overclock a little more in effect. We can see on average, there was a boost of 3.95% up from its original 119.3 frames per second to its new 124.2 frames per second. The average wattage consumed only increased 3.46% and the temperature dropped 7.70%. Please remember that increasing the fan curve will increase the fan noise, though ever so slightly in this case. Let’s move on to 2560 x 1440.
2560 x 1440
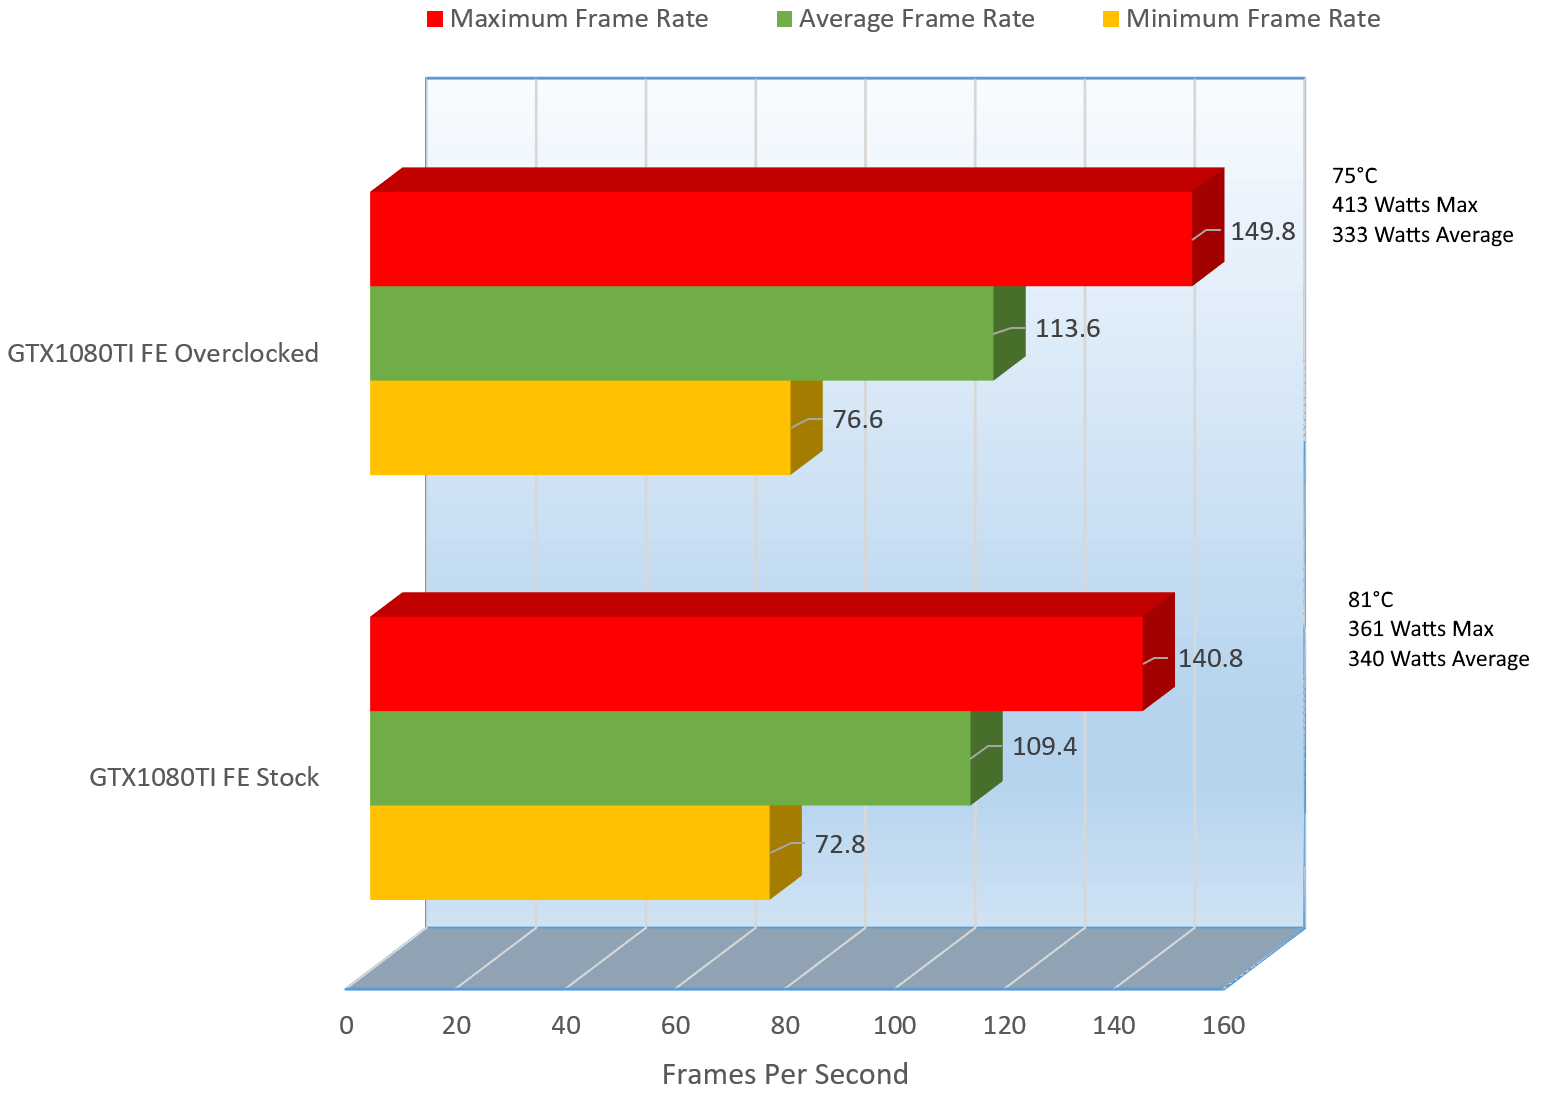
Once again, across the board we see an improvement. The average FPS went from 109.4 to 113.6, a 3.70% increase. Average wattage actually dropped slightly to 2.06%, down from 340 to 333 Watts, that always nice and following its precedence the temperature dropped down to 75°C from 81°C, a 7.41% decrease in temperature. What does 4K have in store for us?
3840 x 2160
It seems that the performance trend continues but the wattage consumption monster is back. On average, there was a 7.58% improvement in performance, from 70.7 frames per second to 76.5 frames per second. With that slight improvement, there was a 11.5% increase in power consumption, up 46Watts to 400 Watts. Thankfully the 7.32% cooling improvement makes up for a bit of that wattage spike, though you can drop it some by lowering that voltage some.
Alright well, at least we did see some more improvement with Thief, how receptive to this change do you think Laura will be?
1920 x 1080
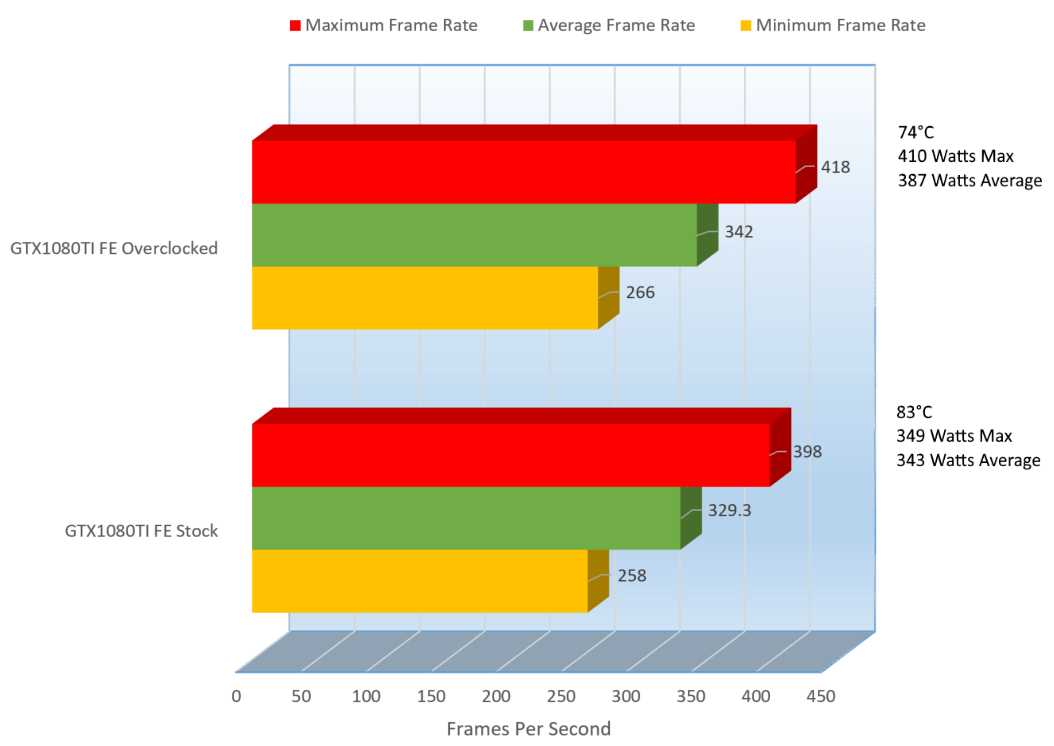
The overclock continues to be effective in Tomb Raider as well, improving the average frame rate by 3.71% from 329.9 frames per second to 342, though at such a high frame rate was it needed? OF COURSE IT IS. That increase though resulted in a 11.37% increase in watts being used from 343 to 387Watts. The thermal improvement trend though continues down from 83°C to 74°C, a welcomed 10.84% improvement. Let’s check out 2560 x 1440.
2560 x 1440
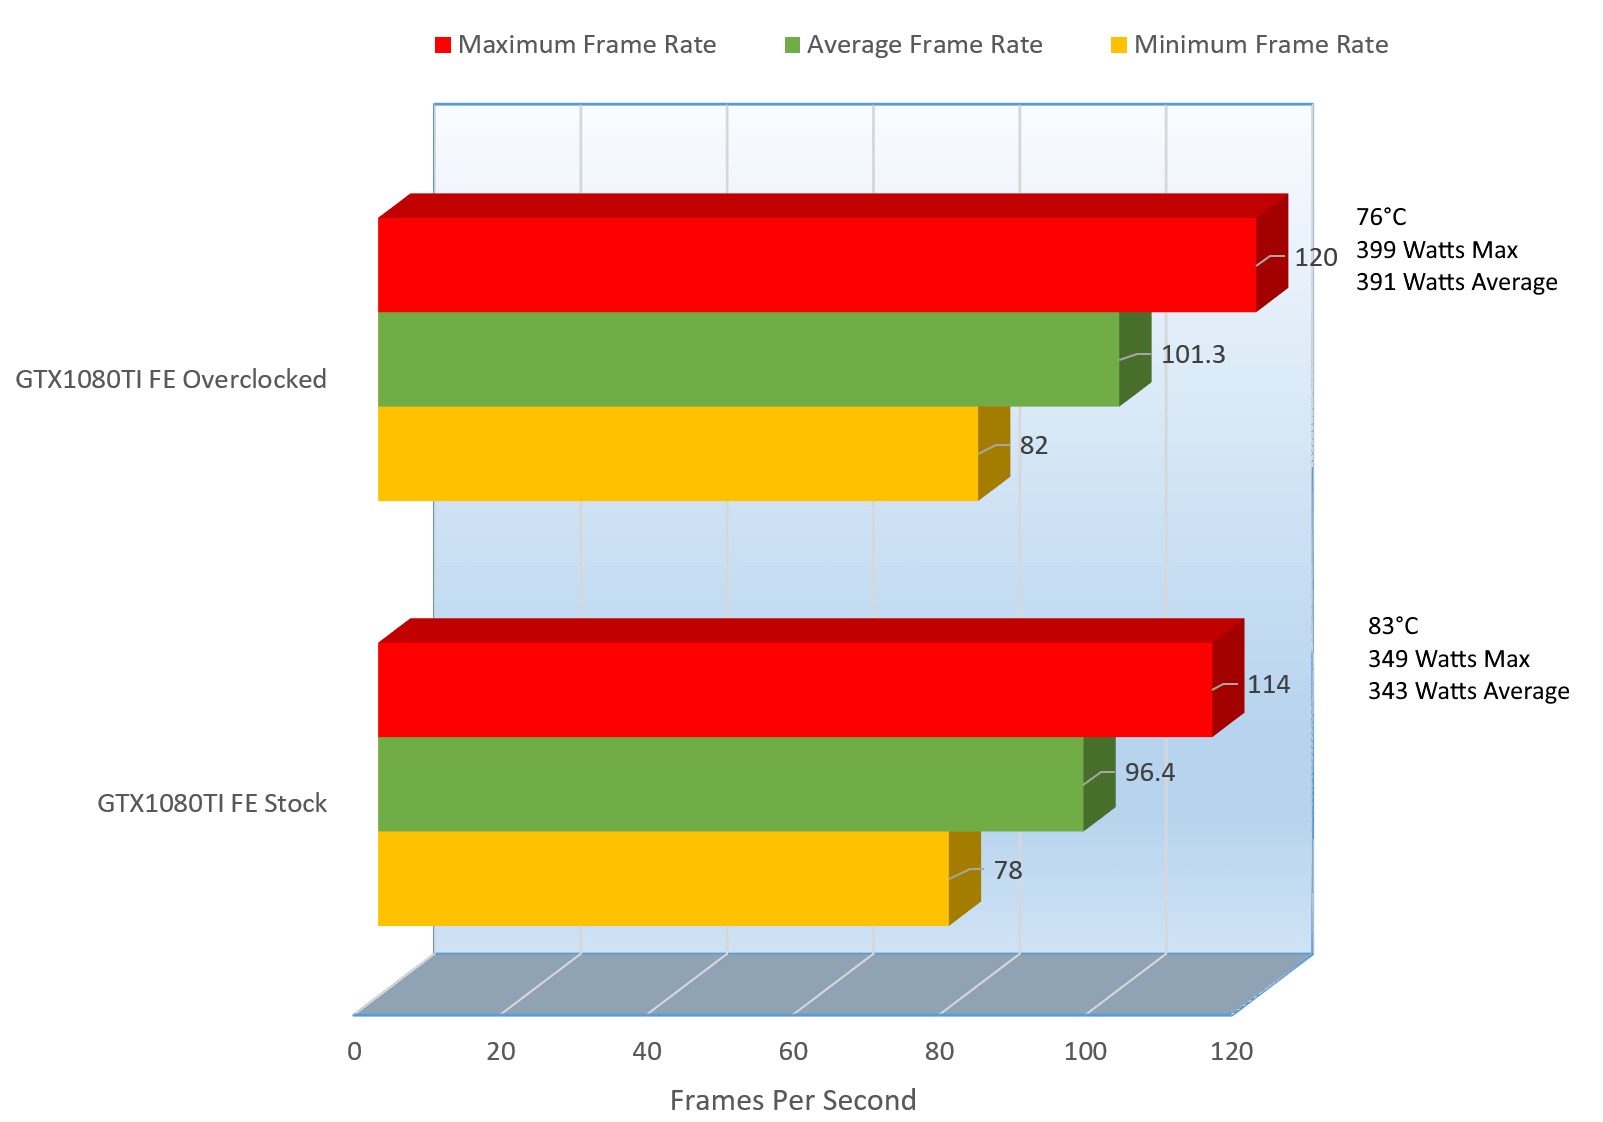
Tomb Raider again benefits across the board with this minute overclock, while not a huge gain, a gain is a gain. On average, we can see a 4.37% increase in frames per second but with it comes the power monger sucking up an additional 9.56% more power at 387 versus 350. Thankfully the fan curve once again come s in to save temps coming in a 76°C, 8.43% better than its stock temps at 83°C. Let’s see if 4K does any better.
3840 x 2160
At 4K, there is almost identical results to that of the 2K set. On average, there is a slight increase in our frames per second count, a 4.83% improvement at 101.3 over 96.4 frames per second. A huge bump in power consumption is again occurring here, on the overclocked we are pulling an additional 12.28% watts at 391 coming in over the stock speeds at 343 Watts.
While there was an improvement in Tomb Raiders score, it was a tiny one on the already huge speeds this card provides. Let’s see if Tom Clancy’s The Division a more demanding and newer title can utilize this overclock a little better.
1920 x 1080
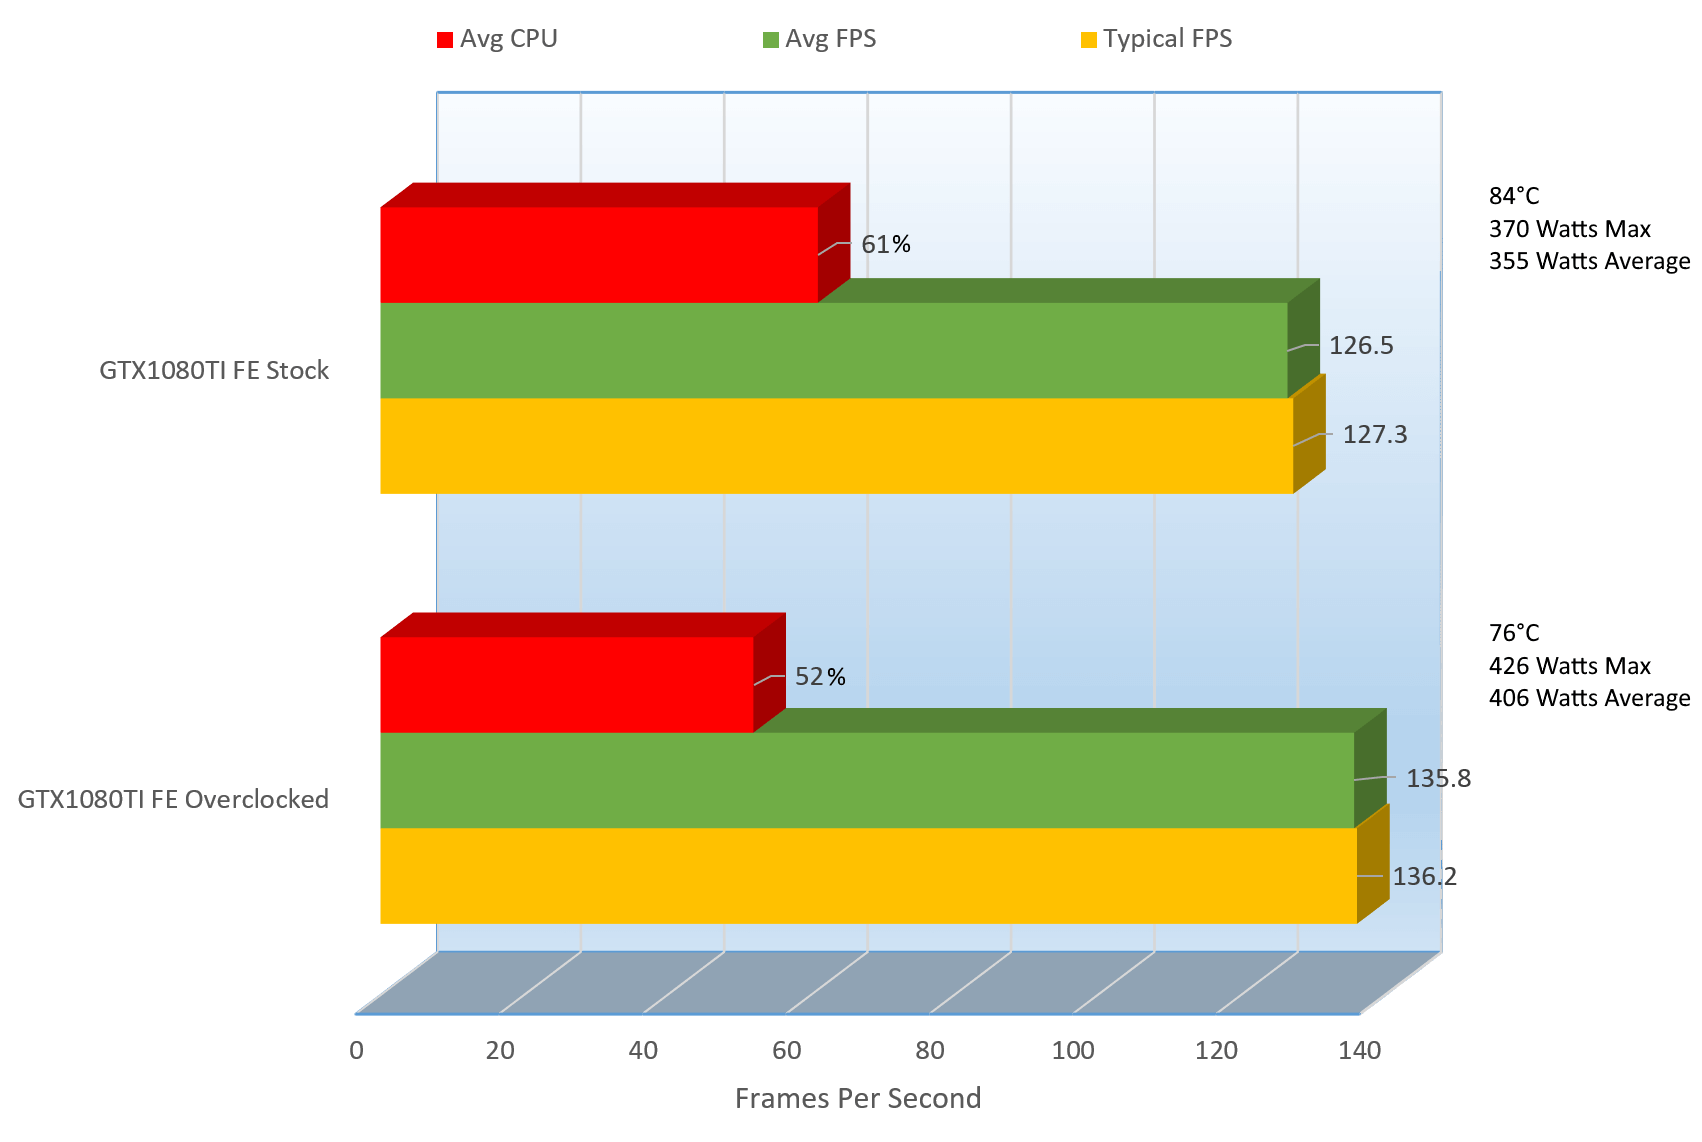
The Division is showing some promise at first, we can see a 6.85% improvement in average performance, 135.8 frames per second over 126.5 frames per second. The improvement brings on a bit larger of a power draw, on average it pulled in 406 Watts when on stock it only drew 355 Watts, that’s a 16.67% increase. Once again, the cooling is on top coming in at 76°C, 9.52% under the stocks cooling of 84°C. The overclock seems to have decreased the CPU utilization 14.75%, so the GPU did the most work.
This was the lower resolution, let’s see what 2560 x 1440 will bring us.
2560 x 1440
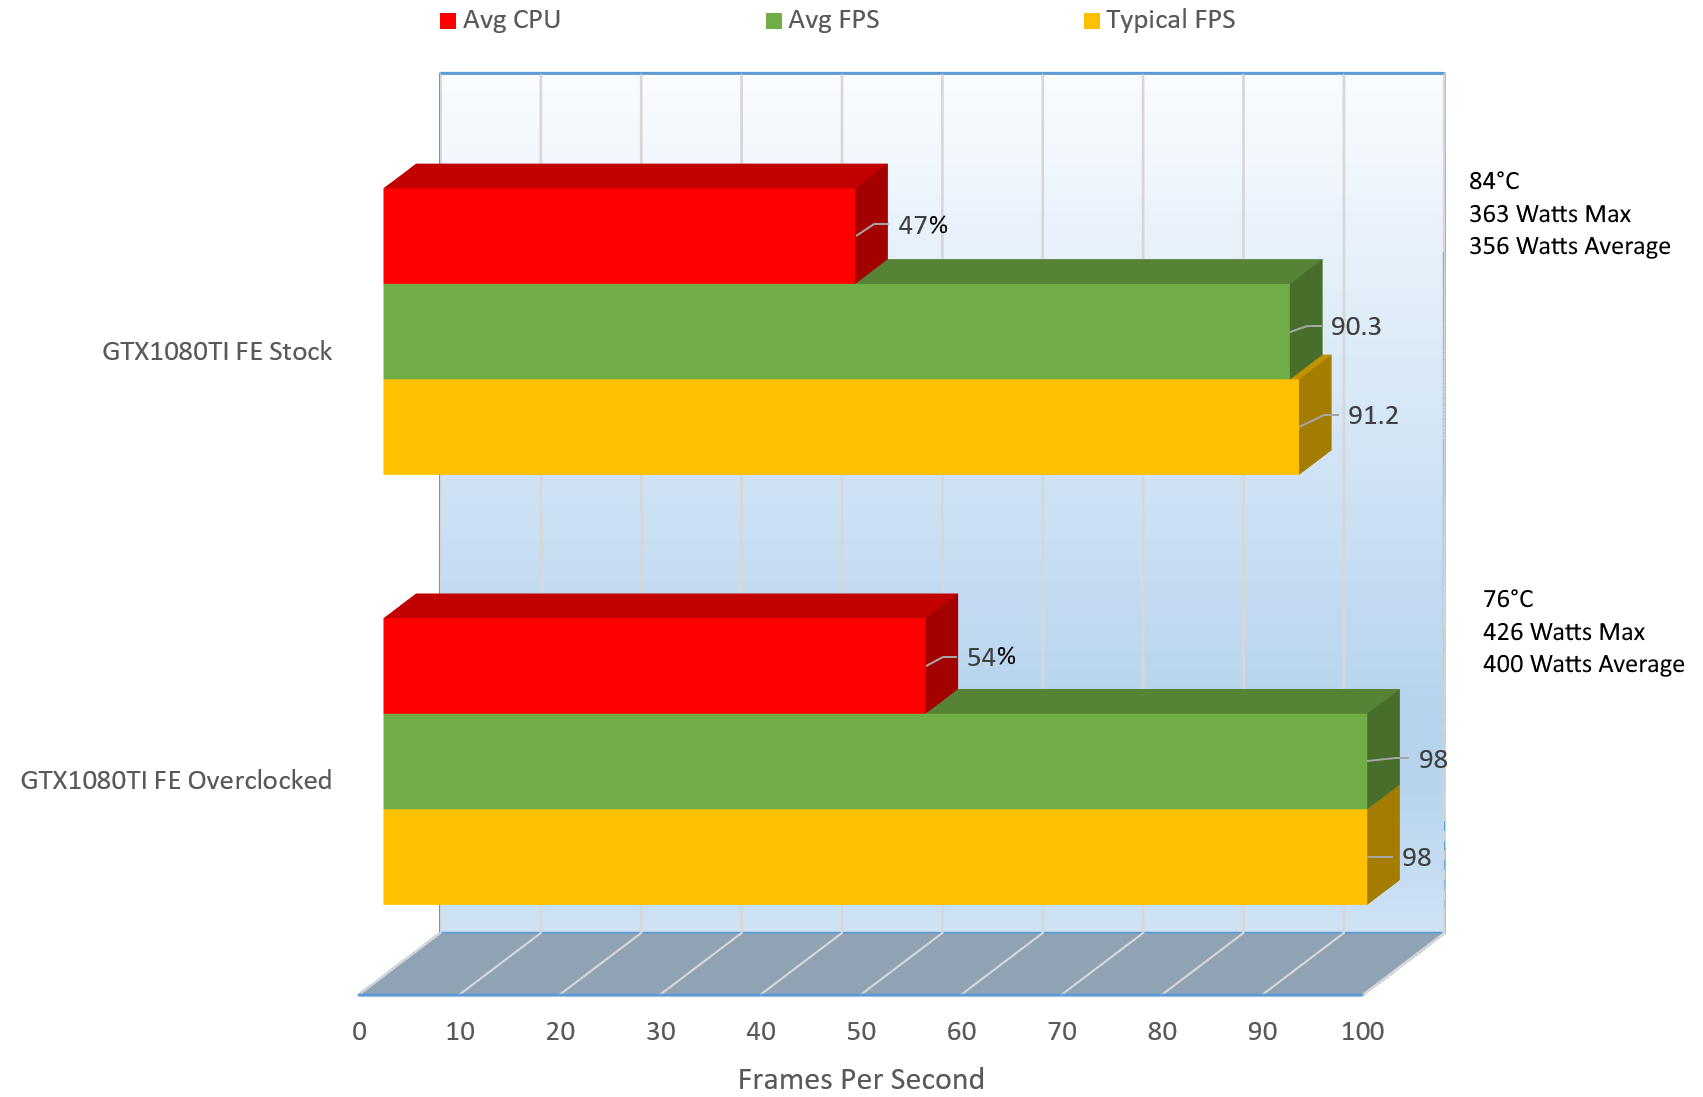
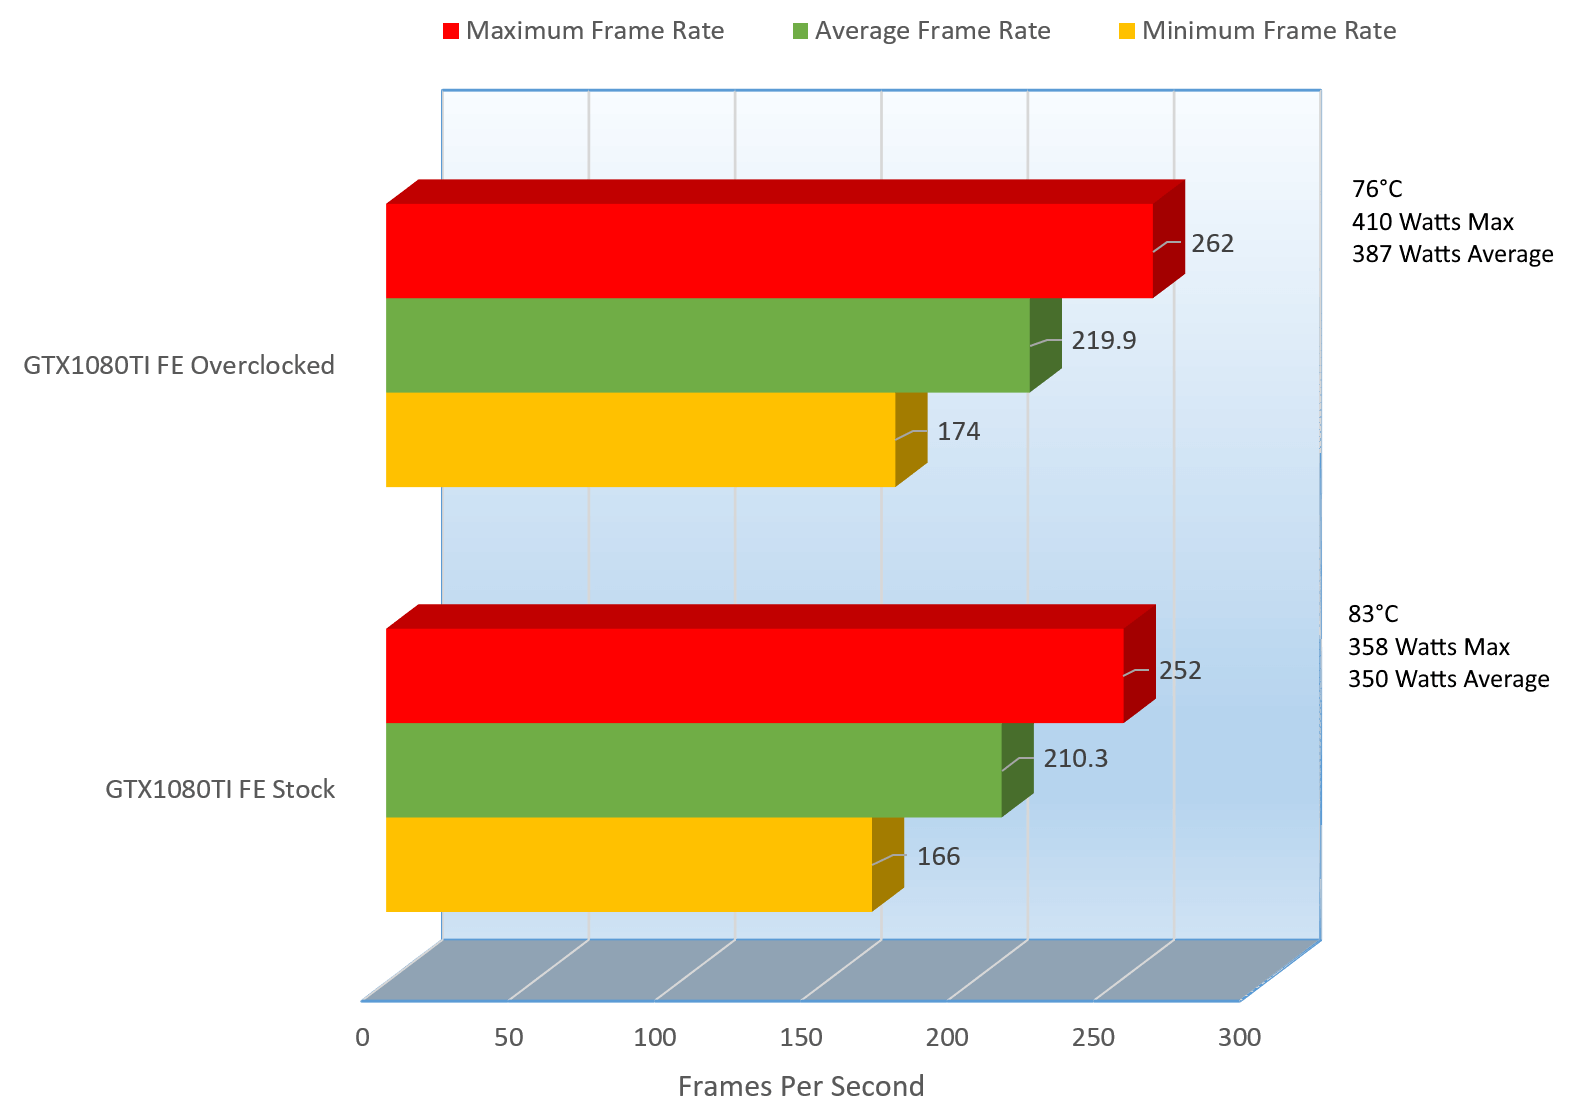
The overclock helped a bit here, on stock the card hit 90.3 frames per second but overclocked we saw a 7.86% improvement with scores a t 98 frames per second. Watts again on average we a bit high at 11% over the stock run at 356 Watts and again, the cooling improvement was 9.52% at 76°C over the stocks 84°C. The overclock here though seemed to rely a little more on the CPU with an increase of 12.97%. Last but not least, 3840 x 2160 is up next.
3840 x 2160
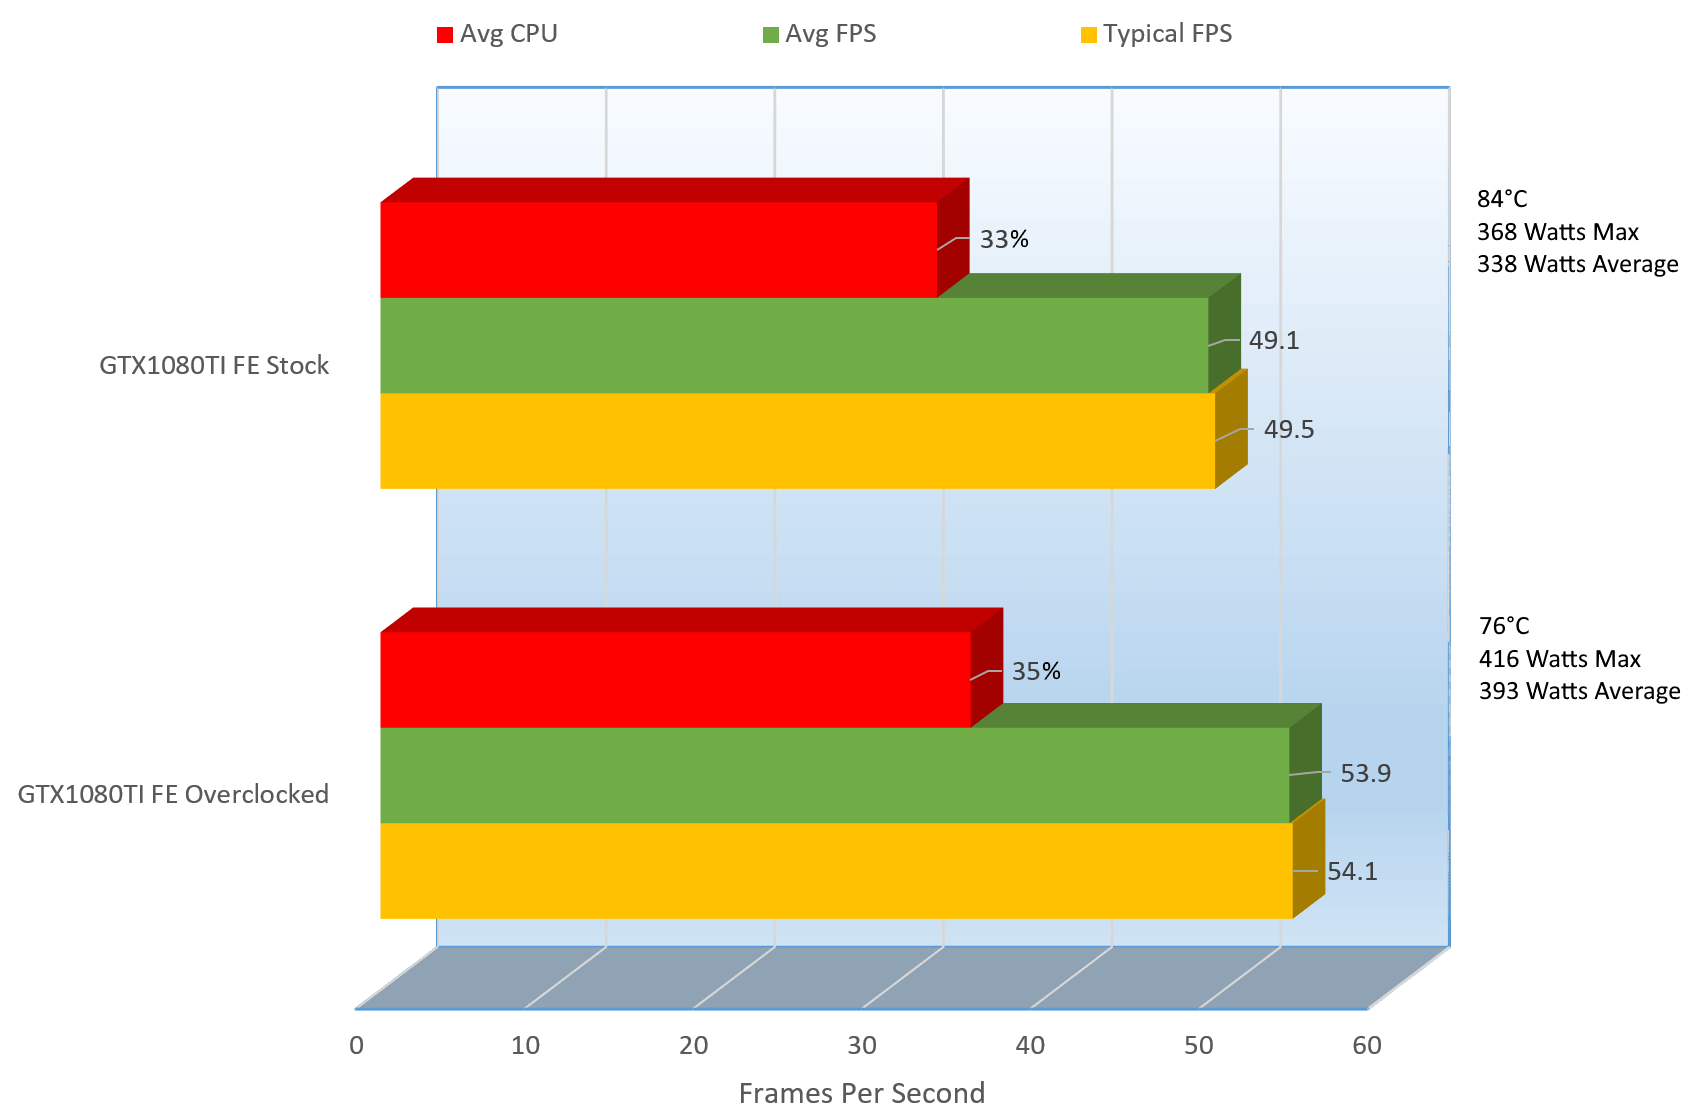
The overclock here makes the game a little more playable at 4K, reaching closer for that magic 60FPS. On average, the overclock came in at a decent 8.91% increase at 53.9 FPS over the stocks 49.1 FPS. The overclock increased the power consumption 13.99% at 393 Watts over the stock performance 338 Watts. Here the average CPU utilization was almost identical at a measly 5.74%, 35% on the overclock and 33% at stock.
It is evident the overclock here was not very good, but surely you can get it much higher, I may work on it some more later. There was plenty of headroom, but of course in any overclock you want stability over speed and they all take some time. Now, like the stock speeds, I will take some time to talk about the thermals.
Here you will notice the thermals never went above 77°C, a few points away from its 84°C maximum GPU temperature by design, many times it was lower than 77°C. The noise did go up a tiny bit, but with the side panel on it is barely noticeable, if anything it can and will be overlooked.
So here I showed you the basics on EVGA’s Precision X OC, but I will go into more detail on the next page and maybe you can overclock it tons more.
[nextpage title=”EVGA Precision X OC Overclocking and Card Utility”]
I know I already showed you this before, but I will show you again the overclock, first in GPU-Z, then in EVGA’s Precision X OC.
And now for EVGA’s Precision X OC:
BEFORE
AFTER
Let’s get into some more detail on the ins and outs of Precision X OC.
We will work our way along the edges the come towards the middle. On the top left hand corner, we have the MENU:
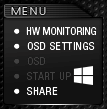
HW Monitoring, shows you the Memory Clocks, GPU Usage, VID usage, Memory usage, Fan tachometer, voltage limit, CPU temperature, GPU Clock, GPU temperature, FB usage, BUS usage, Fan Speed, Power Limit, Temp Limit, GPU Temperature and Frame Time. A decent little monitoring utility.
OSD Settings: On Screen Display, allows you to show statistics over your game, lots of options here.
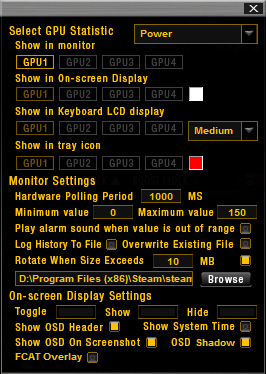
OSD: Enables all the settings you configured in OSD Settings.
Start UP: Allows EVGA Precision X OC to start up with windows.
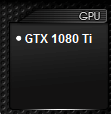
On the top right hand corner, we have GPU: GPU tells you what GPU you have, that’s about it.
Working our way down to the right side, we find the CURVE:

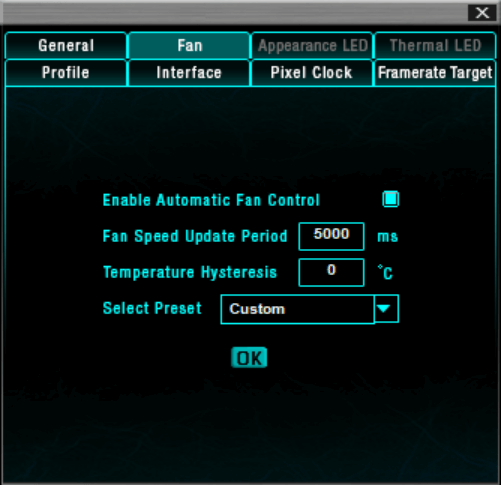
Click on CURVE, brings out 2 Windows, I will show you the first one
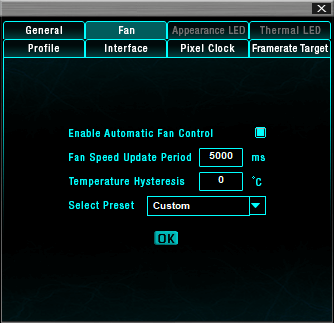
The Fan tab, allows you to Enable Automatic Fan Control, increase or decrease the fan speed update period response time by milliseconds, Temperature Hysteresis and Presets of Custom, Aggressive or Quiet fan speeds.
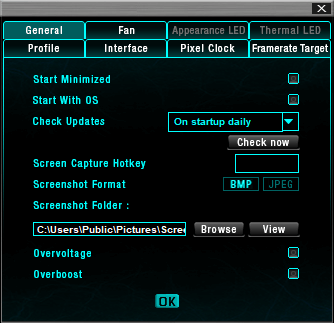
General, allows you to start Precision X OC minimized, start it with Windows, check for update options, check for updates now, set a screen capture hotkey, select your screenshot format, then select you screenshot folder, overvoltage and overboost.
![]()
If you notice here, Appearance LED and Thermal LED are grayed out.
The reason for this is this is a Founders Edition Card, there is little to nothing that can be changed on this card out of NVIDIA’s reference design through EVGA Precision X OC but it is adjustable though NVIDIA’s LED Visualizer. Check out this video on how it work’s
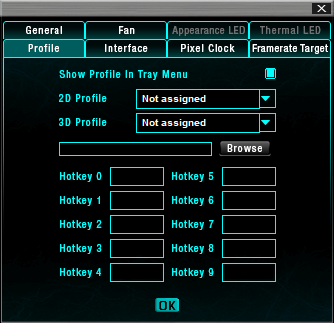
Profile, allows you to show the profile in the tray menu, assign 2D or 3D profiles and set hotkeys. Each profile allows for 10 presets.
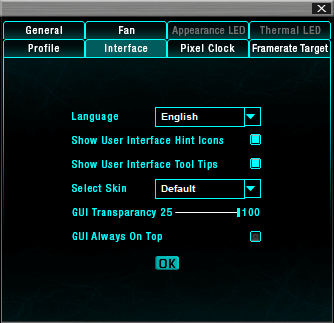
Interface, allows you to set the UI language, show user interface hint icons, show user interface tool tips, change skin colors for the UI, GUI transparency slider and allows you to keep the GUI Always on top.
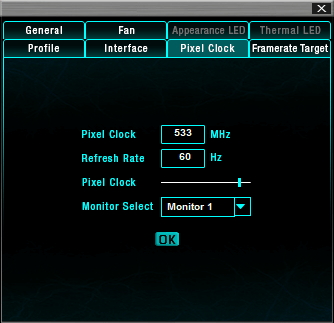
Pixel Clock, allows you to overclock your monitors Pixel clock, Refresh Rate, pixel clock slider and select the monitor you wish to overclock. Be careful with this one, you can kill your monitor.
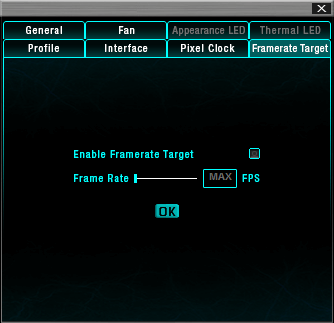
Framerate Target, allows you to Enable Framerate target, Frame Rate slider, allows you to set that framerate target.
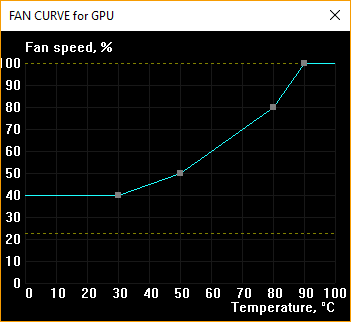
Clicking that CURVE button also brings up this Fan Curve for GPU. Here you can set the fan speed for when the GPU hits a certain temperature, I love using this. So that’s it for CURVE, lets go a little more down on the right.

Clicking the “AUTO” button, allows you to enable or disable the auto fan curve in favor of the manual fan speed. The manual fan speed can be set by raising or lowering the slider just below it and the RPM counter, shows you the current RPM’s the fan is spinning at.

Coming down from the RPM display, we have the gear or cog. This will bring up the initial menu I showed previously and went over a bit.
Moving towards the left, to the left-hand corner we have the log Profiles bar.
![]()
This bar allows you to set profile. Right click on a grayed-out bar and you have set that profile and left click on the whiter text to load that profile. This is a great utility for testing your overclocks. As you can see, I have 3 prior profiles I tested before I landed on the final one, the 4th. I know, I need a few more to get a good overclock.

On the bottom left hand corner, we have the K for KBOOST. KBOOST forces the card to operate at full boost speed regardless of the load. This generates more heat and uses more power.

Moving closer to the center of the program, we find DEFAULT. Default allows you to quickly come back to the stock speeds in case you forget where you started.

On the opposite side of the center, we find the Apply button. Apply allows you to apply any of the changes you have made.
Now, let’s work in the center.
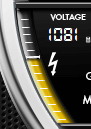
The Voltage slider allows you to adjust the voltage, common sense, right? Should only be done when you over overclocked the GPU and the overclock becomes unstable, this provides more power to the GPU.
Coming over to the middle, we have some sliders.
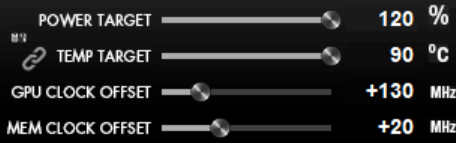
Power Target allows you to raise or lower the power target. It allows you to set the limit at which the card will throttle.
Temp Target, allows you to set the maximum temperature at which the card can hit before it begins to throttle the GPU. Notice here that the slider does not let you go above 90°C, 1°C lower than it’s designed max.
Let me also show you a bit on how she sounds and how the LED works.
GPU Clock Offset, allows you to adjust the GPU’s speed. The Offset starts at the base clock of the GPU, so for example, the base speed is 1481Mhz, raising the GPU Clock Offset to +130, will raise its speed 130Mhz to 1611Mhz.
Mem Clock Offset, like the GPU clock offset but for memory, allows you to adjust the memory’s speed. The Offset starts at the base clock of the memory, so for example, the base speed is 1376Mhz, raising the Mem Clock Offset to +20, will raise its speed 20Mhz to 1396Mhz, but the slider is not always precise, so you might have to play with each to get it perfect.
The link shown in that picture, linked allows the voltage and temperature targets to remain linked or unlinked across cards, if you have multiple cards.

The priority toggle, allows you to choose the priority between Power Target and Temp Target.
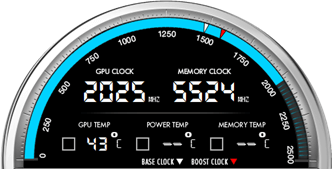
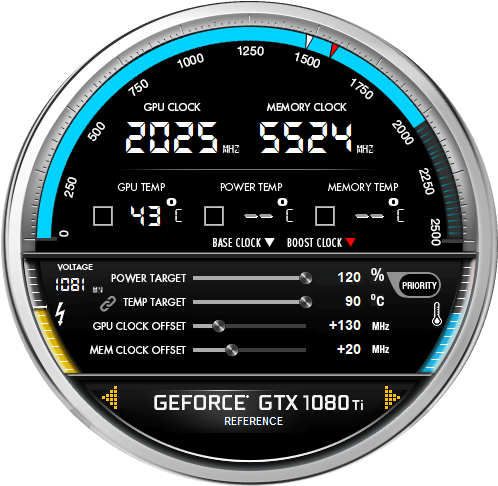
The center, shows you your current GPU and Memory click, GPU Temperature, Power Temperature and Memory Temperature.

These little pointers show you as well your current Base clocks and boost clocks. The blue bat shows you what your current speed is, it along with the GPU Clock, GPU Temp, Memory Clock, Base clock pointer and Boost clock pointer will jump around as you play a game or do anything with your PC, these are dynamic indicators.

This bar, depending on which yellow arrow you click will change what is display.
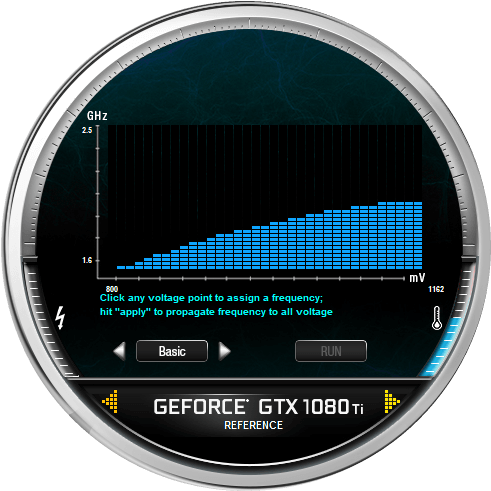
Clicking the yellow arrow to the right once, brings you to this screen. On the left, the vertical bar shows you your GPU’s Ghz (speed) and the horizontal line shows you the millivolts. You can click anywhere here to assign the voltage and frequency.
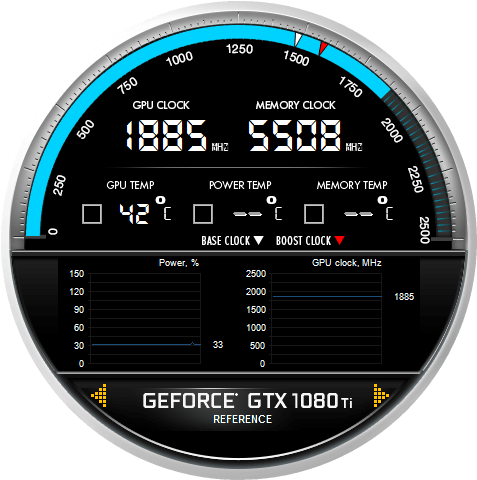
Clicking on the right arrow again, we come to this screen. This screen shows you while benchmarking what your current power percentage and GPU Clock Mhz are, this should help you determine a good overclock. I will say, these last 2 screens I showed you, I had not used in my overclock, might have been better and quicker overclock if I did though.
So, next up,… my Final Thoughts and Conclusion.
[nextpage title=”Final Thoughts and Conclusion”]
Pros
- 3 x Display Ports and 1 x HDMI, you have some options here
- Great Performance
- Supports 4 x monitors Simultaneously
- G-Sync Support
- Supports DX12
- Aluminum Backplate
- LED
- VR Ready
- Supports 7680×4320 8K Super UHD
- Supports GameStream
- Includes a DVI to Display Port and multiple power adapters.
- Can cool nicely (with adjustment)
- No compromise gaming
- 3 Year Warranty
- Price
Cons
- Does not include any HDMI display adapters
- Could be important for people that have 2 x DVI Monitors, 3 x HDMI Monitors, etc…
- Can be noisy
- Fans do not turn off
- Low temperature ceiling
- Price
While there are a ton of Pros, there are a few cons but that does not stop the card from being amazing. The performance is great, but make sure your case has some good cooling so support it and if you are very sensitive to noise, you might want to re-arrange your PC setup to accommodate for it but it is a keeper.
I mention price as both a pro and a con because while it is a high price it is the best at its price point or anything near it honestly. To get better, you need to pay almost double but you will not get double the performance, so the cost of better does not seem justifiable, but I may be able to confirm that for you soon.
For me, this card gets a 5 out of 5 Editors Choice, but if we had a 10 point scale, it might be 9 or 9.5 because it can be better though still an Editors Choice. As I slightly hinted, I hope to soon have an ICX card and/or an XP to compare and contrast, but as for now, this is tops.

I want to take a second to mention, I did not receive this card for free to review, nor did I buy it, I actually leased it to review for your guys. This gives me the ability to upgrade or downgrade whenever I want to review cards for you. I did this by going to CuttingEdge gamers, you can check it out here: http://bit.ly/2o49E8K but its best to give them a call and talk to them, they are really nice and will describe the entire process. If you are biting the bullet and getting a card from them, mention that Iggy from Dragonblogger.com sent you and you will get a discount too.
Let me know what more you would have liked to have seen or any recommendations.
We are influencers and brand affiliates. This post contains affiliate links, most which go to Amazon and are Geo-Affiliate links to nearest Amazon store.
I have spent many years in the PC boutique name space as Product Development Engineer for Alienware and later Dell through Alienware’s acquisition and finally Velocity Micro. During these years I spent my time developing new configurations, products and technologies with companies such as AMD, Asus, Intel, Microsoft, NVIDIA and more. The Arts, Gaming, New & Old technologies drive my interests and passion. Now as my day job, I am an IT Manager but doing reviews on my time and my dime.