
We are influencers and brand affiliates. This post contains affiliate links, most which go to Amazon and are Geo-Affiliate links to nearest Amazon store.
Pre-built PC’s and home built PC’s can be very different. OEM’s many times can water down components, make upgrading impossible with proprietary components, but they can distract you with AMAZING pricing.
Home built PC’s are great, if you know what you are doing, have the time and have deep pockets. You and I don’t get the discounts the OEM’s do but boutiques do. This is where I introduce you to iBUYPOWER and their RDY VIBG202 offering.
iBUYPOWER is not a OEM, they don’t build PC’s that have proprietary components trapping you into their support scheme. iBUYPOWER is a boutique PC builder, meaning they use off the shelf components you and I can buy today at better pricing than you and I can get building a PC to suite your needs. Now the question comes up though, are they good, can they build the PC that does what you need for today and maybe for the foreseeable future as well affordably, we will go over this as well, not just performance. You and I will find out together.
In this review, we will go over the iBUYPOWER RDY VIBG202, checking out the components and the performance of the PC as well as the price to find out if this PC is worth it, or if it is just another rip off. Let’s check out an unboxing first to see what comes in the package.
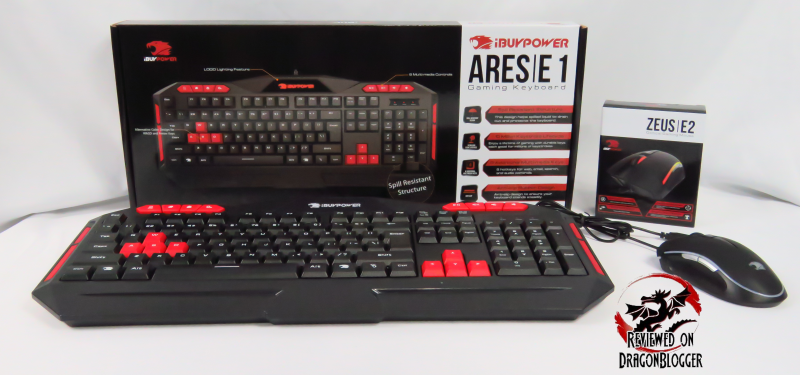
It is almost a complete system, you get a keyboard, mouse and a PC, you only need to buy a monitor, unless of course you already have one.
Now let show you what’s inside
- Case: iBUYPOWER Tt View 21 2x Side Tempered Glass Gaming Case
- Lighting: RGB LED Strip
- CPU Cooling: iBUYPOWER 120mm RGB Liquid Cooling System
- Motherboard: MSI Z390-A Pro
- Processor: Intel Core i7 9700K
- Memory: XPG Z1 16GB DDR4 3000Mhz
- Video Card: MSI Ventus GeForce® RTX 2070 – 8GB
- Power Supply: Thermaltake 600 Watt – SMART Series 80 PLUS Gold
- Hard Drive: 240 GB Western Digital Green SSD (OS Drive)
- Hard Drive: 1TB Western Digital Blue Drive 7200RPM (Storage)
- WI-FI: Intel(R) Dual Band Wireless-AC 3168
- Wireless Adapter Card
- Ethernet: Intel(R) I219-V (Onboard)
- OS: Microsoft Windows 10 Home
- Game Bundle
- Keyboard and mouse combo
- 3 Year Standard Warranty Service Lifetime Phone Support
Everything separately comes to about $1,756.61 but iBUYPOWER is selling this at the moment for $1599.99, so you get some savings, but is it worth it, we will get to that a little later.
I will not be comparing this to my own system at the moment, as I am currently benchmarking my machine, but I will add on to this review shortly. I wanted to give you all this information as soon as possible.
I will be benchmarking using 3DMark Firestrike, 3DMark TimeSpy and PCMark 10. Then I will also be benchmarking with games like FarCry 5, Metro Last Light, Shadow of the Tomb Raider and Tom Clancy’s Wildlands. Now a gaming PC doesn’t just only game like a console does, a gaming PC can do everything a regular PC can do but a lot faster and to gauge that, I will be running tests like AIDA64, BootRacer, CINEBENCH, Crystal Disk Mark and again PCMark 10 so you can see just what you are getting.
Metro Last Light I have been using for some time, but potentially will be updating soon but FarCry 5, Shadow of the Tomb Raider and Tom Clancy’s Wildlands are newer ones on the line up.
I will also be recording power consumption throughout these tests using “P3 International’s” “Kill A Watt” so you can see how much power this thing is taking. Also, I will be recording temperatures as well.

Without further a due, let’s check out the next chapter of this review, Gaming Benchmarks.
Continue: GAMING BENCHMARKS
[nextpage title=”GAMING BENCHMARKS”]
This section will give you an idea on what you can expect on the benchmarks to compare to your own system to see how it fares.

Let’s start it off with 3DMark’s Fire Strike

The score we normally would look at is the standard score of 19,021 which is actually pretty impressive scoring 93% better than all other results. There we can see that the system consumed a max of 306 Watts and on average consumed 236Watts. The system pumped out a max temperature of 62°C on the CPU and a 65°C on the video card, decent temperatures, though liquid cooling unit seemed a little under powered.
The RTX 2070 is fairing very well paired with the Core i7 9700K, but let’s check out the rest of the scores.
Off of the same utility, let’s check to see what TimeSpy offered.


The score here is 8,190, scoring better than 79% of all other results. While the 2070 is a great card, it might start to struggle a little at 4K, which is what TimeSpy runs at, though still not bad.
On this test, we can see that the system consumed a max of 223 Watts and on average consumed 207Watts. The CPU heated up to a max temperature of 61°C and the GPU 63°C. These are decent temps, not amazing though.
This focus mainly on the video card, and a little on the CPU, let’s get an overall feel of the system though and for that we will use PCMark 10.
PCMark 10 benchmarks the entire system to see how well it will work in an office environment for productivity, digital content creation, web browsing and also some gaming as well. While a synthetic benchmark, it can better help you gauge overall system performance.


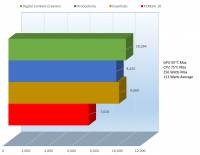
The score here is 7,010, performing better than 98% of all other results, this includes prebuilt and custom-built PC’s here, there is no bias.
Coming close to the top, we can see that the system consumed only a max of 256 Watts and on average 111 Watts. The CPU heated up a bit more at 75°C and the GPU 65°C. 75°C is nothing to be alarmed about, since the point of danger where the CPU starts to throttle is 100°C. This does however show that this may not be the best liquid cooling solution, but let’s not get ahead of ourselves on this, there’s a little more to this that I will go on to a bit later in the review.
So this configuration on 3 tests scored over 90% better than all other systems tested, that’s nothing to overlook, we have some serious performance here.
While 3DMark and PCMark are nice, you can’t play them and they only give you an idea of what you can expect, let’s check out some actual game performance.
We will start off with Metro Last Light

Here are my presets, I ran all tests at these settings changing only the resolutions. I tested at 1080P, 1440P and 4K UHD (3840 x 2160).
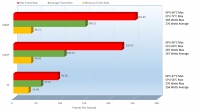
Starting off at 4K, the game was playable though potentially running into some hiccups as it hit an average frame rate of 57.07 and consumed an average of 276Watts. The video card hit a max temperature of 67°C and the CPU kept its cool at 54°C which is not bad for a game.
At 1440P, we hit a much better gaming experience at 105.51, a 45.91% improvement, consuming on average 267 Watts, 4.30% lower than in 4K. The CPU heated up a little more, but still manageable at a 27.8% increase at 69°C and the GPU 66°C, 1°C lower than in 4K.
Finally, at a very common 1080P, the game performed 41.42% better than at 1440P, coming in at 149.21 frames per second eat up an average of 276 Watts. Since the resolution was lower, having more CPU dependency, the CPU did get 5.80% hotter at 72°C. The GPU kept it’s cool on par with its 1440P counterpart at 66°C.
We can see the makings of a good system so far, game wise, so let’s jump into Far Cry 5.

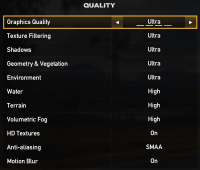
Here are the presets for Far Cry 5, I ran all tests at the Ultra Quality settings changing only the resolutions. I tested at 1080P, 1440P and 4K UHD (3840 x 2160).
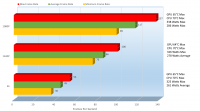
This game surprised me a bit at how much it took. You can see at 4K, it was not playable at a chunky 45 frames per second average, consuming on average 261 Watts and heating up that CPU to 70°C. The GPU handled it a bit better heating up to 65°C, both temps are not high by any means but the GPU seems to be keeping cooler.
At 1440P, the game is excellently playable at 86 frames per second, 91.1% better than at 4K and taking up on average 278Watts only 6.51% more, that’s a decent exchange. The CPU again maxed out at 70°C while the GPU dropped a degree at 64°C.
At 1080P, you are free as a bird hitting frame rates on average at 117, 26% better then at 1440P and draining the power plant running on average 286Watts. The CPU stayed at a decent 70°C while the GPU regained that lost degree and went back up to 65°C. Beautiful graphics and the engine seems to be relatively well optimized.
The 2070 and 9700K did pretty well on this game also, especially being that this is a newer game and all. Let’s check out Shadows of the Tomb Raider.

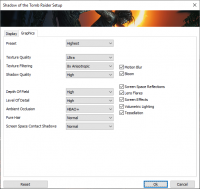
Here are the presets for Shadow of the Tomb Raider, I ran all tests at the Highest Quality settings changing only the resolutions. I tested at 1080P, 1440P and 4K UHD (3840 x 2160). Even though some areas show Ultra, High and Normal, those as the preset implies are the highest settings available.
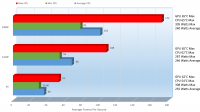
Historically as I have tested before, Tomb Raider has not taxed the cards as much as this one has, you can see at 4K, we have a slide show at 30 frames per second on average. It is so bad, the average wattage was only 255 Watts and the CPU and GPU kicked their feet up on the table and heated up to 54°C and 62°C respectively, they just gave up the ghost.
At 1440P, we were almost 100% playable at 54 frames per second, up 44.44% above 4K’s FPS and consuming 246 Watts on average. The CPU now woke up and heated up to 62°C, 14.81% higher than before and the GPU was 4.84% hotter at 65°C.
1080P is totally playable at 78 frames per second and consuming 2.5% less power on average than its 1440P sibling. While the power consumption was less, the CPU temperature increase a mere 4.84% to 65° and the GPU maxed it and the previous test at 65°C as well.
Laura kicked up the notch here and put the system to the test, demanding more and the RDY VIBG202 buckled a bit but picked up the pace. Next up, Tom Clancy’s Ghost Recon Wildlands.


Here are the presets for Wildlands, I ran all tests at Ultra changing only the resolutions. I tested at 1080P, 1440P and 4K UHD (3840 x 2160).
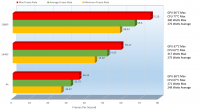
The Ultra preset killed it on this game, at 4K, totally unplayable at 31.72 frames per second and consuming on average 249 Watts. The CPU was a toasty 67°C and the GPU 68°C.
At 1440P, we saw a resurrection of sorts having the frames per second count improve 62.77% coming in a t 51.63, not 100% playable but very close to 60 fps. During this test, the average power consume was 275Watts and the CPU and GPU matched at 67°C, mirroring the previous results and 1° lower on the GPU this time around.
At 1080P, the FPS count was 28.99% faster then at 1440P. this time achieve 66.6 frames per second. This time the average was only 1 watt higher than before coming in at 276Watts. With that lower resolution, the CPU kicks in more and heating itself up to a concerning 77°C, that’s 14.93% higher than before. The GPU on the other hand relaxed a bit only heat up to 66°C, 1° less than on previous tests.
I like to run these all at their highest settings so that you know what to expect, a simple drop in preset will greatly improve playability on all games. For example, dropping Ultra to High or High to Medium and reduce many of those needless settings and greatly improve performance.
My preferred resolution is 1440P, for even the highest end card, is the comfortable spot for gaming. Mind you 4K is nice to, if anything just to say you can, but over 60 frames per second is the sweet spot. In the forums I frequent, a greater percent of the team runs their games at 1080P, but 1440P is my sweet spot. It seems to be the 2070’s sweet spot as well for half of the line up above a 1 setting change can change the performance for the other 2 games to achieve 60fps or above.
Now, not everyone reading this is a gamer and that’s OK, you might prefer some video encoding, writing, ripping some music or just browsing the web, so let’s check out some Drive benchmarks and afterwards some CPU Benchmarks.
Continue: Drive Benchmarks
[nextpage title=”Drive Benchmarks”]
For the operating system drive, iBUYPOWER provided an SSD, the WD Green 240GB SSD. Let’s see how she performs.

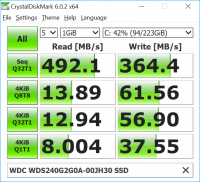
We can see that the Read here was 492.1MB/s (MegaBytes Per second), while the write was 364.4MB/s. By far, nothing to write home about but now let’s see the speeds the 1TB Blue Drive achieves, a mechanical drive.
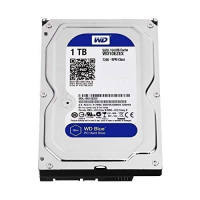
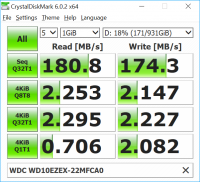
The numbers may not mean a lot to you yet, but the SSD reached 492 on write versus the mechanical drives 180.8. What this means is that the SSD reads data 172.17% faster than the mechanical drives and then with that, the SSD wrote information at 364.4MB/s while the mechanical drive wrote it at 174.3MB/s. So again, the SSD writes it faster, 109.06% faster in fact than the mechanical drive.
Many of us know that an SSD is much faster than a mechanical drive, but I am writing this for those of us that may not know this, I want to help everyone else out. This also though it to remind you that even though this is not the fastest drive, it is ALWAYS faster than a mechanical drive. Many OEM’s still include mechanical drives in their systems as boot drives, sometimes they are even 5400RPM’s drive which are much slower.
Something I will focus on more a bit later, but relevant to this portion of the review is that MSI on their website for the motherboard, provides a piece of software called Dragon Center.
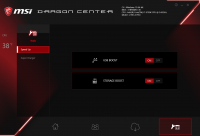
Dragon Center allows you to improve the performance of your drives as well just flicking a switch, so I figured to try it.
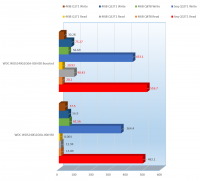
We can see here the boosted drive, boosted using Dragon Center’s switch for the most part performs better than the standard drive. I didn’t want to get into each of these, since this is an overall performance score, but I think I should let you know what each of the sections are listed above in the legend.
- 4KIB Q1T1 is the random read or write of a 4KB block with single queue and thread
- 4KiB Q8T8 is the random read or write of a 4KB block with multi queues (8) and threads (8)
- Seq Q32T1 is Sequential Read or Write of multi queues and threads
- 4KiB Q32T1 is the random read or write of a 4KB block with multi queues (32) and threads (1)
Windows assumes that files and memory are handled in 4 kilobyte chucks, meaning that all transfers from a drive to memory are 4 kilobytes in size.
A queue, is a set of instructions, 1 queue is one set of instructions and multi queue or multiple queues are multiple sets of instructions or data and they are processed in order. A thread, manages the queues processing their data, a thread handles 1 queue, multiple threads handle multiple queues to process data efficiently.
The one most pay attention to is the Seq Q32T1, as this is the reading that drive manufactures publish and are usually held accountable for. You can see that the sequential data is read 5% faster on the boosted results than it is on the standard results and is written 18.85% faster in the boosted results over the standard results. That’s pretty impressive considering it’s a free and easy overclock.
This software is actually pretty good, but is not included in the install from iBUYPOWER as some may consider this bloatware, but actually is a bit handy. I recommend downloading this off of the MSI’s Z390-A Pro with WiFi support site, along with a few other important things I will mention later in this review. It comes on the media included but I always recommend downloading the latest version, regardless since there is no optical drive, you cannot read it and it also saves a few dollars it not being included.
I would like to reiterate, the operating system is installed on the SSD, not the mechanical drive so this lends itself to the system running so smoothly. When you have a powerful system, you want things to run well, you also want the system to boot quickly, so I will test the boot speeds using BootRacer from Greatis Software.

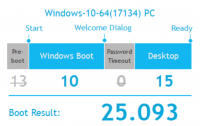
From here, we can see that rebooting a machine took in total 25.093 seconds to boot. Now this does not mean it takes 25 seconds from the second you see the black screen till the point you enter windows. The boot test starts once the BIOS P.O.S.T. screen appears till the point it enters windows, that was 10 seconds. The other 15 seconds is the point that windows finishes loading all of the programs and everything is loaded into the system tray, that is how it gets to 25.093 seconds.
10 seconds into windows at 15 seconds more for everything to load. This means that after 10 seconds you can start using the PC and things will work just fine, but things will run a little more smoothly if you waited those additional 10 seconds.
Since the operating system was only on the SSD I could only test on the SSD, but if it were on the mechanical drive booting into windows will take anywhere between 30 seconds to 1 minute longer. Booting into an idle state in windows, throw in another at least 30 seconds. SSD’s are amazing.
So let’s move on to the CPU performance with CPU Benchmarks.
Continue: CPU Benchmarks
[nextpage title=”CPU Benchmarks”]
Testing the CPU involves speed testing but it also involves heat, heat dissipation and power. For these benchmarks we will be testing using MAXON’s Cinebench and FinalWire’s AIDA64.
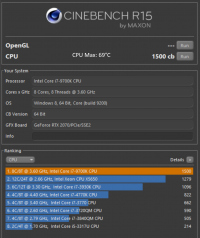
With a pass of Cinebench, we can see the Intel Core i7-9700K bests an Intel Xeon X5650. The Xeon has 12 cores and 24threads and the 9700K has 8 cores and 8 threads, no hyperthreading. You might ask, then how did Core i7 9700K perform better than a Xeon, simply put speed.
While the Xeon did have more cores and threads, the Core i7 has almost 1 gigahertz on each core more than the Xeon. It’s like comparing 8 experienced fast employees working on a task vs 24 newer workers on a task. Both will get the job done, but the experienced workers are faster and can do more than the newer workers because they are faster.
Cinebench measures the CPU performance using the processors processing power to render a photorealistic 3D scene. As the program runs, you can see each core (physical and hyper-threaded) load individual frames.
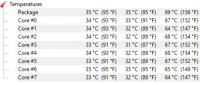
During this test, the hottest the CPU reach was 69° on the package and the hottest core was 68°C. I have below how these looked in HWMonitor.
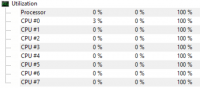
You can see during these tests, the CPU hit 100% utilization.
This shows just a bit on the cooling power of the custom liquid cooling unit the iBUYPOWER comes packed with, let’s go into a bit deeper using AIDA64 stability test.
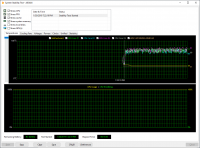
I ran AIDA64’s Stability test for 15 minutes stressing the CPU and each of it cores 100%. You can see on the bottom screen where the yellow line reads CPU utilization at 100% and the green line all the way at the bottom reads 0% that shows CPU Throttling. CPU Throttling occurs when the CPU reaches its TJunction or Junction Temperature which is 100°C and then slows itself down to protect itself from burning up or melting. This is not an issue now a days because of it, but not too long-ago CPU’s would burn up if not cooled correctly.
While throttling is a good mechanism to protect the CPU, it slows you down because the cores cannot work at their full potential. The tests show here that during those 15 minutes the CPU would only reach its highest temperature of 83°C (it shows 81°C, but I watched it and saw the highest spike was 83°C) so it did not come close to throttling under full load. Keeping your CPU nice and cool is very important and this unit can take care of any work load you throw at it under regular use.
As the CPU heated up, the liquid cooling unit got louder, which is a great thing. While the system is idle or performing minimal tasks the liquid cooling unit quiets down, the fans slow down a bit as they are not truly needed. As the temperatures begin to spike, the fans start reving up working to cool the CPU back down to a comfortable temperature.
The liquid cooling unit is decent, but not recommended if you are planning on overclocking this CPU to its limits. I will get more into the liquid cooling unit and an issue I found later in the review.
The 2 tests performed here are considered synthetic and while it comes close to recreating real-world use, sometimes overly exaggerating real word use, is not real-world use. So let’s get it to some gameplay and see how the overall system performs and keeps itself cool.
Continue: Realworld Gameplay
[nextpage title=”Realworld Gameplay”]
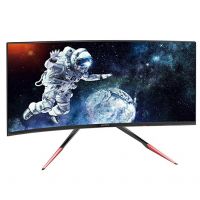
Games, Games, Games, it’s what you do on a gaming PC but really you can do anything on a gaming PC that you could do on another PC, just A LOT FASTER because it’s a powerful PC. At this point, I got off of the monitor that supported 4K UHD resolutions and started using the Viotek 35″ Curved Gaming Monitor that runs at 144Hz at 2560 x 1080 that is a FreeSync capable monitor but with NVIDIA’s latest driver, now also supported G-Sync.
So let’s start this session off with Shadow of the Tomb Raider.
Shadow of the Tomb Raider played great at 2560 x 1080p, as well it should but of course everything was turned up, all the eye candy you could want. What did you think?
Alright, now that we are done there, let’s check out how the iBUYPOWER Gaming RDY VIG202 takes on Far Cry 5.
Super smooth gameplay there, it was more to show you how it ran with a lot going on within the game. Like before, everything turned up. OK, let’s check out Tom Clancy’s WildLands.
Beautiful graphics, sadly these are some of the only times I get to play, when I am reviewing product but it’s fun for those few minutes. I think I will get into this game soon, but you can see just how well it ran with all of those plants swaying as the wind blows over them. Blood flying everywhere while the bullets find their resting spots.
With all this performance, you may be asking what exactly is in the system and we will check this out now in the next chapter, Parts breakdown.
Continue: Parts breakdown
[nextpage title=”Parts breakdown”]
One of the things that comes with the system, taped onto the side of the system a very important note.

This note is to remind you to remove the foam they included inside of the machine to make sure nothing comes loose during shipping and destroys the inside of the machine. I have seen this many times before, and it’s horrible what can happen, especially if the liquid cooling unit gets damaged. You don’t want to turn on the system with that inside.

The system brings a Windows 10 reinstallation DVD, which is a bit awkward considering the system does not bring an optical drive. In case you end up getting this system, click on the link so that you can check out an affordable LG 8X USB 2.0 DVDRW drive.
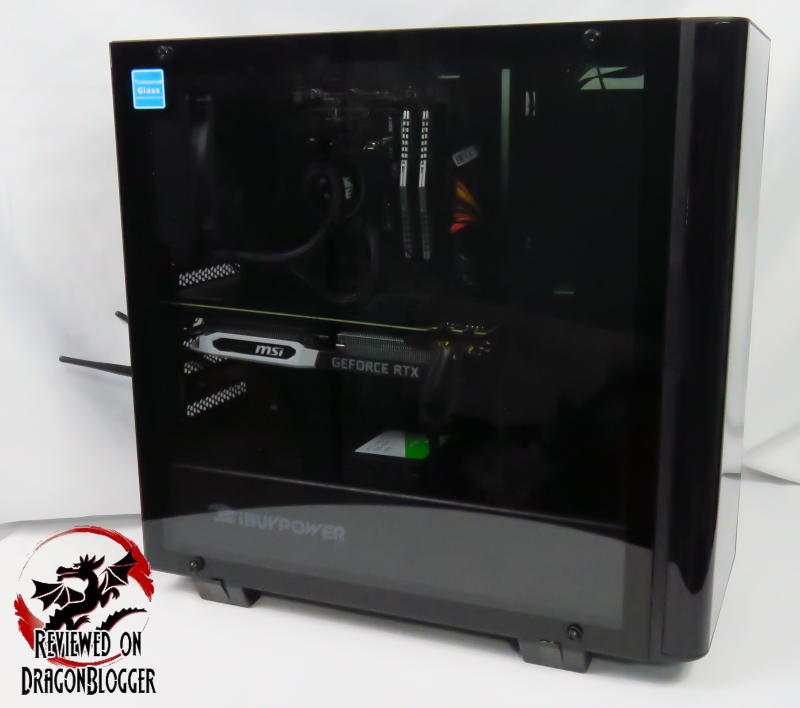
You have already seen the outside of this machine, but I will show you one more time just in case you forgot.
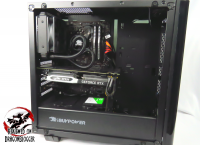
The case is a iBUYPOWER branded Thermaltake View 21 case, made just for iBuyPower. It’s a nice case with a curved front face and the only thing that sets this aside from the regular View 21 is the logo on the power supply shroud and on the top portion of the case which we will see a bit later.
Without the glass side panel one, which each side has, you can see inside of the case.
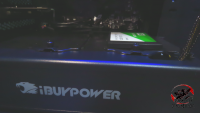
Just above the power supply shroud, you can install 2 x 2.5’ drives, in this case there is already a drive installed.

The drive is a WD Green 240GB SSD, this is where Windows 10 Home gets installed onto, for a bit of a performance boost over standard slower mechanical drives.
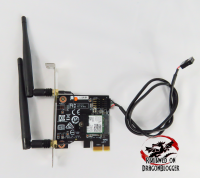
Just above that, we find the system includes a WiFi card. The card is held in a M.2 adapter card making it compatible with the system. The card itself is an Intel Dual Band Wirelss-AC 3168 so not only does it have dual band WiFi but it also has Bluetooth. The card not only takes up a x1 PCI-e slot, but it also uses up a USB 2.0 header. While this may not seem like much for some, others don’t have an option and need Wi-Fi where their desks are and being that this comes with a pre-built machine that you don’t need to wait around to get built, this is a plus.
