
We are influencers and brand affiliates. This post contains affiliate links, most which go to Amazon and are Geo-Affiliate links to nearest Amazon store.
From a first-time builder to an expert, you want a decent video card. A good video card will not only make your viewing experience nicer but it will make what you do on your PC a little smoother. Stepping into the realm of a good user experience, we will today be reviewing the ASRock Challenger D 5500 XT 8GB OC Card, get ready.
Before I start here, when I started to review this card, I thought it was going to be a cut and dry review, but I was so wrong here. 2 newer technologies really changed the way we have to look at things with video cards now, so be prepared. 1 of which kind of has nothing to do with the card, but uses the card and is not incredibly new, but worth noting.
Let’s see all of the specs and features this card provides

- Powered by AMD’s 7nm RDNA Architecture
- GPU Boost Clock up to 1845Mhz
- Game Clock: Up to 1737Mhz
- Base Clock: 1685Mhz
- Memory: 8GB 128bit GDDR6
- 14Gbps Effective
- 1408 Streaming Processors
- Dual Fans with thick heat pipes
- 4 Maximum Displays
- 3 x DisplayPort 1.4 with DSC 1.2a
- Display Ports 1,4 5120×2880 @ 60Hz
- 1 x HDMI 2.0b
- HDMI up to 4096×2160 @60Hz
- Max Digital Resolution 8K HDR @ 60Hz
- Supports 8K Resolutions
- 3 x DisplayPort 1.4 with DSC 1.2a
- Die casting metal backplate
- Supported Features
- Radeon FreeSync 2 HDR
- Intelligent Image Sharpening Technology
- PCI Express 4.0
- Backwards compatible with PCI Express 3.0
- Streaming up to 8K
- Asynchronous Compute
- Radeon Rays Audio and True Audio Next
- Radeon Image Sharpening
- Fidelity FX
- Radeon VR Ready Premium
- Radeon Boost
- DirectX 12 Optimized
- HDR Ready
- Radeon Relive
- Supports ASRock Tweaker
- Recommended 500Watt Power Supply
- 1 x 8Pin PCIe Power Connection
A long list of features and specifications I know, but it’s good to know what you are getting yourself into. With that, let’s get into the box.
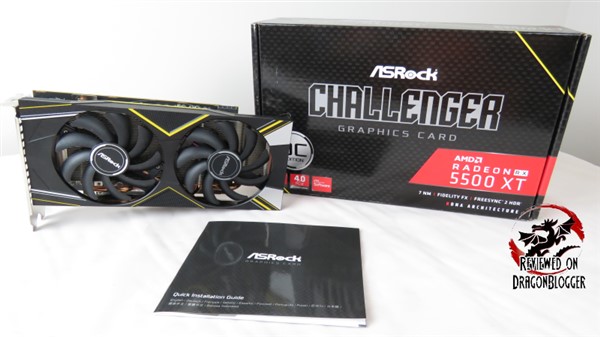
The box is a bit bare, looking like only the essentials here being the video card and the manual, but that’s OK. We are going to start off with the Quick Installation Guide. It’s handy to have but you don’t have to worry about it as the guide is very basic. In this review I will walk you through step by step on how to install the ASRock Challenger D.
As I showed you in the unboxing, there was not a lot in the box but we got to the purpose of this review, the ASRock Challenger Radeon RX 5500 XT 8GB OC card. Let’s jump into taking A Closer look at the card.
Continue To: A Closer look at the card
[nextpage title=”A Closer look at the card”]

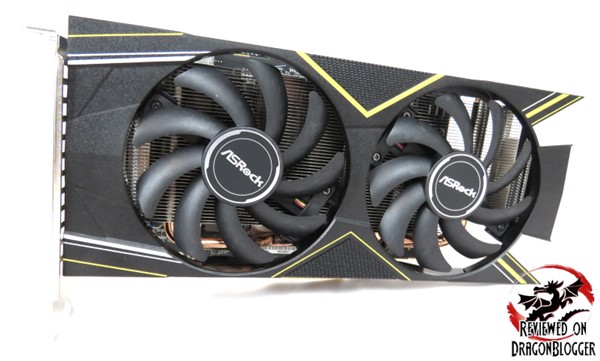
The Challenger series is ASRock’s budget line, but just know that budget does not mean bad, in this case it just means the card has no bling so it does not cost as much. Some people want the bling and in that case ASRock does offer their Phantom and Taichi lines, maybe for another review. We are focusing here on cards for those of you on a tight budget or maybe those of you that don’t really focus on the looks of the PC, but rather the performance.

With no bling and only 2 fans, this helps keep the card small. The card comes in at 9.49 inches in length. This includes the PCI bracket.

Even though the card comes in at 9.49, the PCB itself, is only 7.5 inches and this plays in the cards favor. The other 2 inches of the card outside of the PCB is the heatsink and 2nd fan to help keep the card cool.

5 inches in depth including the PCI bracket, the card itself is a little under 4 inches.

And just over 1.5 inches in width, the card is not a beast in size, but it might just be in performance, we will go over that all here.

The card comes packed with 3 x Display ports at 1.4b with DCS 1.2 and 1 x HDMI port coming in at 2.0b. You can use all 4 displays at once to enjoy a full digital resolution of up to 8K at 60hz.
As you saw, the card does not come with additional adapters to switch between Display Port or HDMI over to DVI or VGA. This is one of the main reasons I do an unboxing, to show you everything that comes in the box. The fact that it does not come with these adapters help keep the price point low, but I mention it so that you are prepared.


Laying the card down and taking a shot from the rear we can see the extent of the heatsink and its exposed copper pipe. We can also see the single 8Pin PCI Express connection.

Yes, the connection needs to be plugged in order to power the card. The card requires a 450Watt Power supply, but ASRock recommends a 500Watt. We can also see here the Challenger branding. Kind of hidden really in all that the card has to offer.

Along the top of the card, a basic ASRock logo with a metal black plate, just to help keep it a little cooler. The Challenger is not meant to be gaudy.

The underside, where you insert the card into the PCI-e slot exposes the 3 large copper pipes helping to keep the card cool as well as the fins in the larger heatsink.

The bottom of the card, we can see the 2 x 82.55 mm fans branded ASRock. The card itself has a few little lines to distinguish it, but not too much, but at least you know it’s an ASRock.

I have shown you everything there is about the card itself, other than how to install it and it’s performance. In this next chapter we will go into installing the ASRock Challenger D RX 5500 XT 8GB OC Card.
Continue To: Installing the ASRock Challenger D RX 5500 XT 8GB OC Card
[nextpage title=”Installing the ASRock Challenger D RX 5500 XT 8GB OC Card”]
Like with most things, installing a video card is really easy…. If you have done it before. If you have never done it, it can be the most difficult thing, we’ve all been that that point at some time in our lives. In this video, I will show you how to install it step by step and I explain everything to you so that you can have the confidence to do it on your own.

That was a lot easier than you had imagined right, I hope this helped. In that video, I showed you how to install the card, potentially removing an older card if you had one, then installing and connecting the card to power.
After installing the card, I show you how to remove the older driver and install the latest and greatest and give you a quick tour of the Radeon Adrenalin 2020 Edition software and driver bundle. I did use the latest driver, while many have had issues with it, I have not. I would like to believe DDU is the reason I have not, a clean install of windows helps as well but that could be a bit drastic.
Alright with that, I am sure you want to know how well it performs, I do too. Let’s get into some Benchmarks, Performance, Temperatures and Power Consumption.
Continue To: Benchmarks, Performance, Temperatures and Power Consumption
[nextpage title=”Benchmarks, Performance, Temperatures and Power Consumption”]
So that you can compare the results with your own system, below you can find a list of all the components I am using in this review.
- Viotek G35DR 35″: http://geni.us/6LrGJ
- Asus ROG Strix XG438Q: https://geni.us/BBMh3P
- Intel Core i9 9900K Processor: https://geni.us/0PrCbaY
- Arctic Liquid Freezer II 360: https://geni.us/CmNtJA
- EVGA Z390 Dark Motherboard: https://geni.us/UmV6tf
- ASRock Challenger D Radeon RX 5500 XT : https://geni.us/TvdErm
- WD Black SN750 1TB: https://geni.us/8sqXFs
- Montech Air 900 ARGB White Mid-Tower PC Chassis: https://geni.us/kcq3
- Patriot Viper Gaming RGB DDR4 DRAM 3200MHz 16GB Kit: https://geni.us/URlI8
- Samsung 850 EVO 500GB SSD: https://geni.us/QTA2
- WD Black PCI-e NVMe 512GB SSD: https://geni.us/mMNLde
- Windows 10Professional: https://geni.us/TbOpq
- EVGA SuperNOVA 1000 G+ Gold Power Supply: https://geni.us/IVoE
Here are the specs on the ASRock Challenger D Radeon RX 5500 XT brought to you by GPU-Z.
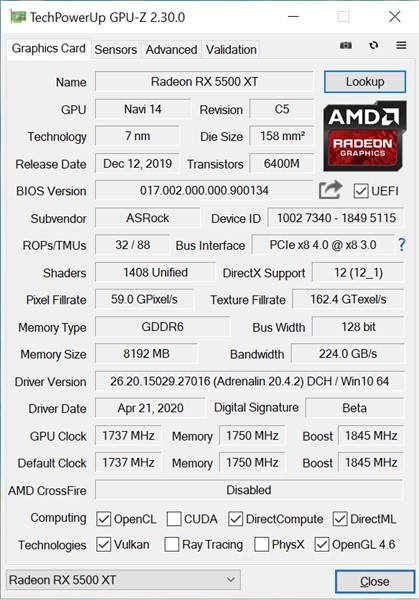
You can see here, I used the AMD Adrenalin 20.4.2 driver set. I originally used 20.4.1 and I was done with the review, but I was using the Viotek GN35DR since my previous 4K monitor had died. The Viotek GN35DR is a great monitor but is not a 4K monitor, so I bought the Asus ROG Strix XG438Q, a 4K monitor that also offers Freesync 2 and 120hz,… so I had to re-review EVERYTHING.
I used GPU-Z to gather temperatures of the card. Since the 5 series was released, AMD has added a new temperature sensor reading named HotSpot. I will include both readings in my findings.
I’ve read different theories online and even received information from a board partner on what the HotSpot temperature was, but I wanted to get something directly from AMD. Asking AMD about the Hotspot, they provided this information.
The junction temperature on modern AMD Radeon graphics cards such as the RX 5000 Series use a sophisticated network of on-die sensors to accurately report the hottest spot across the entire GPU die. Hence, the Junction temperature is also known as the ‘Hotspot’ temperature as Iggy from ThisBytesforYou is asking. Edge temperatures are usually reflective of the average temperature around the edge of the die.
The “GPU Hotspot” readout in GPU-Z is reflective of the junction temperature. The “GPU Temp” reflects the Edge temperature of the die. Older graphics cards that feature a single temperature sensor report this ‘edge’ value shown in GPU-Z. However, we continue to allow applications to read and publish this legacy ‘edge temperature’ to provide a fair comparison point vs. older Radeon and competitive GPU’s that don’t have the ability to report (and act on) the Junction or Hotspot temperature.
AMD Radeon graphics cards utilize the junction temperature to continually optimize gaming, thermal and acoustic performance in real time, enabling higher levels of performance and efficiency over basing these optimizations on ‘worst case’ edge temperature alone. The maximum safe operating junction temperature for the current lineup of 7nm Radeon graphics products is 110C.
I hope this helps to clear the air a little on exactly what it was, I know it did for me, thank you AMD. So, if this HotSpot edge temperature has you a little worried, you can relax a little, just focus on the GPU Temperature.
To measure wattage, I use the Kill A Watt by P3 International, it works great and is very affordable. In my benchmarks, when you see power consumed, this is how much power the entire system is consuming, including the video card, not just the video card.
Also to mention, the ambient temperature in my office is 66°F/18.8°C.
Here are the games and programs I use for benchmarking.
- FutureMark’s 3DMark Fire Strike
- FutureMark’s TimeSpy
- Metro Exodus
- Assassin’s Creed Odyssey
- Shadows of the Tomb Raider
- Far Cry 5
- Tom Clancy’s Ghost Recon Wildlands
Alright, let’s get started.

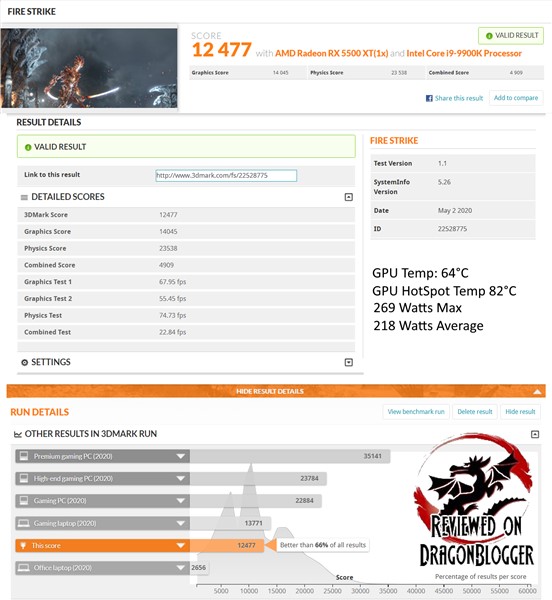
The overall 3DMark FireStrike 1.1 score was 12,477 and the hottest the card reach was 64°C on the GPU and 82° at the HotSpot while consuming on average 218 Watts. The card did pretty well.
This is a budget card and still scored 66% higher than all other results while keeping a decent temperature. While keeping on its own here, let’s see how this card handles DX12 on TimeSpy since it does tout DX12 Ultimate support.
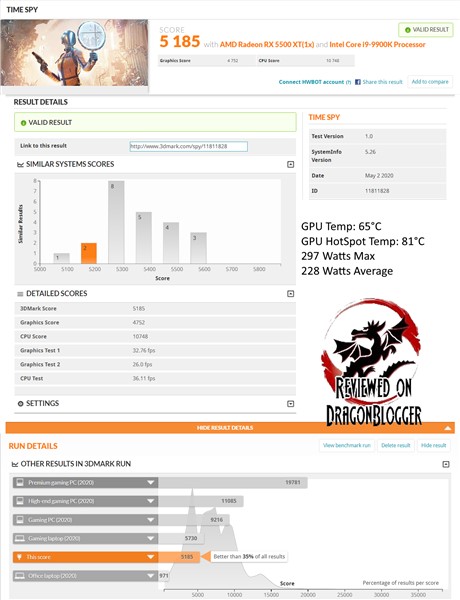
TimeSpy, while a little more rough on cards fared pretty well here. The ASRock Challenger D Radeon RX 5500 XT is not meant for 2K or 4K, it pumped out enough to be 35% better than all other results. The 5500 XT is meant to be a decently priced power house for 1080p and with that, it scored an overall 5,185 3DMark score.
The card kept its cool on the GPU at 65°C while on this packed system, consuming on average 228 Watts.
Enough with synthetics though, let’s get to some gaming.

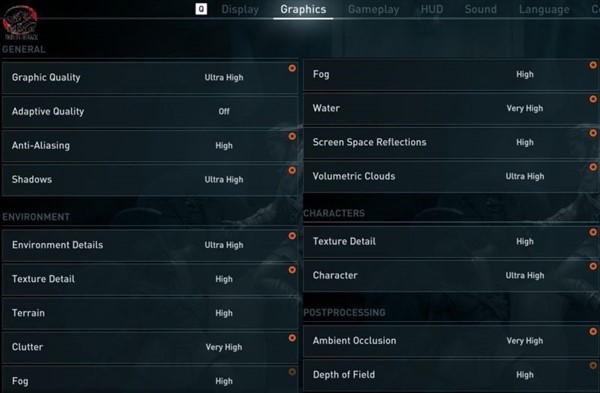
For all games in this review, I keep the settings the same, changing only the resolution. I raise the settings to Ultra or the highest possible changing the resolutions to 1920×1080, 2560×1440 and finally 3840×2160.
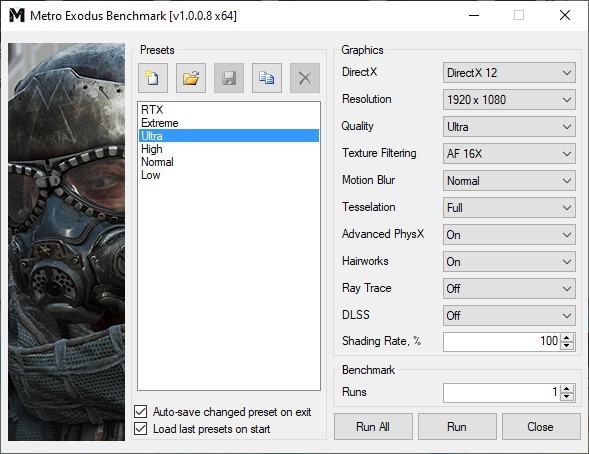
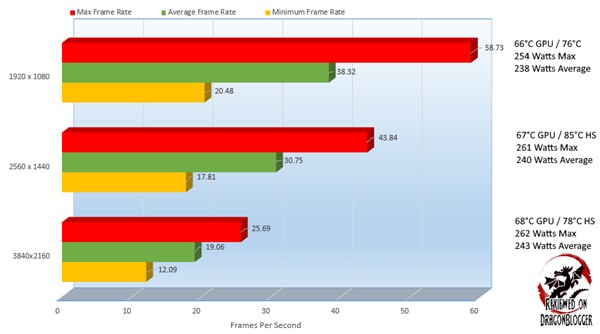
At 3840×2160, Metro is a slide show. The Challenger D 5500 XT came in at 19.06 FPS with the system consuming on average 243 Watts while keeping a cool 68°C. At 2560×1440, coming in at 30.75 at 67°C taking up only 240Watts on average, 1.24% lower power consumption delivering almost double the frames per second and here is where you start seeing the benefits of FreeSync. At 1920×1080, there is a 21.92% improvement going up by 8 frames per second, it still is FPS wise unplayable.
Prior to having the Asus ROG Strix XG438Q, a FreeSync 2 capable monitor, it would be totally unplayable, but with FreeSync 2, even unplayable FPS becomes so much more tolerable. While Metro itself is a GPU slayer up the chain, the benefit’s become much more apparent as we progress in this review.
Continue with me in this adventure, as we jump over to Shadow of the Tomb Raider and see what Laura has in store for us.

Again, here I keep the same settings, changing only the resolutions
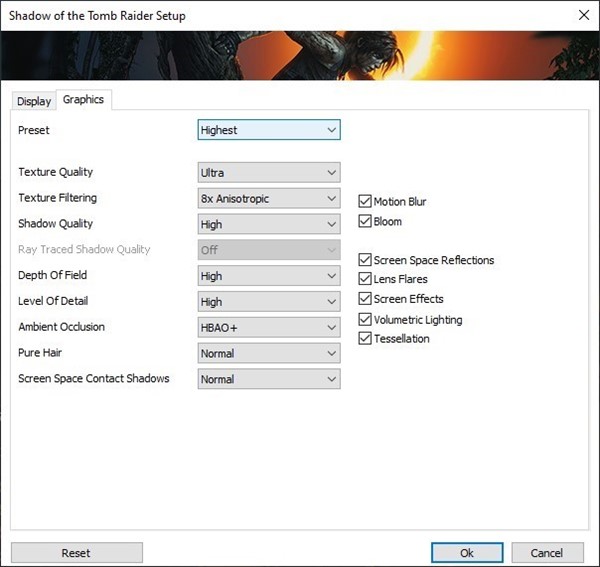
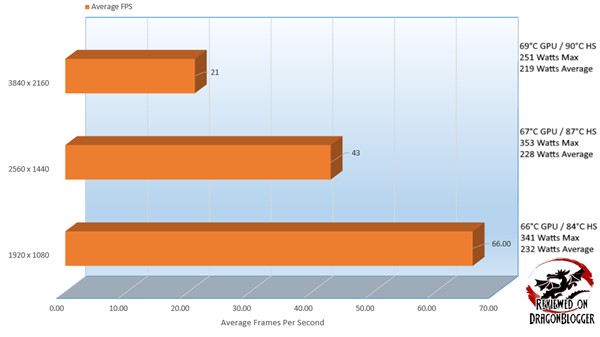
At 3840×2160, it came in at 21 Frames Per Second, this is understood to be 100% unplayable coming it 69°C and consuming on average 219 Watts. Watching this benchmark portrayed a different story. It was not a flip book, it was so close to 60FPS, it was very smooth with only slight stuttering.
Coming in at 68.75% higher than it previous resolution of 3840×2160, at 2560×1440 we reached 43 FPS at a cooler 67°C, a 2.94% improvement though eating up 228 Watts. The card now being able to manage a bit better its resources, will consume more power, in this case 4.03% more power. Here FreeSync again paints a different story than simple FPS can calculate. 43 FPS with FreeSync2 is 100% playable and no brief stutters were observed.
At 1920×1080, even with FreeSync off, we come in at a 100% playable 66 FPS. Here the card gobbled up 232Watts on average while keeping a nice and cool 66°C, 1.50°% lower than at 2560×1440 at 4.44% better than at 4K.
Laura showed us the benefit’s of a decent card and opens our eyes a little to FreeSync, but will Assassins Creed Odyssey show us the same?

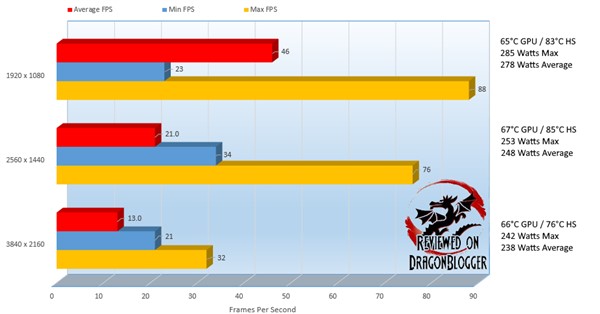
Assassins Creed Odyssey, like Metro is a GPU killer. At 3840×2160, it came in at a totally unplayable 13 FPS, not even FreeSync could save it. While it did not look like it was playing at 13FPS, it was bad. At this resolution, we sucked up 238 Watts on average while keeping a nice and cool 66°C.
At 2560×1440 there was a 47% improvement over 4K at 21 frames per second. While not optimal, you could squeeze in some gameplay here, but I would not recommend it. The card did reach 1°C over 4K and did come in consuming 10 more watts on average. 2K here was better, but not ideal.
At 1920×1080, the Challenger D came in at 46 frames per second. FreeSync again saves the day here making it very playable, but numbers don’t lie, it was not perfect. The card did come out 3°C cooler than at 2K but took it to the next level on power consumption, consuming 11.41% more power than at 2K. I am thinking here and for Metro, to keep it at High. Let me know what you think in the comments.
Coming from a bleak future, let’s break down to a more simple time with FarCry5.

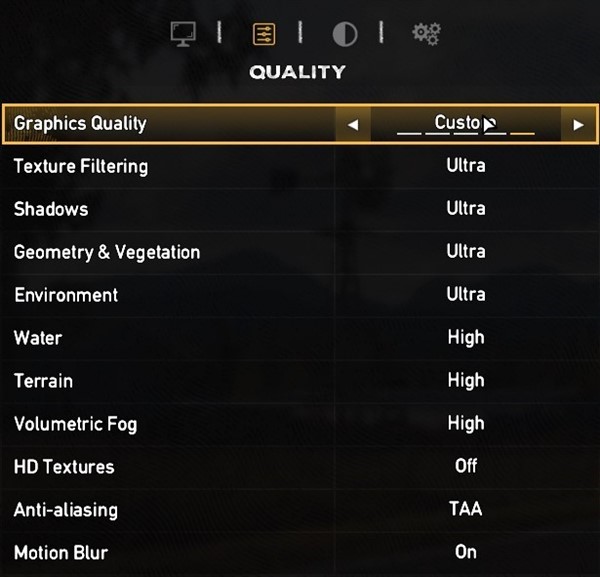
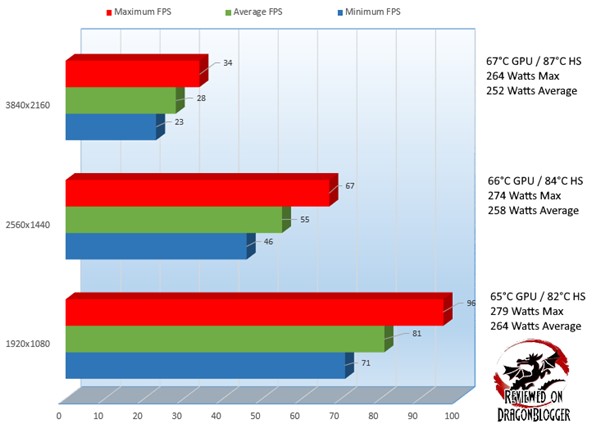
FarCry 5 was night and day in performance here, at 4K, we came in at 28 frames per second and yet with FreeSync, it was totally playable, there may have been a hiccup though I did not notice it. Coming in at a chilly 67°C the card nibbled away at 252Watts on average.
Bringing up the rear, at 2560×1440, we came in at a very respectable 55 FPS, 65% better performance that at 4K and even 1°C cooler. The card did consume 2.35% more power than at 4K coming up at 258 more watts on average. At 1920×1080, the card jumped up in performance by 18.92% over 2K at 81 FPS. It again dropped by 1°C but power consumption raised over 2K by 2.99%, but with that performance, it is forgivable.
Down in the South with FarCry 5, we can see how performance was favored but let’s see what going further south to Bolivia in Tom Clancy’s Ghost Recon Wildlands brings us.

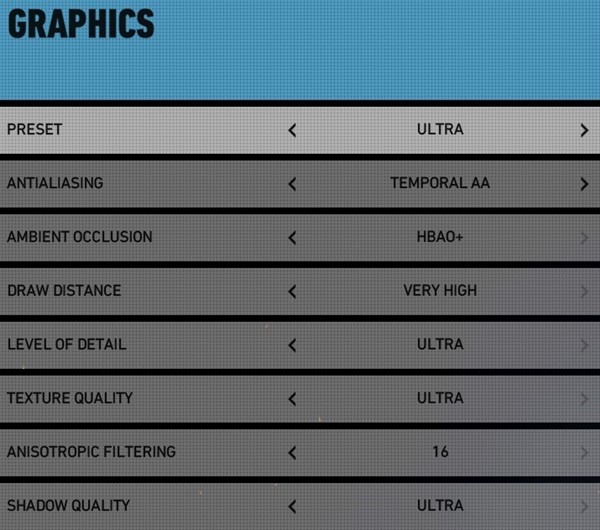
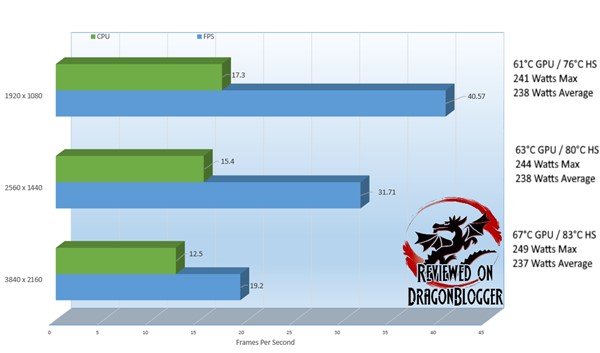
While not as harsh, WildLands can still beat up a GPU. At 3840×2160, the card on paper chugged along at 19.2 frames per second, on the screen however it ran a lot more smoothly than it seems. While not 100% smooth, a few pauses were noticed, it was anything but 19.2 in regards to FreeSync. Here the GPU kept a cool 67°C consuming on average 237Watts.
At 2560×1440, there was a 95.62% improvement over 4K, coming in at 35.4 frames per second and while you and I would assume that was not playable, there were no noticeable skips or lags, it was very smooth. At 2K, power consumption was only up 1Watt over 4K and actually came in 4°C cooler.
At 1920×1080 we came in at 40.57 FPS, a 24.52% improvement over 2K. Here it actually consumed the same amount of power that 2K did and was 2°C cooler, a nice trade off there. Like you might have guessed already though, while 40.57 FPS is not ideal, the performance was 100% smooth. AMD really hit the nail on the head with FreeSync and getting all you can from your card, in this case the ASRock Challenger Radeon RX 5500 XT 8GB OC.
So I have been talking about the wonders of FreeSync and all, though you may not have it yet, I get it. This is a 1080P card, and many of you play at 1920×1080 so I thought it would be best to show you how well this card handles 1920×1080 first hand. In this chapter, Gamplay and Performance, we go over some game play to see how well it does.
Continue To: GamePlay and Performance
[nextpage title=”GamePlay and Performance”]
We all have different needs for our PC’s, gaming, video editing, workstations or plain old simple web browsing. While an on dye GPU can do it all, you will hurt in any other than web browsing. This card even though it is a budget card works pretty well on the rest. Benchmarks aside, this chapter will show you how the card performs in games. I test 6 games for you:
- Shadow of the Tomb Raider
- Fortnite
- Ghost Recon Break Point
- Borderlands 3
- Doom Eternal
Check it out and let me know what you think
In these games, I am not only playing the games, I show you gameplay at 1080P with AMD’s RDNA2 architecture utilizing AMD FidelityFX, Radeon Image Sharpening and their Vulkan support. I would have loved to have shown you the benefits of FreeSync2 but since I was using the AverMedia 2 Plus LiveGamer Portable to capture it all with zero performance hit, it did not work.
Another thing you might be sensitive about is noise and in this video I show you how loud it is idle and a few different variations of noise in between, all the way to 100%.
It stays pretty cool right? Well, in order to be able to modify the fan speeds and all, I used ASRocks own Tweaker Utility. This utility not only raises and lowers the fan speeds, but it can actually overclock the card as well and set your own automatic fan curve.
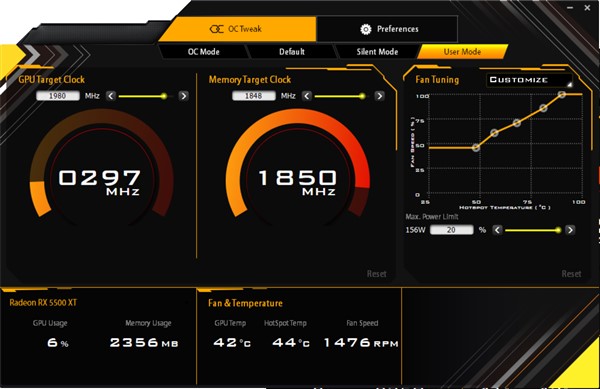
This is the utility at a glance when you first open it up.
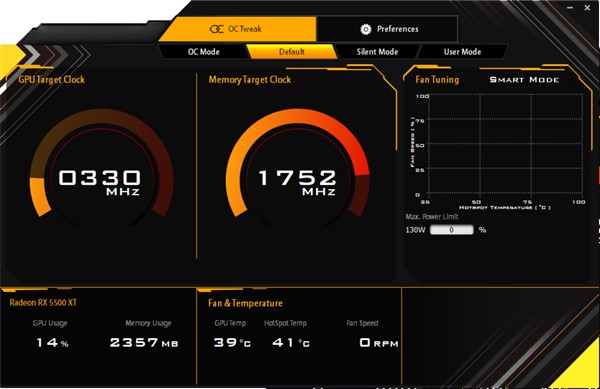
It shows you your current GPU clock speed, memory clock speed, GPU and memory usage as well as temperatures and fan speed. It also has a few options.
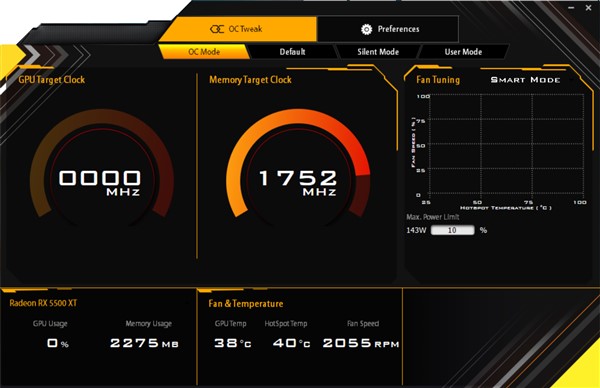
OC Mode allows you to overclock your card with its own preset overclock which raises the Max Power Limit by 10%.
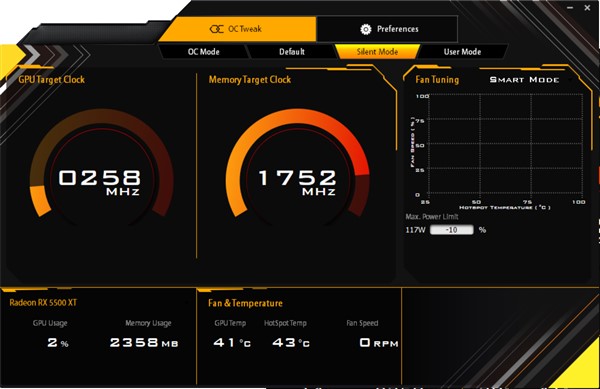
Silent Mode, which lowers the Max Power Limit by 10%, helping to keep your card cooler but will also lower performance a bit.

In User Mode, you can adjust the GPU and Memory Target Clocks and adjust the Max Power Limit. Fan Tuning, available in all modes, allows you to set the fans to Smart Mode, Fixed mode and Customize.
Smart mode adjusts the fans itself based on GPU and memory temperature. Fixed Mode, allows you to set the fan speeds to the way you prefer and only at that fixed speed and finally customized. Customized, allows you to set up your own fan curve, this is a great feature.
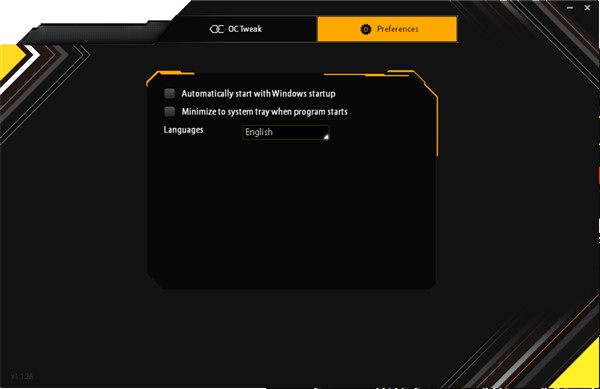
The preferences tab, allows you to automatically start the program when windows start and then also allows, if you do allow this to start up with windows, to minimize the window so that you don’t have to do it manually. It also allows you to set up your own language preference.
So since we have the option here to overclock, I did and I wanted to show you the performance differences between the overclock and stock versions. I did not spend a ton of time overclocking here, due to a few issues on time, I had to scale back a bit but I did get a decent overclock, you do have more room to play with it.
If you are interested, you can find the ASRock Tweaker software here: Click Here
Here, you will notice I overclocked the card to 1980Mhz on GPU, 1848Mhz on Memory and played a bit with the fan curve as well as the Max Power limit. With that, I have given you a sample of what’s to come in the next chapter. Let’s jump over to Performance comparisons and overclocking.
Continue To: Performance Comparisons and Overclocking
[nextpage title=”Performance Comparisons and Overclocking”]Overclocking isn’t for everyone, and while I am decent at it, I don’t like to do it everyday. The reason behind overclocking is simple, you wan’t to squeeze every penny out of your investment and you want all of the performance that might be hidden. There are some of us that do it just for fun though. No worries, I got you covered here.
Here is the comparison from stock clocks to the overclock.
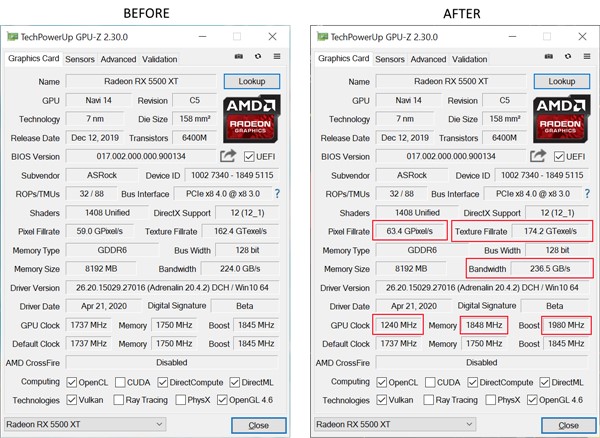
You can see there is a 7.19% increase in the Pixel Fillrate, a 7.01% increase in the Texture Fillrate, a 5.43% increase bandwidth and some action over here on the GPU, Memory and Boost clocks. The GPU Clock reading being lowered, that is GPU-Z reading it incorrectly since the clock does go all the way down to 0 at idle. Let’s jump into the benchmarks and see what this increase has done for performance, temps, power consumption and more.
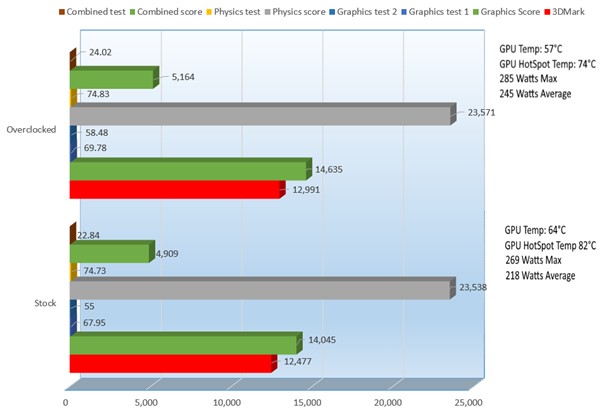
Since I did play with the fan curve and voltages, the temperatures and power consumption here are basically irrelevant but still good to note. The main performance indicator here that most pay attention to is the overall 3DMark score. We can see at stock, originally we came in at 12,477 but at the overclock, we came in a 12,991, almost 13K from a simple overclock, we gained overall a 4.04% improvement. Let’s see how this works in TimeSpy.
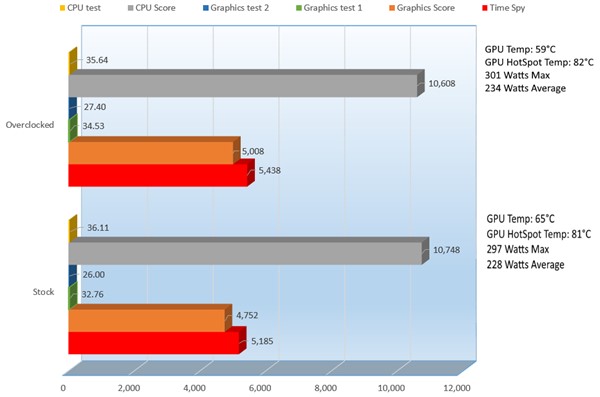
On TimeSpy, breaking it down again to the main score, we can see at stock we received 5,185 3DMarks and on the overclock, we jumped up to 5,438. While not a huge gain, it was slightly higher than FireStrikes, we gained 4.76% performance here on the overclock.
In FireStrike and TimeSpy, we did not focus on the other scores, though they are relevant and important and they are still listed here if you are curious. Let’s see if we see any similar results in the remaining tests.
In the interest of time and this being a 1080P card, we will stick to 1080P results in the overclocking portion.
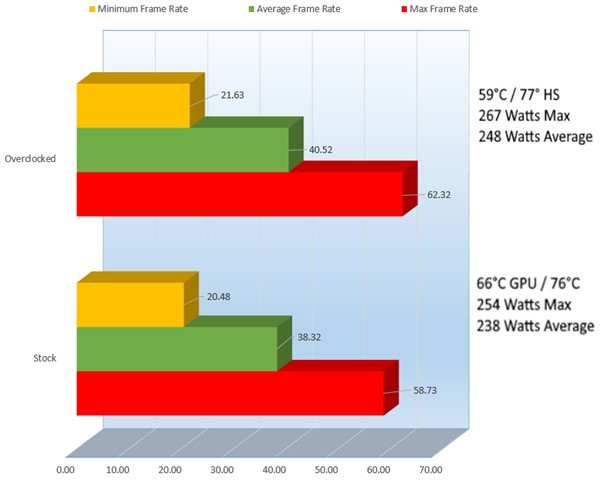
At 1920×1080 on average, we can see there was a 5.58% improvement in performance going from 38.32 frames per second to 40.52 FPS. This benchmark crushes even the top video cards, so it is impressive that a budget card can do this much.
Still not perfectly playable, at ultra settings this card is doing pretty decent. So let’s see how Tomb Raider does.
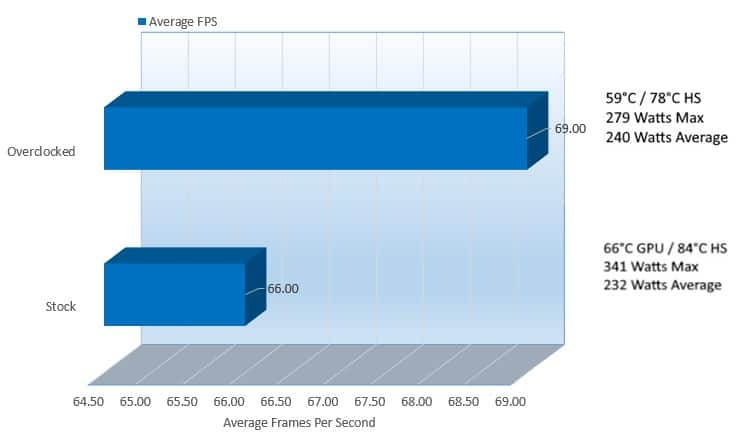
Shadow of the Tomb Raider treated us well at stock at 1920×1080 but it gave us a little more here providing a 4.44% improvement in performance from 66 frames per second to 69.
At the highest settings, this game is 100% playable with or without FreeSync and that’s a great thing. Let’s see how Assassin’s Creed Odyssey handles this overclock.
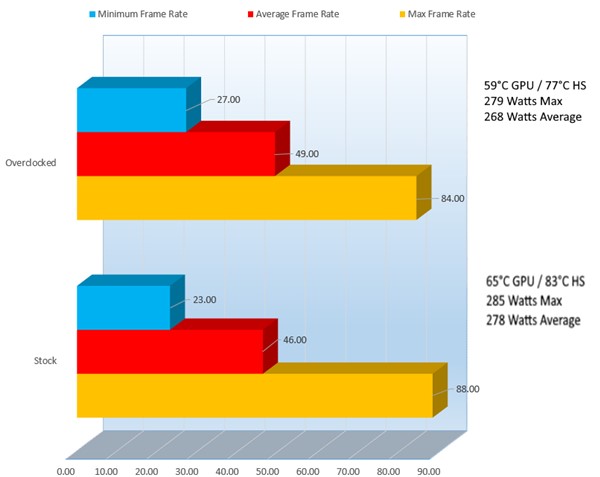
On the brutal Assassin’s Creed Odyssey we get a little bit of a leg up here, breaking what seems to be a trend. If you noticed before, there has been a +4% trend but here we can see a 6.31% increase in frames per second at 46 to 49FPS. The closer to 60FPS the better and a 6.31% improvement helps tons. What more can you do with your overclocks? Will FarCry further break that +4% increase in performance?
FarCry5 was already playable at 1920×1080, here we can see a 4.82% improvement. Again, not a bad thing, just back to our +4% limitation. Let’s see if Tom Clancy’s Ghost Recon Wildlands does better.
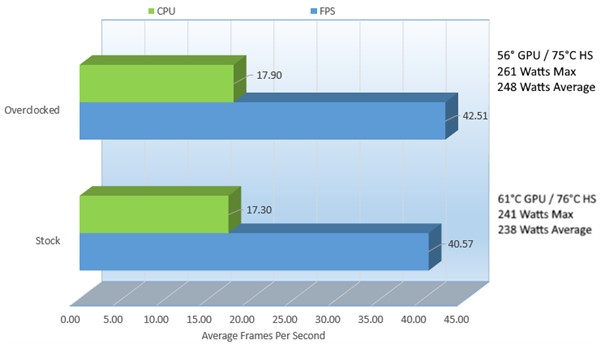
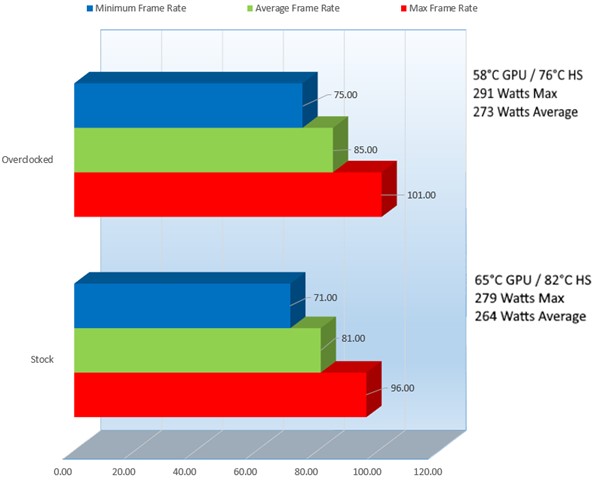
At 1920×1080 we can see in Wildands a 4.67% increase in performance over it’s stock counter part at 40.57 overclocked to 42.51 frames per second.
With anywhere between a 5 and 7% increase in the overclock, we can see between 4 and 7% increase in performance. This performance will also come from your overall system, not just graphics, so a slight bump in CPU and Memory performance will help here as well.
With all this, let’s jump to the final chapter in this review, my Final Thoughts and Conclusion.
Continue To: Final Thoughts and Conclusion
[nextpage title=”Final Thoughts and Conclusion”]
AMD and ASRock have done some nice things with this card, AMD with their GPU and ASRock with their implementation. This 8GB card, while shorter than most (PCB wise) has extended it’s footprint rather than promoting a smaller card (potentially catering to the ITX form factor) extends it’s heatsink, helping to keep the card cool while keeping noise levels down. The open card design allows heat to rise through the card upwards naturally without exhausting it sideways allowing for higher default GPU clock speeds.
You can check out the entire review in video if you prefer
I reviewed previously the Sapphire Pulse RX 5500 XT 8GB card, and it did very well but sadly I cannot compare the 2 since I used older drivers and had to return the Sapphire card. The 2 traded blows if you could correctly compare 2, maybe I can compare them together at a later point.
One thing I did like about Sapphire is TRIXX Boost. While kind of cheating, TRIXX Boost allows you to get in between resolutions to get more performance out of the card. ASRock provides ASRock Tweaker utility that allows you to overclock and it does a pretty decent job, both TRIXX and Tweaker get you performance. The problem with TRIXX is that while it does work on a lot of games, it won’t work on all, a good overclock will work on everything.
Without saying more, let’s jump into the Pros and Cons and get back to my thoughts afterwards.
Pros
- Tons of ports to fit almost any monitor (except DVI and of course VGA but you can buy adapters)
- 8Gigs is a bit much, but more is better right?
- Supports 4 Simultaneous displays
- FreeSync2 Support
- Supports DX12 Ultimate and Vulkan
- 0DB Fan mode
- Dual BIOS support
- Great performance from a budget card
- Ideal for 1080P gaming
- Short Metal Backplate
- Shortened card (PCB wise) but with 2 fans and longer heatsink allows for better cooling
- ASRock does offer and ITX version but with 1 x fan.
- Current pricing is one of the most affordable RX 5500 XT 8GB cards out there.
Cons
- No RGB (Not included in final results but had to mention it)
- Cost to performance might be a little high.
- Does not include VGA or DVI adapters (but that may bring up the cost)
8Gigs on a budget 1080P card might be overkill, but it does allow for room to throw in more eye candy at a lower performance cost. Lack of RGB might be bad for some, but it’s OK with me. While I don’t have DVI on my monitors any longer, it is a budget card, so DVI might be in someones line up.
The open air design to me is a great option, since it allows for quicker heat dissipation, but it does add length to the card. The length allows for that second fan to be there, so that is a bonus. The temperatures and overclocking represented above show you that there is room to overclock and room to get hotter if needed, but you can just throw in a more aggressive fan curve.
With all that taken into account I feel I should give the ASRock Challenger D Radeon RX 5500 XT 8GB OC Graphics Card a 9.3, Editors Choice award. Congratulations ASRock.

One of the more affordable RX 5500 XT solutions out on the market with a great design and performance to match. I am very price sensitive, but this one just got everything right.
Back to: Intro
We are influencers and brand affiliates. This post contains affiliate links, most which go to Amazon and are Geo-Affiliate links to nearest Amazon store.
I have spent many years in the PC boutique name space as Product Development Engineer for Alienware and later Dell through Alienware’s acquisition and finally Velocity Micro. During these years I spent my time developing new configurations, products and technologies with companies such as AMD, Asus, Intel, Microsoft, NVIDIA and more. The Arts, Gaming, New & Old technologies drive my interests and passion. Now as my day job, I am an IT Manager but doing reviews on my time and my dime.