
We are influencers and brand affiliates. This post contains affiliate links, most which go to Amazon and are Geo-Affiliate links to nearest Amazon store.
Review of the Dell XPS 13 Ultra-portable laptop
Ultra-Portable Laptops were supposed to be our answer to Ultra heavy laptops of yesteryear, but they more often than not lacked the power of their bigger and heavier counterparts. It’s the year 2016 and it’s time to put away childish thoughts of years passed, put away childish toys and step up our games and with that our way of thinking. Amazing things just keep growing smaller as technology improves, but does the Dell XPS 13 redefine our thoughts and stigma’s of small and weak or does it strengthen them?
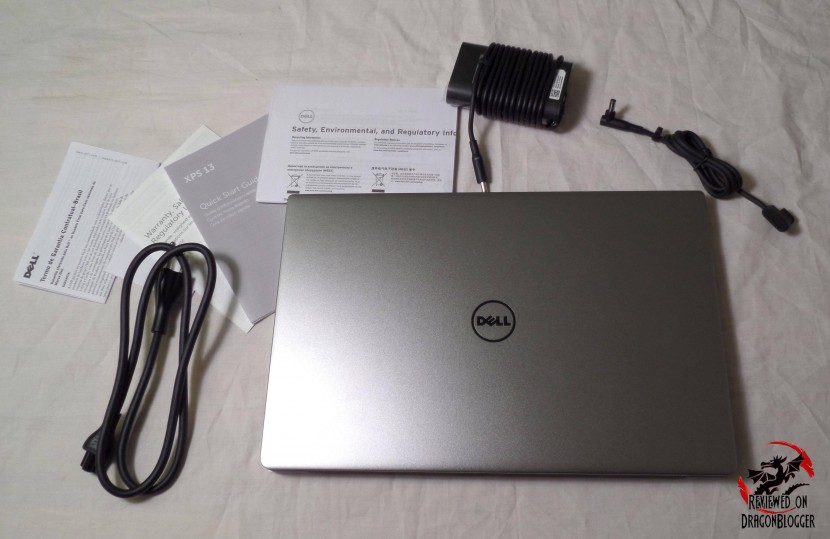
It’s got some pretty decent components, but I will get to that in a second, let’s check out the unboxing and a brief overview first.
So obviously, it’s an Ultra-portable laptop, almost Ultrabook, but I will list the specs of this particular machine.
Specifications
- Case: CNC machined aluminum
- Carbon fiber composite palm rest with soft touch paint
- Keyboard: Full size, backlit chiclet keyboard
- Touchpad: Precision touchpad
- Processor: Intel Core i7-6500U 4MB Intel Smart Cache
- Memory: 16Gigs LPDDR3-1866MHz
- Video Card: Intel HD 520 Graphics
- Camera: Integrated Widescreen HD 720p webcam with dual array digital microphones
- Wireless: Intel DW1820A 2×2 802.11ac 2.4/5GHz
- Bluetooth 4.1
- Hard Drive: Samsung PM951 M.2 PCIe NVMe Samsung 1TB SSD
- Display: 13.3’ QHD+ 3200 x 1800 InfinityEdge touch display
- Edge-to-edge Corning Gorilla Glass NBT
- OS: Windows 10 Professional 64Bit
- Ports:
- 2 x USB 3.0
- 1 x Thunderbolt 3
- 5mm headphone jack
- Slots:
- 3-in-1 Card Reader (SD, SDHC, SDXC)
- Noble Lock Slot
- Battery: 56wHR, 4-Cell Battery
Wait,… and this is an Ultra-Portable Laptop? 16Gigs of RAM, Core i7 processor, with a PCI-e SSD, that seems pretty nice. Isn’t this an Ultrabook though?
We can’t call it an Ultrabook for a few reasons. First off, Intel trademarked the term “Ultrabook” as a high-end subnotebook with low powered Intel Core processors, SSD’s, extended battery life (5 hours), resume from hibernation times of 7 seconds and some software and firmware requirements. As time and technology progressed, those specifications grew to include longer battery life (5 to 9 hours) 6 hour HD video playback, 9 hour Windows idle time, 3 second resume from hibernation, 80MB transfer rate, touch screen, WIDI and a few other software and firmware requirements.
With that, this laptop aims at destroying those “specifications” and giving you more. Let’s see if it accomplishes them. Let’s see what she can do.
Continue: Graphics Benchmark
[nextpage title=”Graphics Benchmark”]
Let’s start off the benchmarking with the tried and true, 3DMark by our friends at Futuremark.

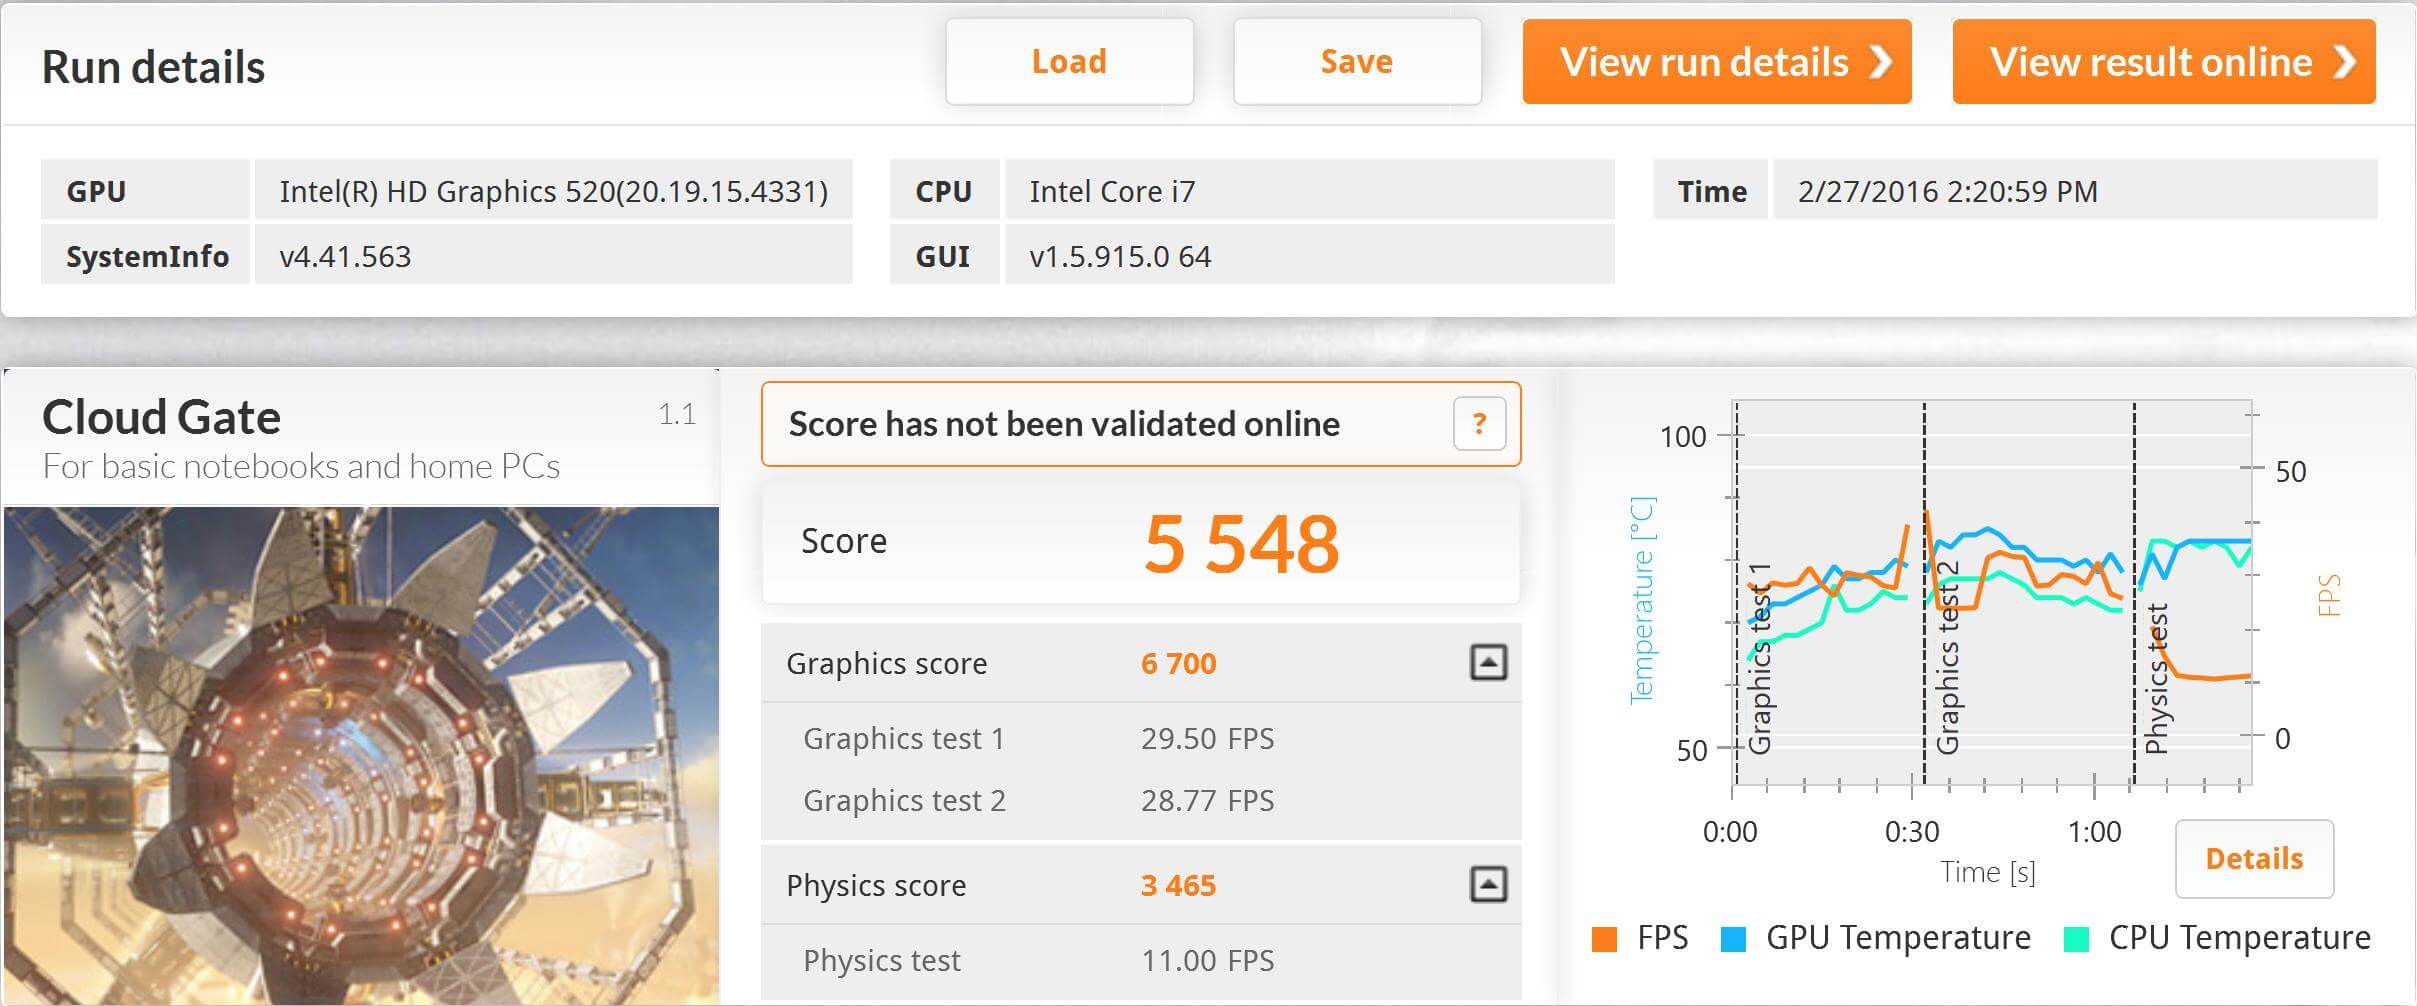
On 3Dmark’s Cloud Gate, it scored 5,548, with a Graphics score of 6,700 and a Physics score of 3,465. What exactly does this tell us, nothing without a direct comparison, unfortunately I don’t have a machine to compare with but Futuremark helps us a bit with this
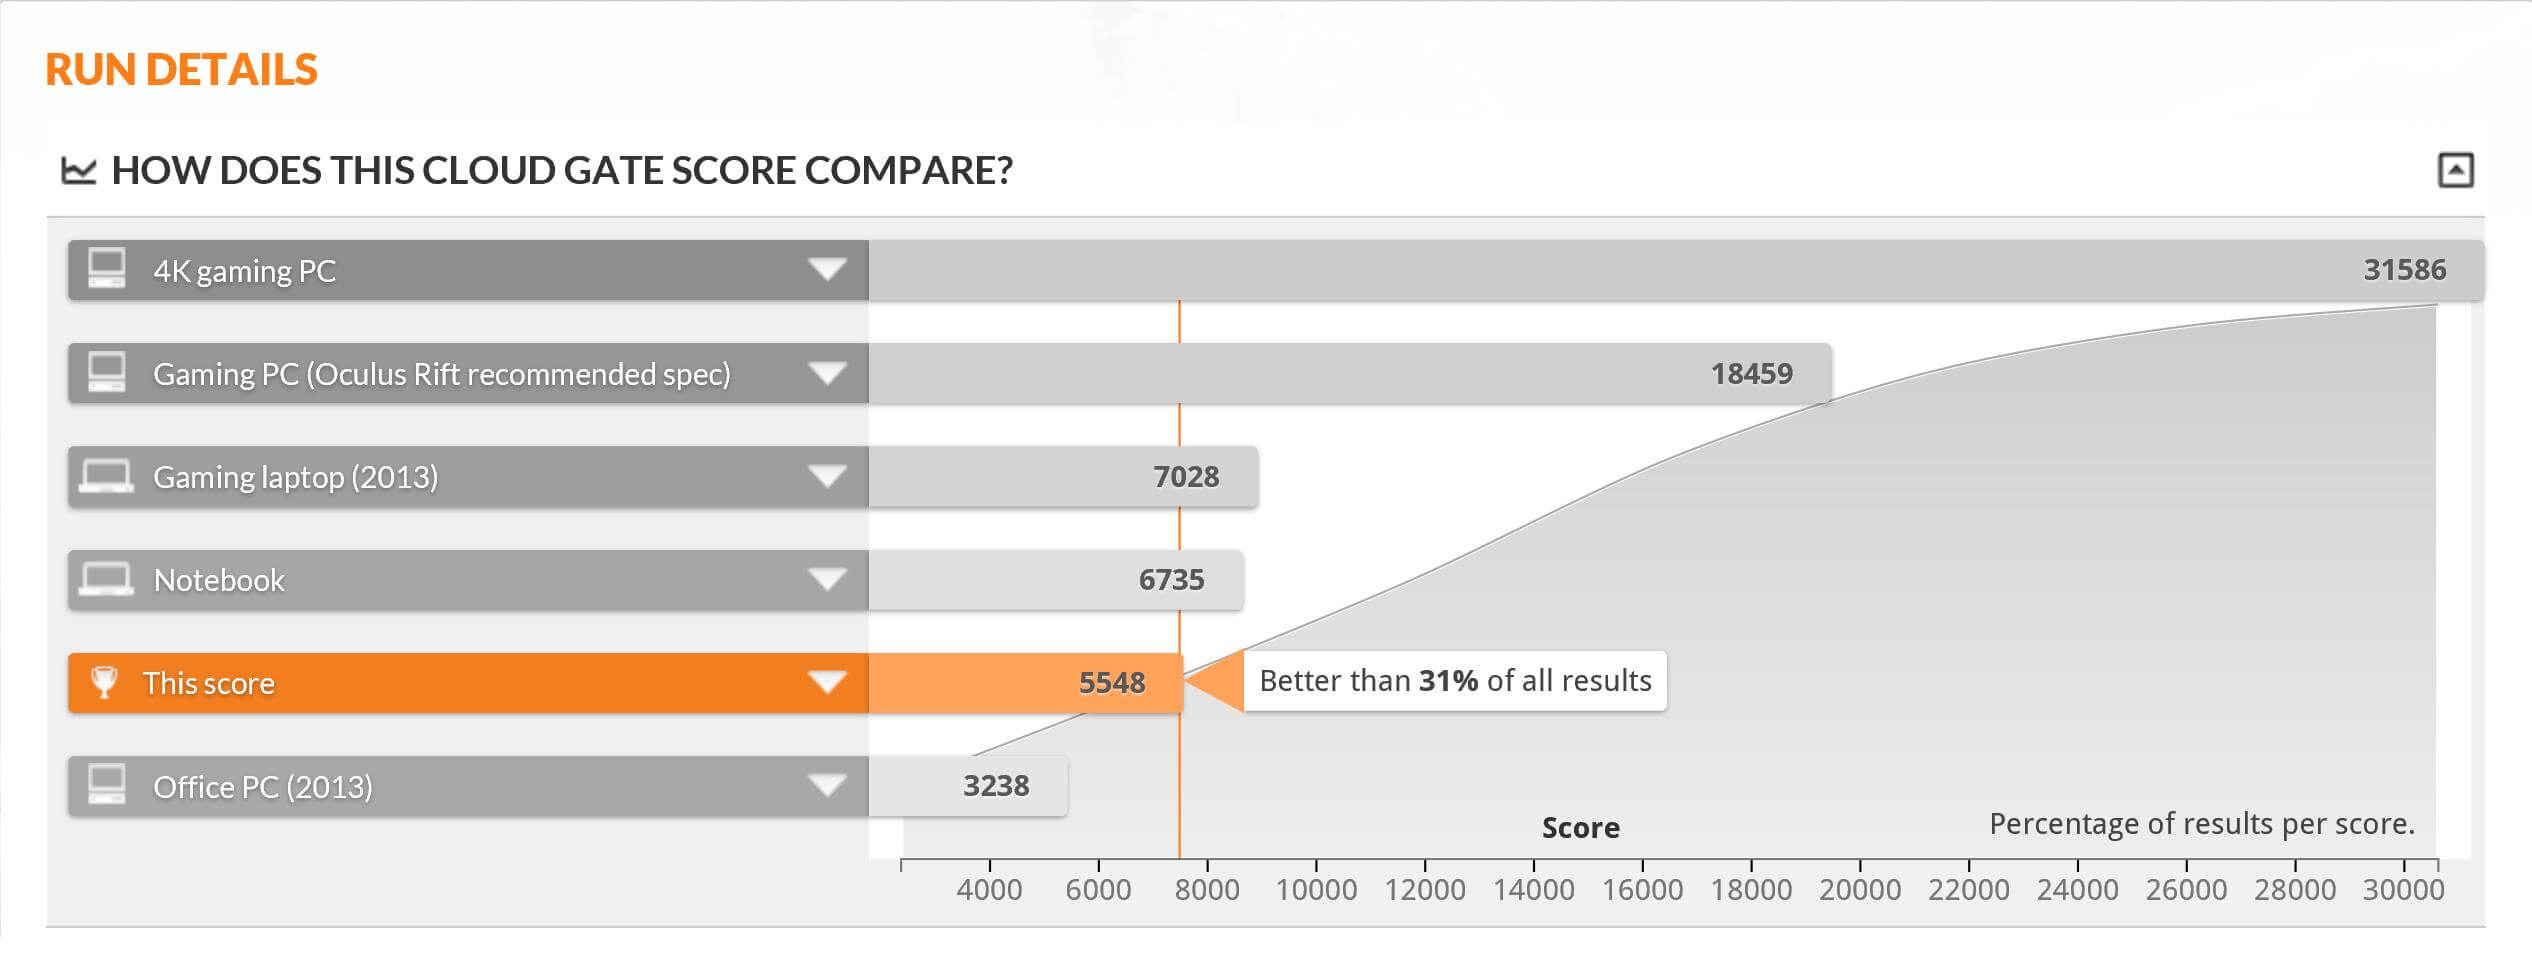
So this reads a standard Notebook would have scored around 6,735 but at 5,548 it is still better than 31% of all other results and it is not really a notebook, but an ultra-portable notebook. Also, this outperforms a 2013 Office PC by 52.58%. I know, this still doesn’t tell us much, but let’s continue with the benches to give you a better feel for what this can or can’t do.
OK, let’s check out some games. For this test, I will use THIEF, Tomb Raider and Metro Last Light. First up is Mero Last Light.

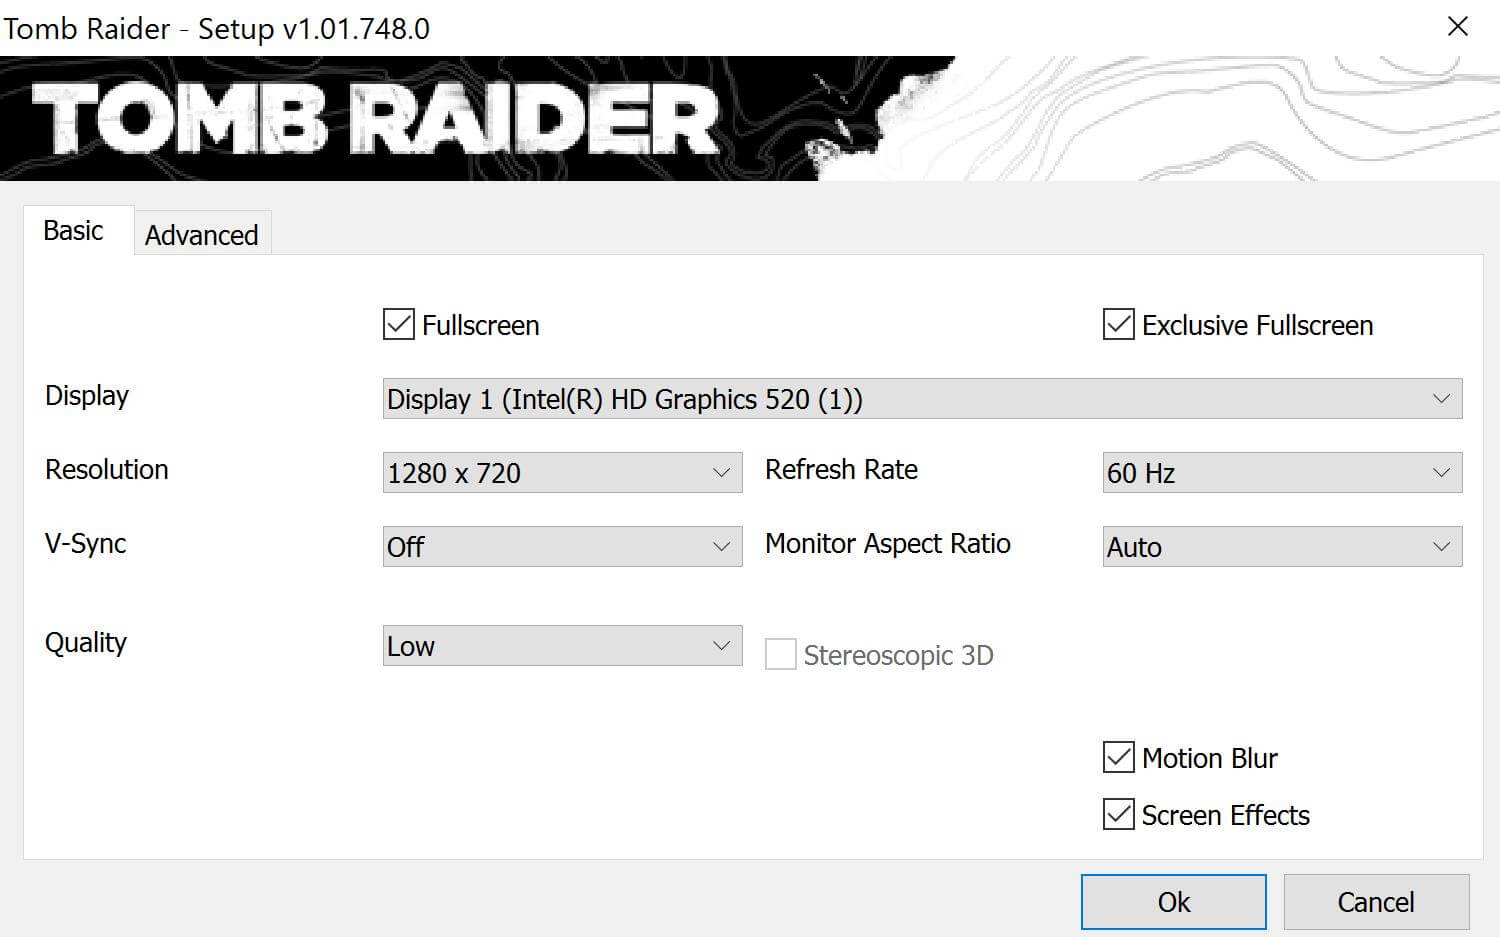
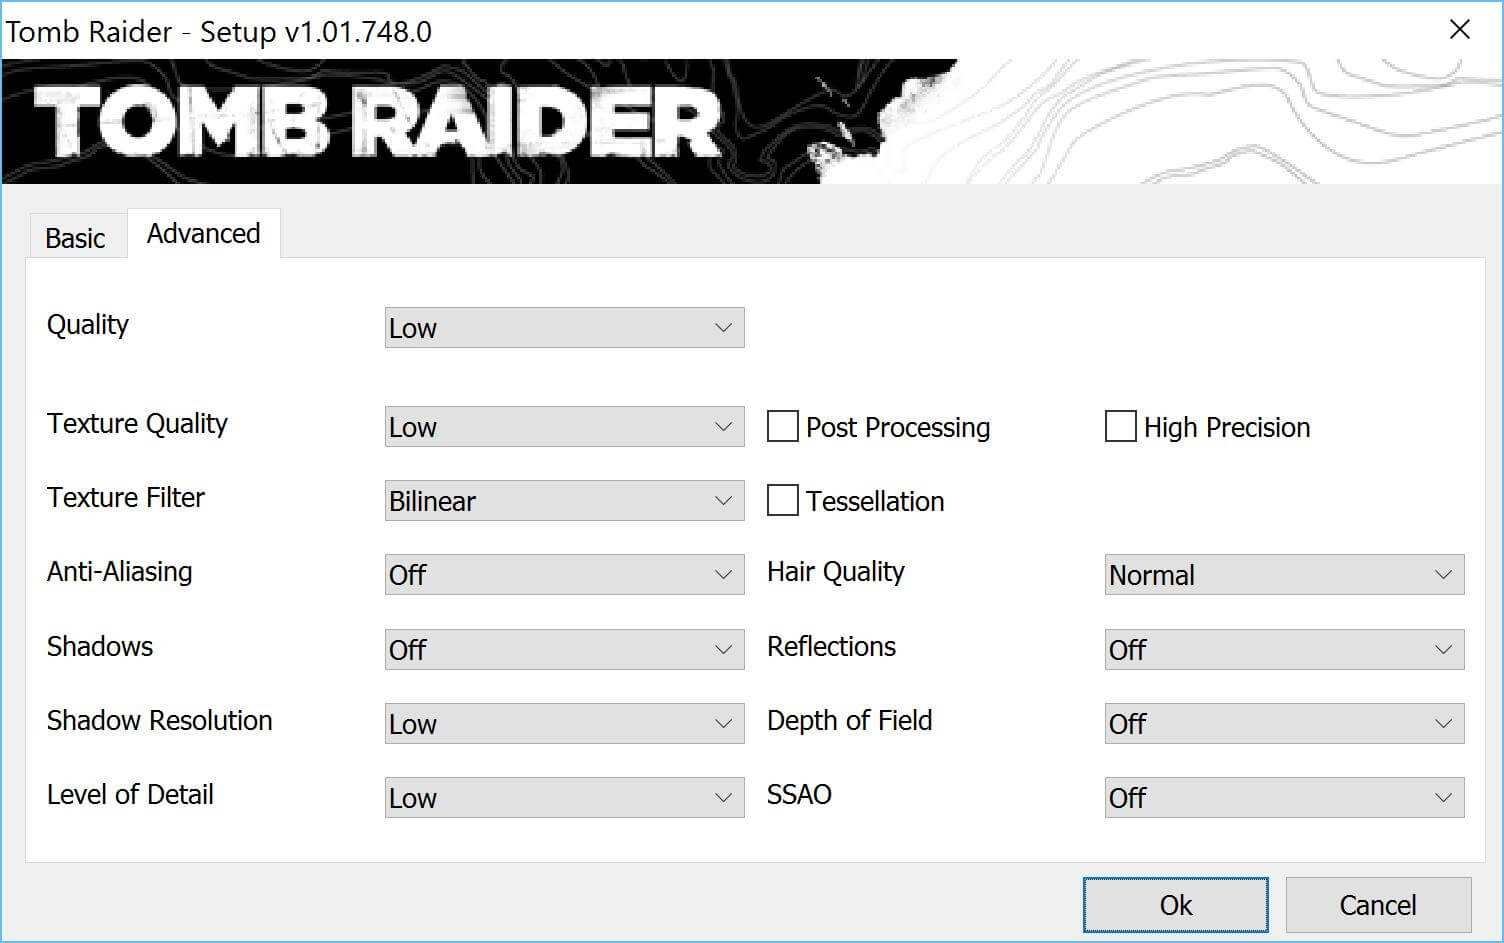
Metro Last Light is known to be a system slayer and I expect it to do the same here, but I wanted to show you how it performs on it. For this set of tests, I will be running the test on the following settings, only changing the resolutions.
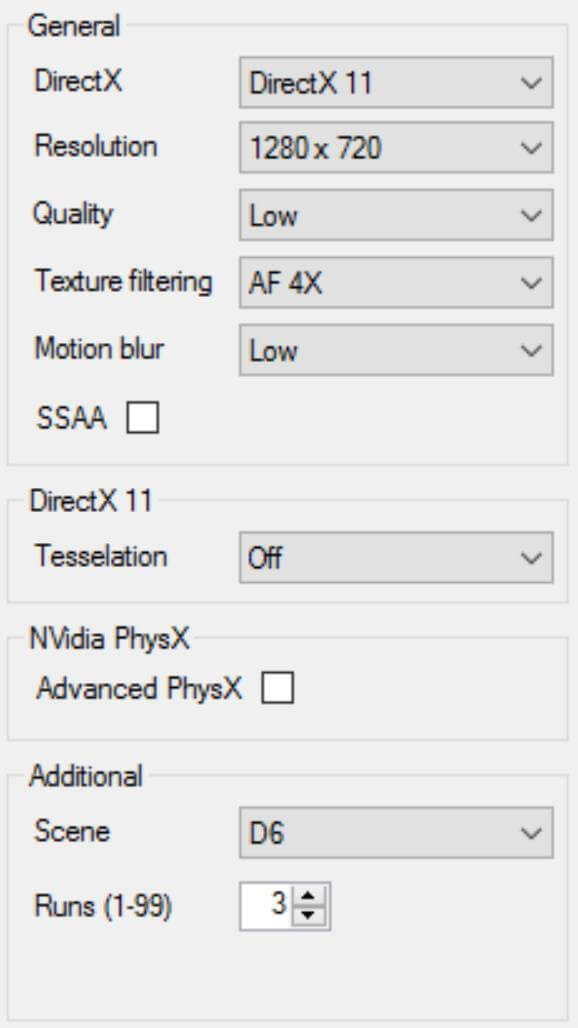
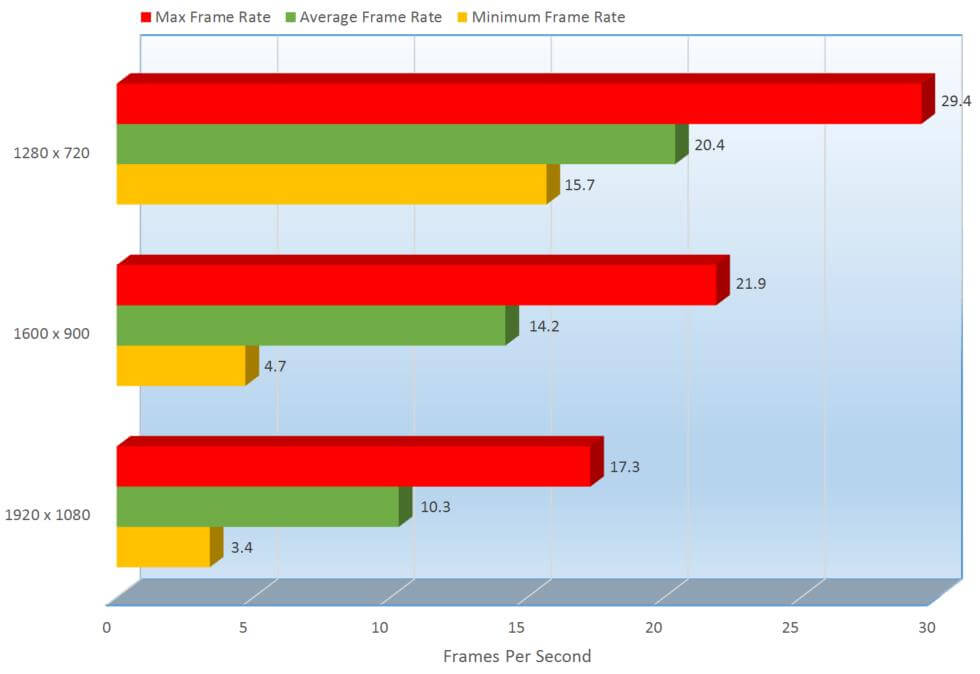
I tested using 1280 x 720, 1600 x 900 and 1920 x 1080.
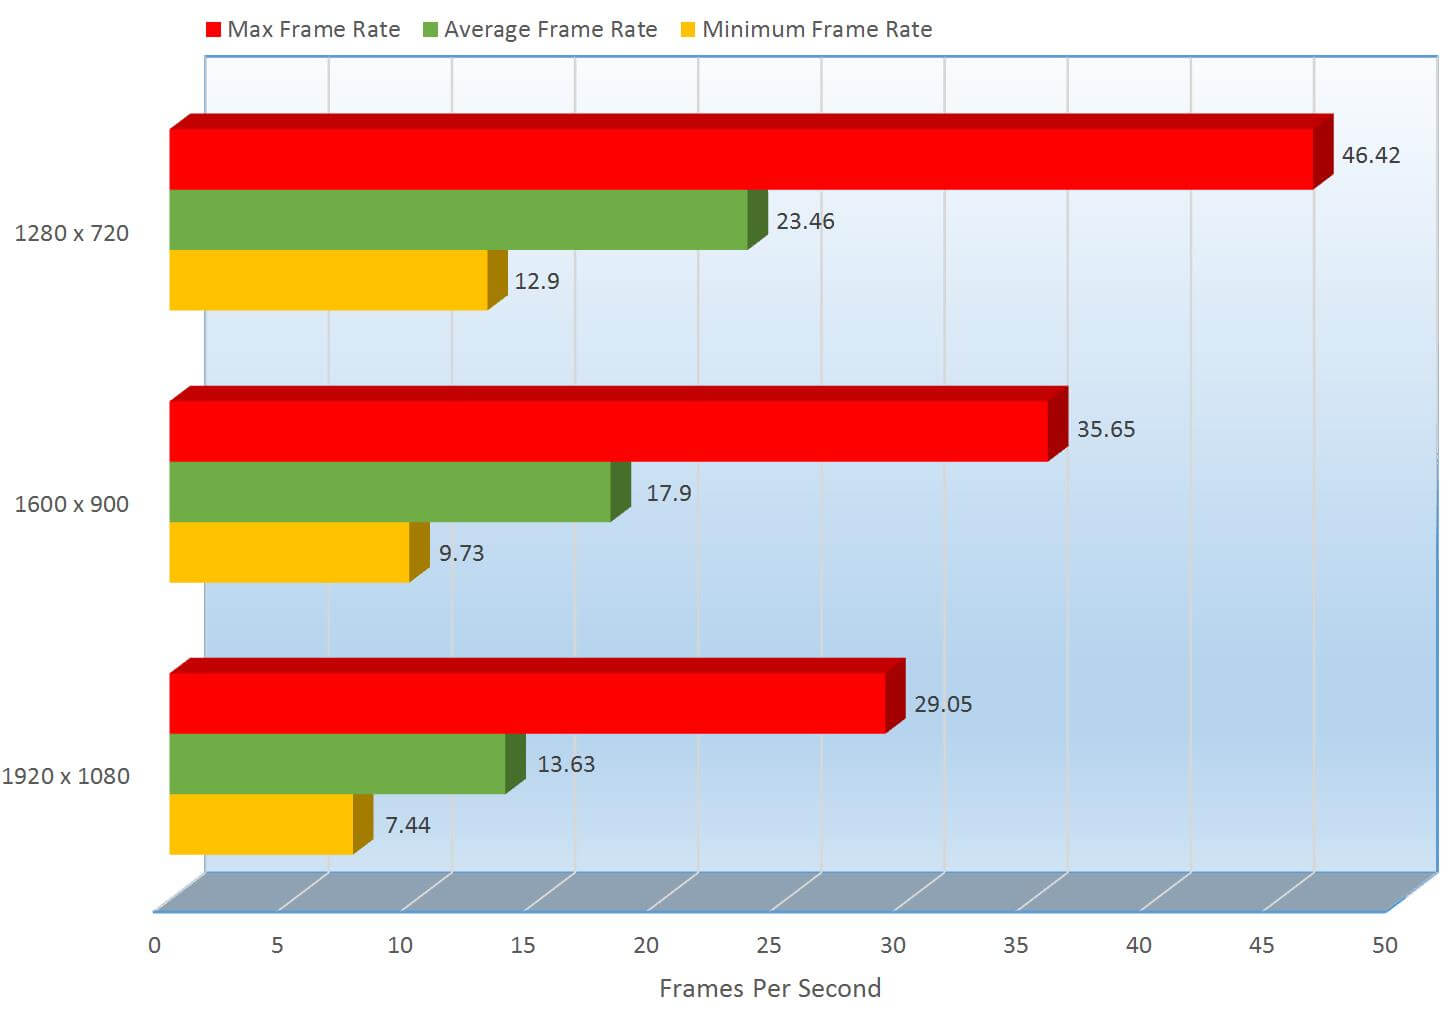
So this ultra-portable can display resolutions of up to 3200 x 1800, but of course using the Intel HD graphics, you cannot expect too much. The average frames per second; the only real performance metric you should look at is where you want to look into. At 1280 x 720 it gets to 23.46 FPS, 26.89% higher than the 1600 x 900 FPS coming in at 17.9 FPS and 53% faster than 1920 x 1080’s 13.63 FPS.
Now, even though 23.46 FPS seems incredibly low, I did play it at 1280 x 720 and it actually did play very well. I will get more into gameplay a little later in this review, but let’s see what THIEF shows us.

Like Metro Last Light before it, THIEF was run with a set of standardized display settings only changing the resolutions on each test, of which I will show you below
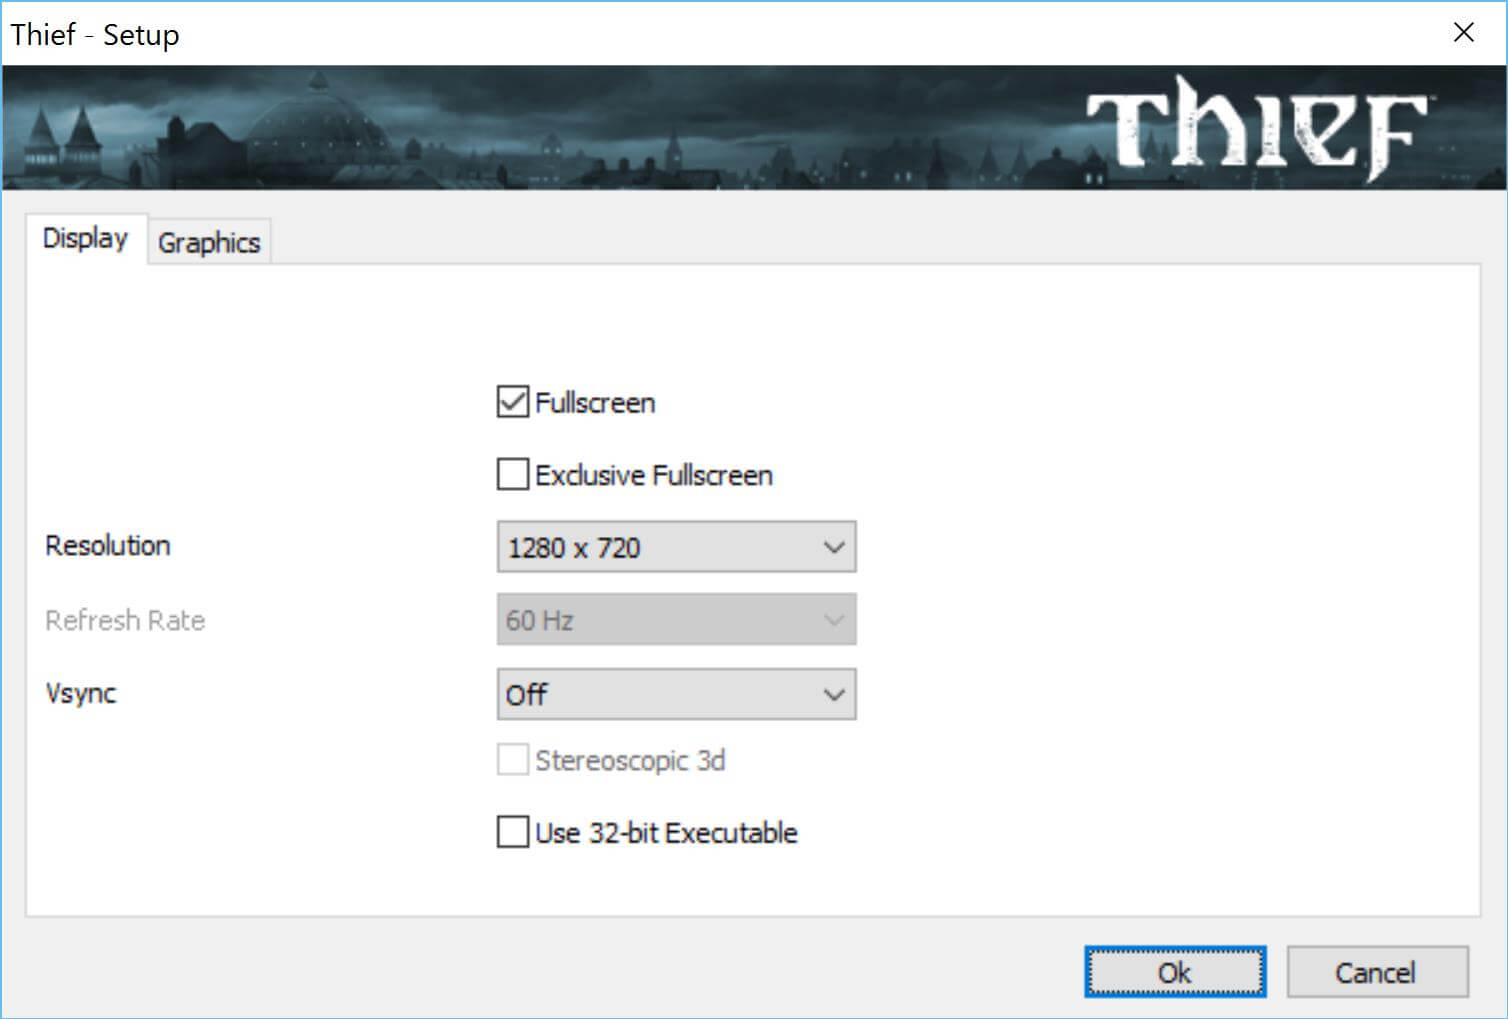
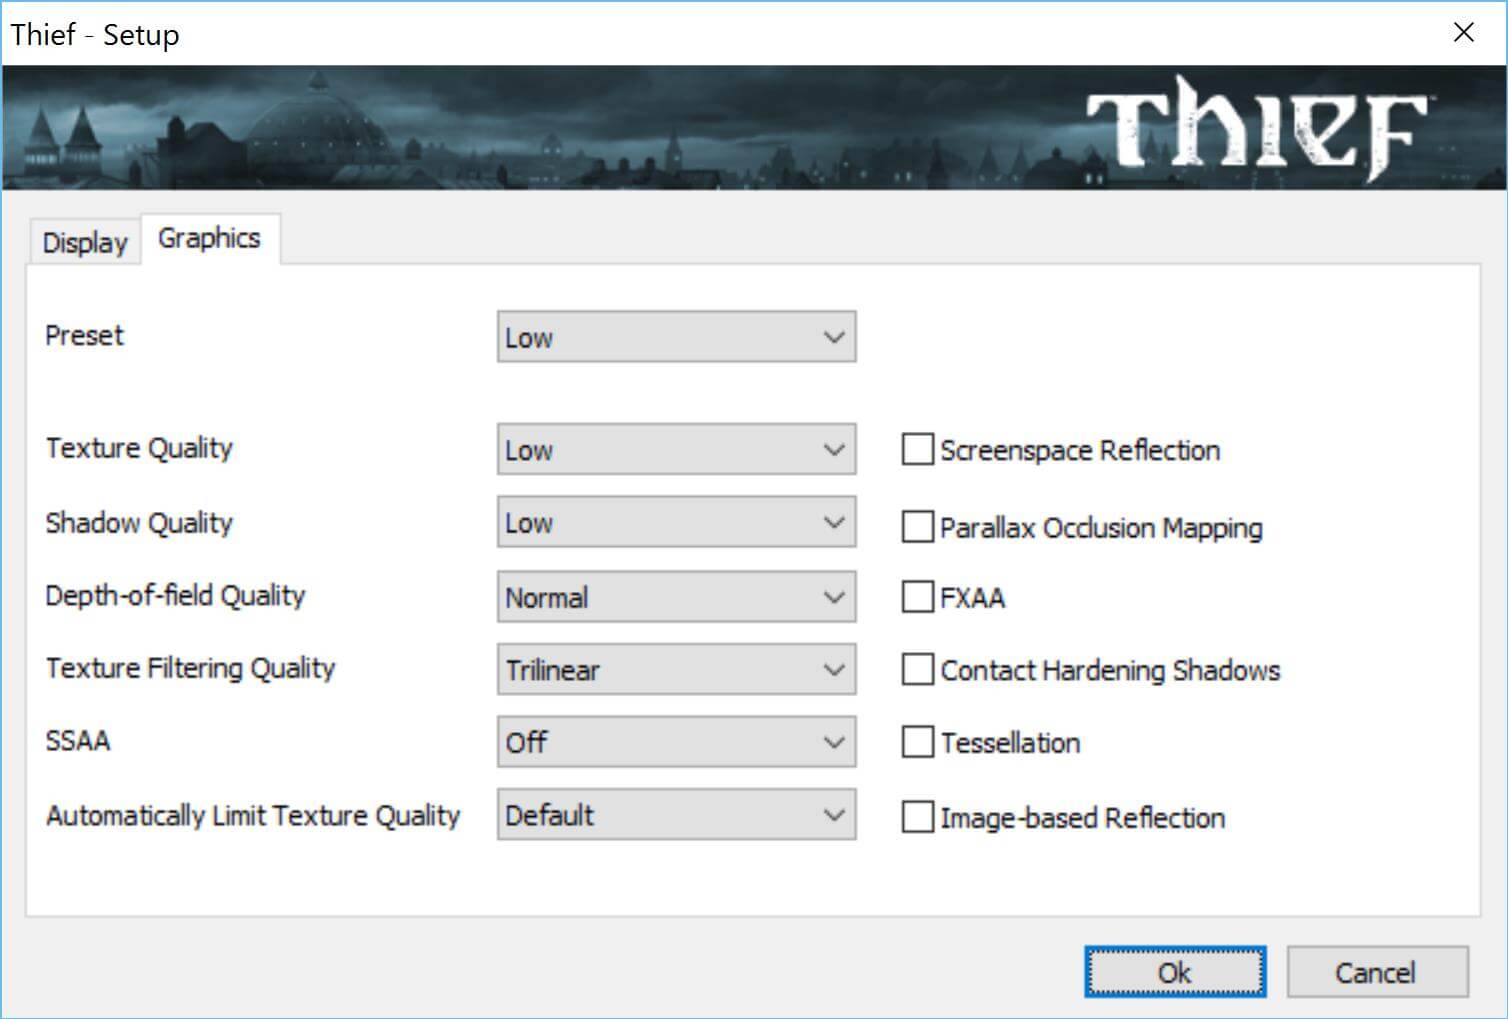
OK, now on to the results.
The frames per second do seem a bit on the low side, but we can see at 1280 x 720 it hits 20.4 FPS, outperforming 1600 x 900 by 35.84% at 14.2 FPS and 1920 x 1080 by 65.80% at 10.3 FPS. I want to move ahead to the next segment of the review to explain a few things and to put you at ease with these scores, but we have to do things in order, so let’s move on to Tomb Raider.

So we slayed mutants, stolen from the rich and given to the poor and now we will go to the beach… and kick some butt with Laura. As I have mentioned before, Tomb Raider was run with a set of standard display settings only changing the resolutions on each test, of which I will show you below.
Let the benching begin.
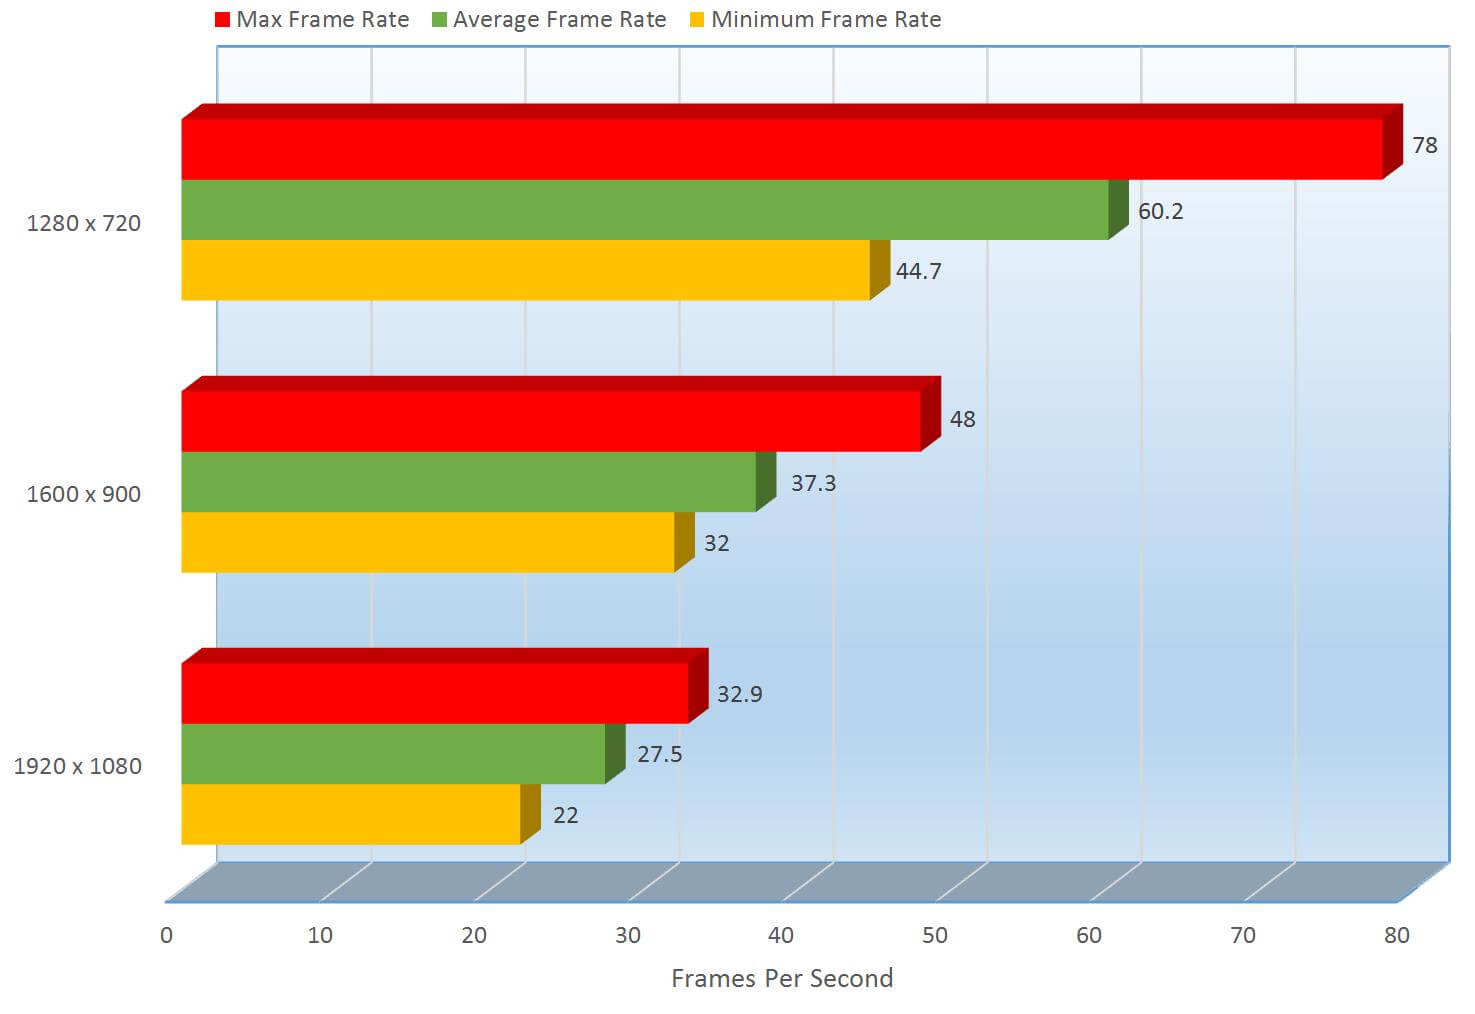
The frames per second are much better here, we can see at 1280 x 720 it hits 60.2 FPS, a great score for any system and it outperforms the still decent results of 1600 x 900 by 46.97% at 37.3 FPS and 1920 x 1080 by 74.57% at 27.5 FPS. Laura took care of us and treated us right, and the Dell XPS 13 did pretty well on it.
I am not jumping to the gaming section I mentioned earlier just yet because there’s more to this ultra-portable than just the graphics and gaming, let’s take a look at the rest of the systems performance. Just know that Gaming will come up very soon and you won’t be disappointed.
Continue: Drive Benchmarks
[nextpage title=”Drive Benchmarks”]
Turning on this Ultrabook my initial reaction was “It’s already in Windows?”. The PCI-E SSD is blazing fast. To test it first, let’s bring up BootRacer to see just how fast it boots.
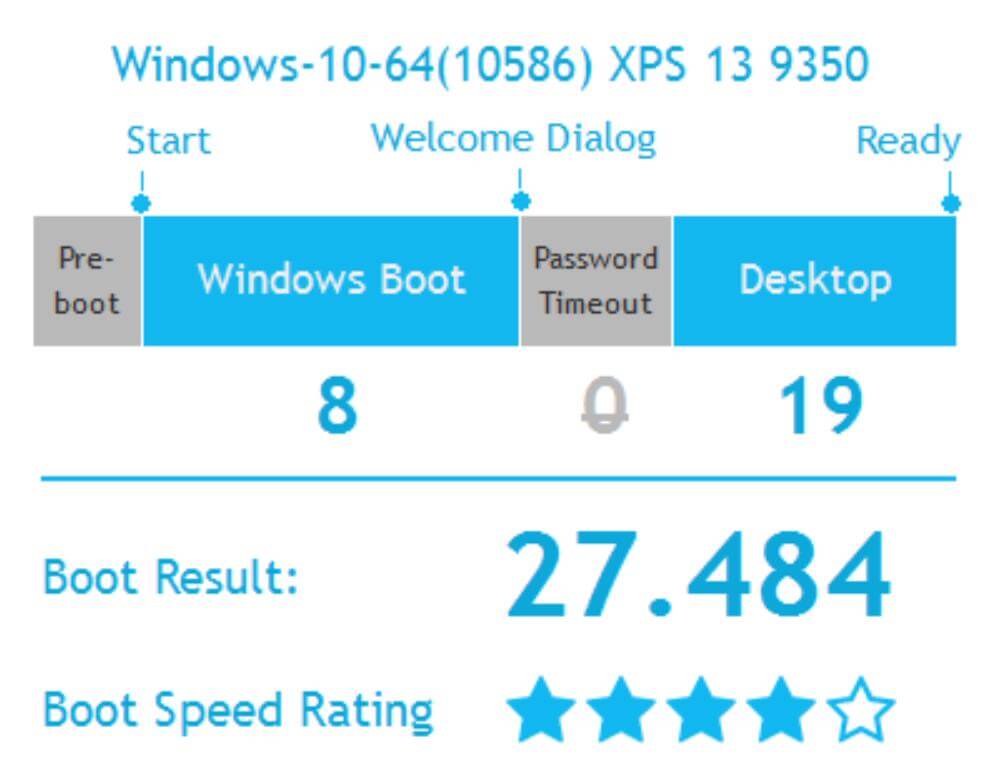
In total, it takes 27.48 seconds to boot into a steady desktop, but it booted to the Windows 10 login screen, it takes only 8 seconds, that’s 1 second slower then Intel’s specification for hibernation. 8 seconds is awesome, but then it takes 19 seconds afterwards to get to a steady 100% usable desktop. Now mind you, 1 or 2 seconds after you login you can use the computer without an issue, but the extra 19 seconds is the time it takes for all the other programs to complete loading. Dell loads the system up with a few utilities, some are useful but they do take up resources and degrade performance just a bit but of course you can uninstall them if you choose. I left them all installed and enabled for a more real world scenario.
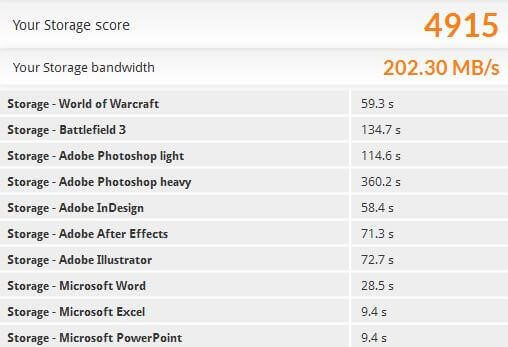
So it boots fast, how does it perform when it’s already in Windows? To test reading and writing performance, we are going to use CrystalDiskMark
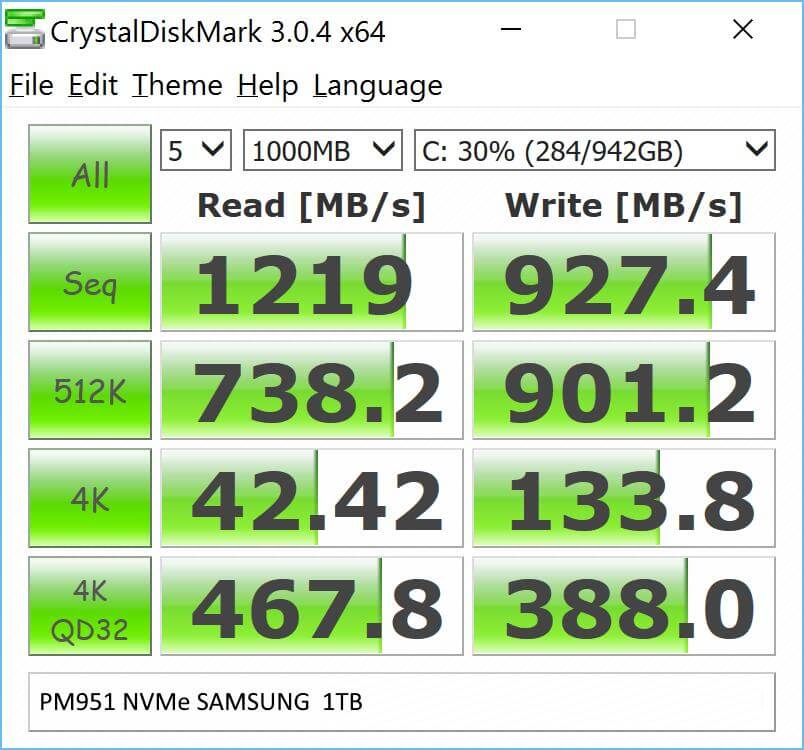
This has been the fastest SSD I have tested to date. Since SSD’s are pretty universal, I will compare benchmarks with other SSD’s I have tested on desktop’s just to give you an idea how fast this it.
![]()
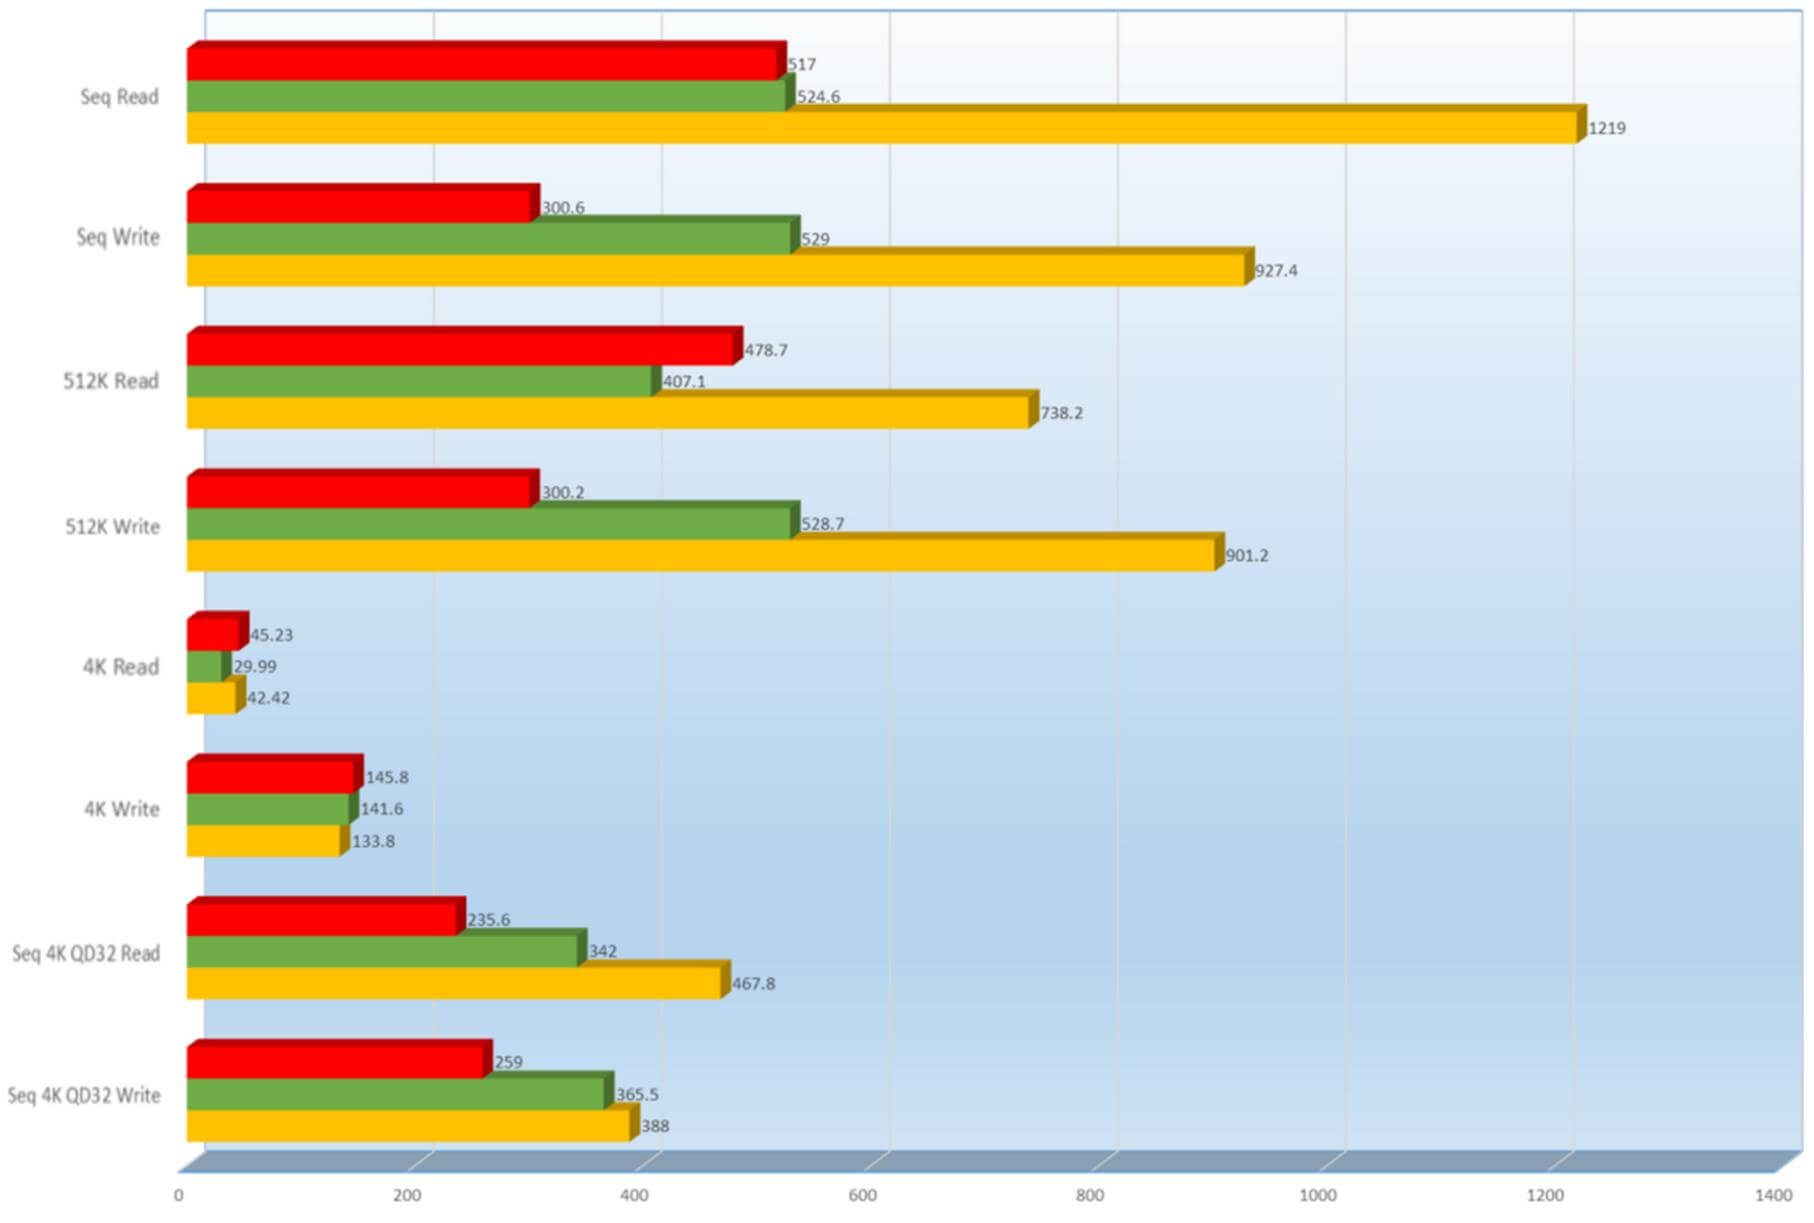

While the PM9551 NVMe Samsung drive included, did not best all of the scores, it nearly trampled the rest especially in the Sequential Read and Write. In case you are confused on what sequential read and writes are and why they are important, I will list a brief description here.
Sequential read as well as write, are the patterns in which a disk is accessed where large contiguous blocks of data are read and written from bordering parts on the surface of a device. SSD’s do a much better job than mechanical drives because the head on the arm doesn’t have to wait for the disk to come back around to read or write the data. Actually there is no arm or head to do the reading on an SSD, since there are no moving parts on SSD’s just virtual pools of 1’s, 0’s and transistors flipping those 1’s to 0’s and 0’s to 1’s and that’s your data.
Let’s do some more real world testing when it comes to gaming, productivity and random home use, things you might do every day. To help us put this into a benchmark, we will be using FutureMarks PCMark. This tests the performance out of these 3 drives measuring how quickly each gaming and application loads in seconds.
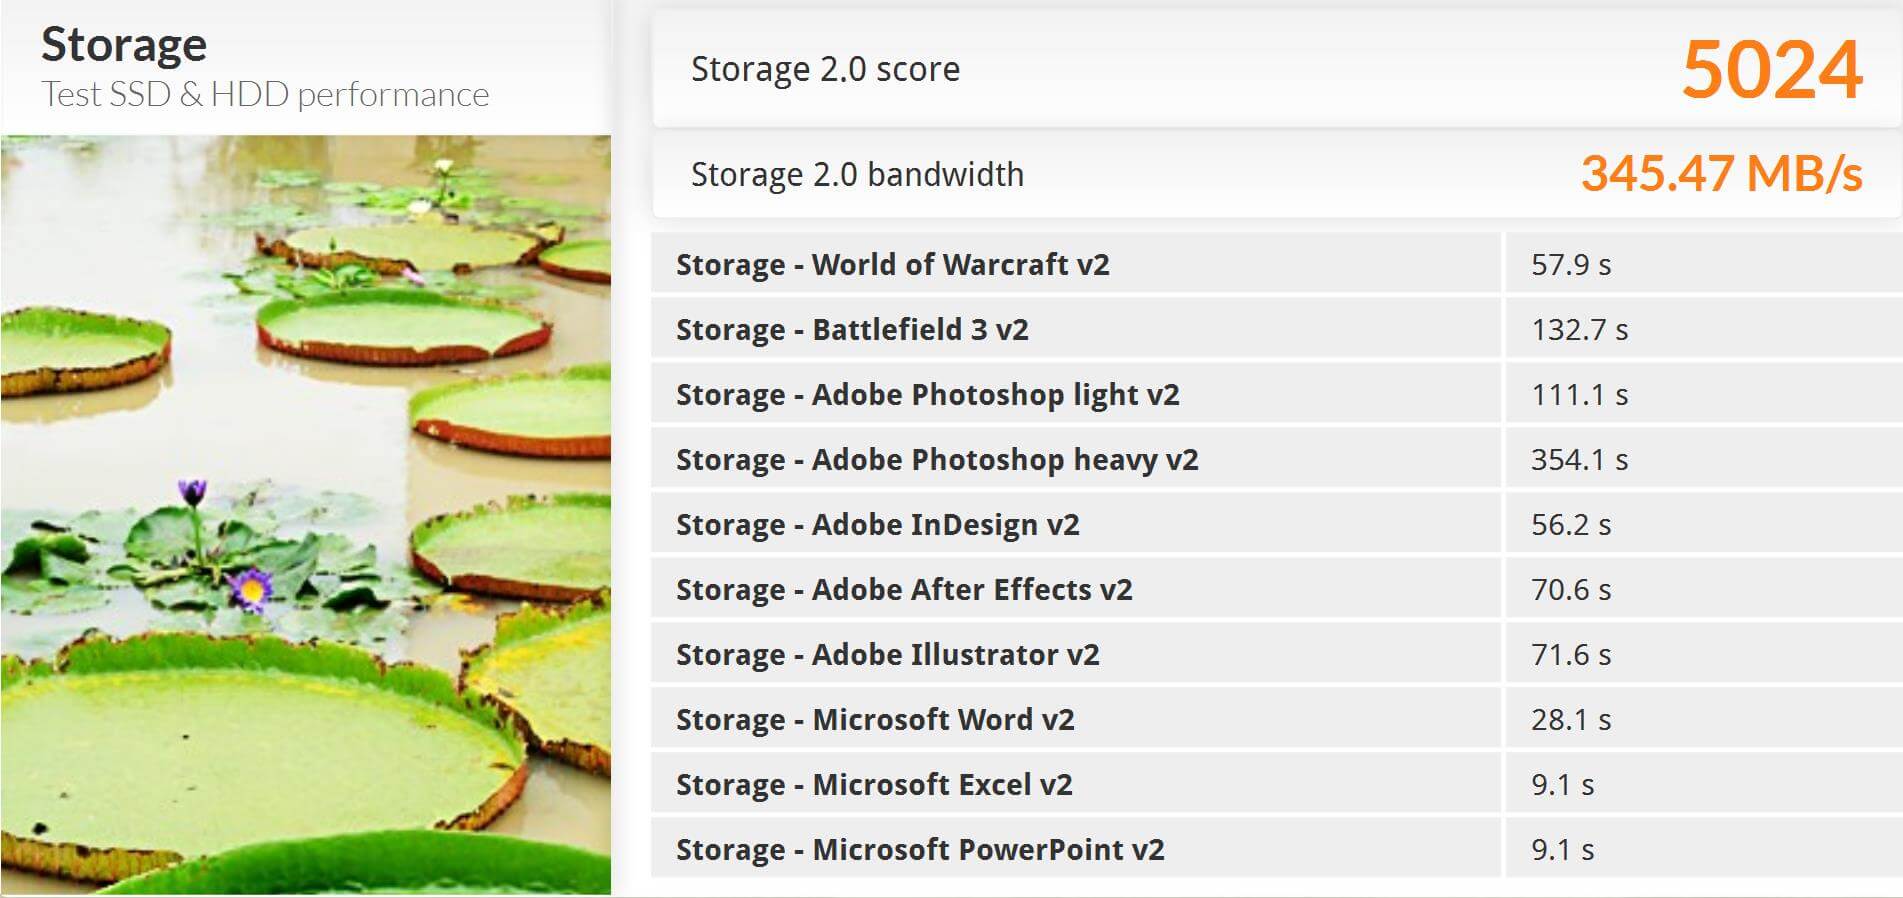
Alone, these results might not mean much, but we saw on the previous test, the Patriot Ignite was very close, so let’s compare these 2 drives again.
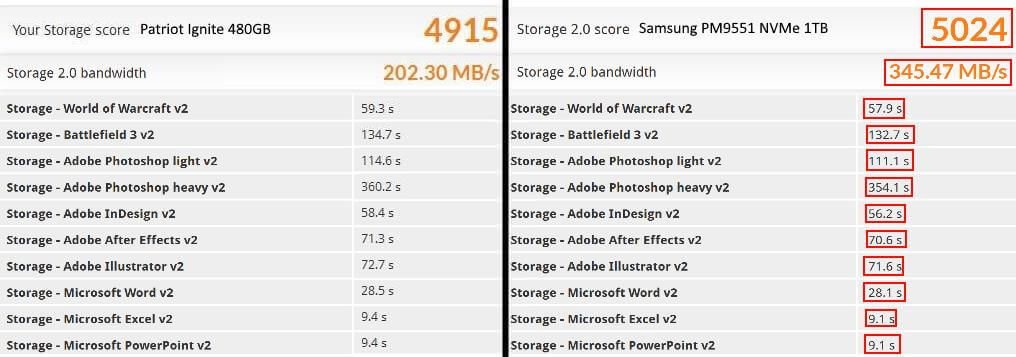
We can see here in real world performance, the Samsung PM9551 NVMe 1TB drive outperforms the Patriot Ignite 480GB. They are different drive types, but it is an example of the performance.
Now that you have seen the benches, let’s see what these actually mean in games, you might be a little surprised.
Continue: Realworld Gameplay
[nextpage title=”Realworld Gameplay”]
Benchmarks are great to understand how performance is supposed to be on a PC, though FPS doesn’t seem to mean the same thing for all games.
In this first video, I show you how I play ARK: Survival Evolved, Battefield 4 and Minecraft on this machine. Mind you, I have not modified anything on this notebook to perform better for these tests; everything is as it comes from Dell.
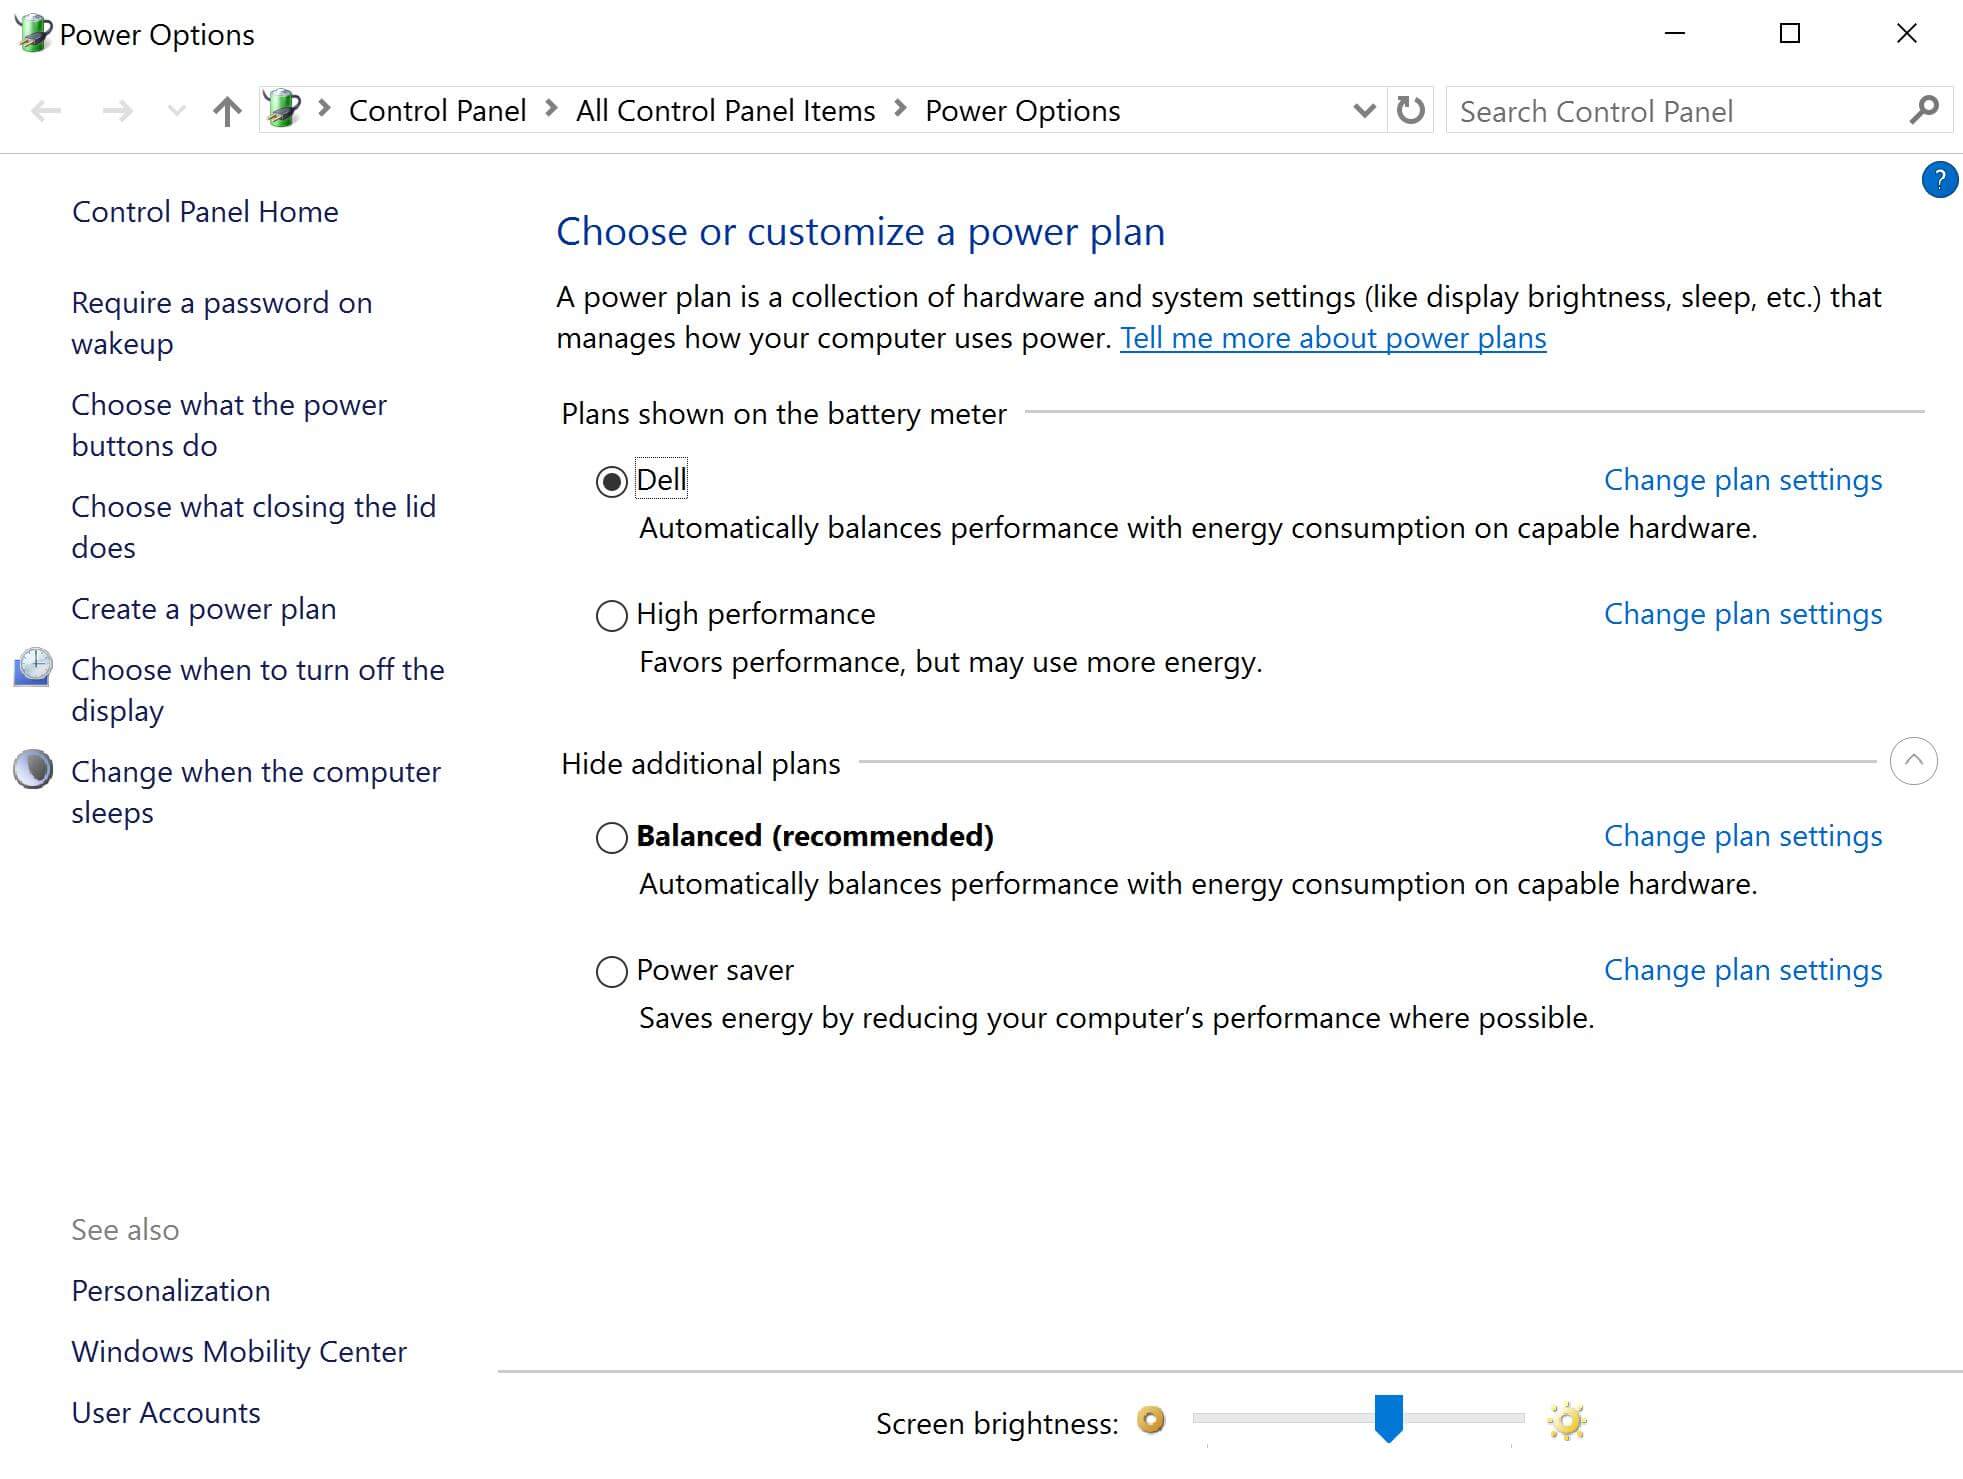
I mentioned about modifying the performance, because you can actually get a performance increase by simply choosing “High Performance” power plan, the default is “Dell”.
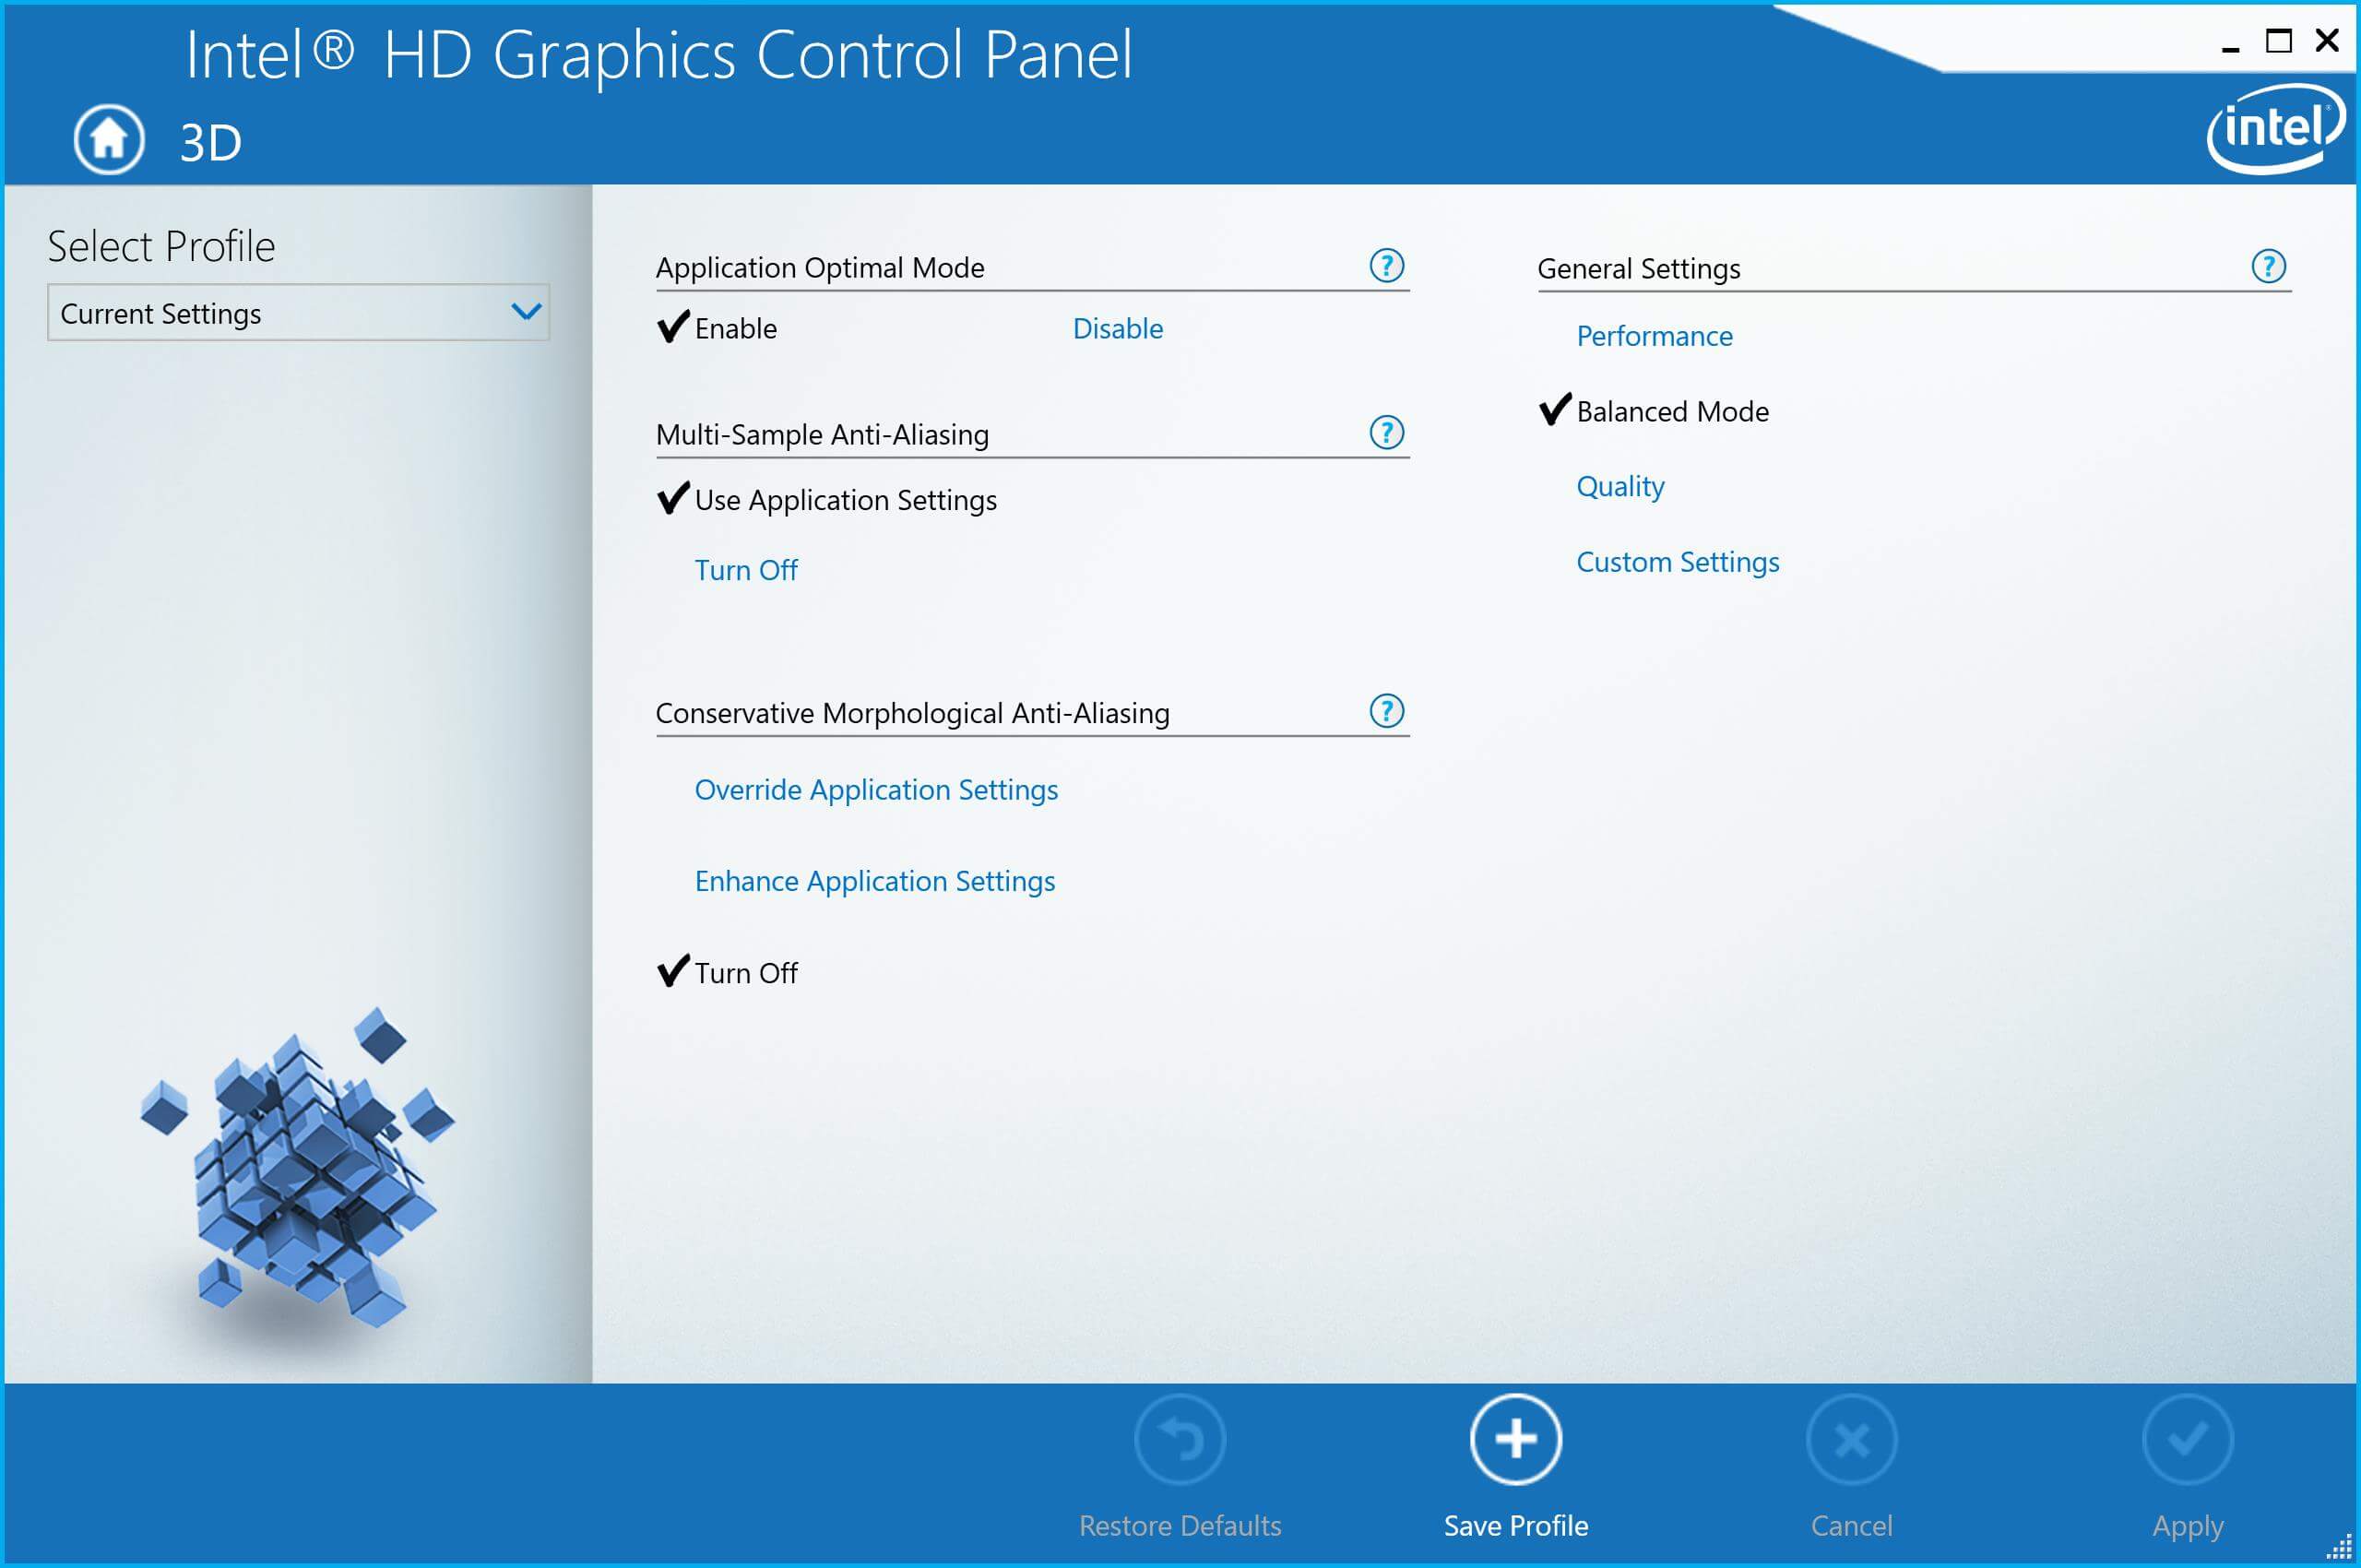
Another performance improvement would be to change the “General Settings” inside of the Intel HD Graphics Control Panel from “Balanced”, the default setting to “Performance”. This next video and the previous tests and throughout this review had these settings at “Balanced Mode” and the power settings to “Dell”.
On this example, I play THIEF, Tomb Raider and Grand Theft Auto V.
With these un-optimized settings you can see how well it played these games. With them amped up a bit, it will perform so much better, as well as choosing the optimal processor, the IRIS enabled Intel Core i7-6560U processor running the HD540. The HD540 packs twice the video performance of the Intel Core i76500U running the HD520 graphics featured in this review.
Now onto some battery testing.
Continue: Battery life testing
[nextpage title=”Battery life testing”]
Aside from performance benchmarking, laptops/ultrabooks require another form of benchmarking, battery life span. Battery life is incredibly important for laptops since they are mobile, you will be taking this on business trips, vacations and other long commutes, on the road or in the air and you don’t always have a power outlet where you can plug these in so these things need a long battery life.
PCMark8 also provides a battery test that might measure a person’s workload, a very high energy individual that only has minutes to get work done. The test runs a gamut of web browsing, writing, photo editing, video chat, video encoding and gaming benchmarks to simulate real world use and while I would say it is not amazingly real world, it gives you a great example of how much this PC can handle.
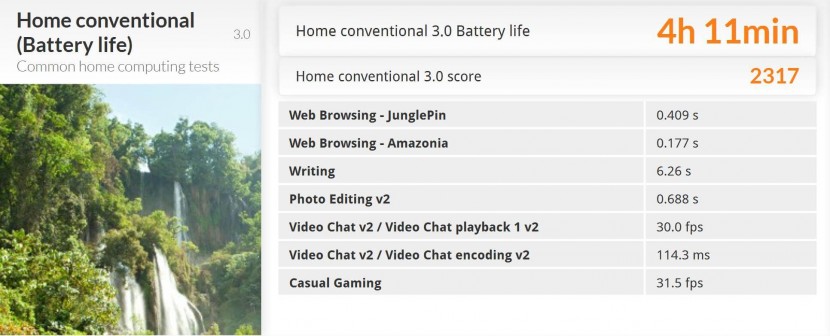
Here we can see on the “Home conventional (Battery life)” test it scored 4 hours and 11 minutes. This is 4 hours of web browsing, mixed in with writing documents, photo editing, video chatting and encoding and gaming. This is amazing, though a far cry from Dell’s 18 hour claim and here’s why. Dell, like all other notebook manufacturers will claim a battery life, but those claims are not based on use, they are based on turning on a laptop and sitting on an idle screen, 18 hours is nice but it’s also a long time to stare at a screen that is not doing anything.
To bring the testing to a more real word scenario, I will run a bunch of movies playing back to back to see how long the battery lasts. I ripped these movies I own using Wondershare’s Video Converter Ultimate; here are the movies I ripped.

Lord of the Rings the Two Towers, Spider-Man, The Goonies, Tomb Raider, Daredevil VS. Spider-Man, Show Girls, X-Men, X-Men The Last Stand and Hannibal.
Click hold and drag order playlist
- Hannibal: 2:11:32
- Showgirls: 2:11:07
- Spider-Man: 2:01:12
- Spider-Man VS. Daredevil: 1:20:17
- The Goonies: 1:53:57
- Tomb Raider: 1:40:34
- Lord of the Rings: The Two Towers: 2:59:22
- X-Men The Last Stand: 1:44:06
- X-Men: 1:44:17

Mind you, I was playing the movies at full screen but this was the screen it booted back up to after I plugged the machine back in and turned it on. It played a total of 7 hours, 59 minutes and 22 seconds, just shy of 8 hours of straight movies, that’s not bad at all. It got through Hannibal, Showgirls, Spier-Man, Spder-Man VS. Daredevil and 15 minutes and 16 seconds of The Goonies.
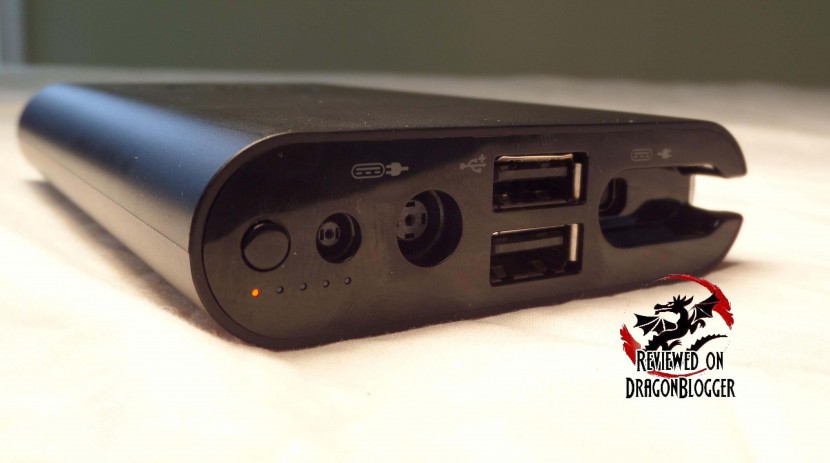
Once it died, I plugged it into the Dell Power Companion which holds up to 12,000mAh of power and even provides 2 additional USB ports to charge other devices. You can charge it with the same cable used to charge the Dell XPS 13. Before I go into the companion, I wanted to show you this.
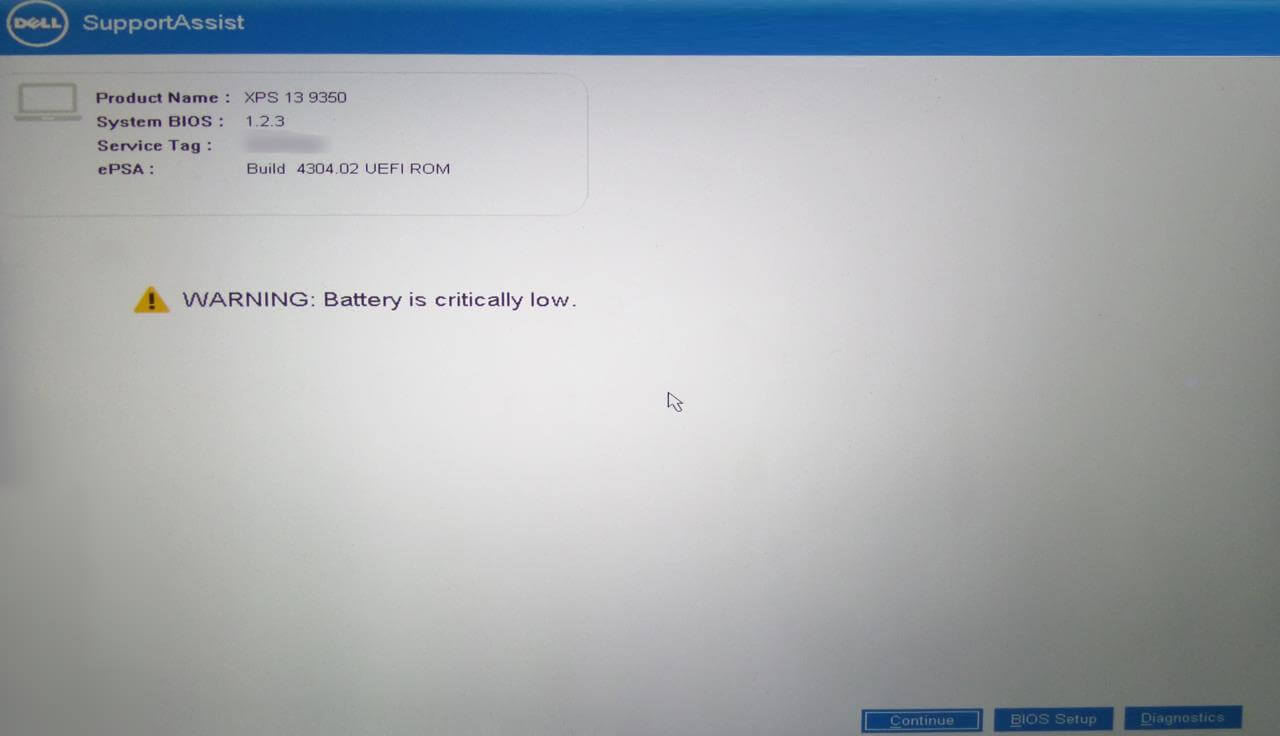
It didn’t actually die though, they have protected it so that when the battery is near its end and turns off. You can turn it back on and are greeted with a UEFI bios warning message letting you know that your battery is very close to dying. You can choose to “Continue” to boot back into windows, but you have 6% battery and this is to allows you to not lose any data you were working on and even to not miss the part of the movie you left off at. I totally drained it afterwards to show you this.
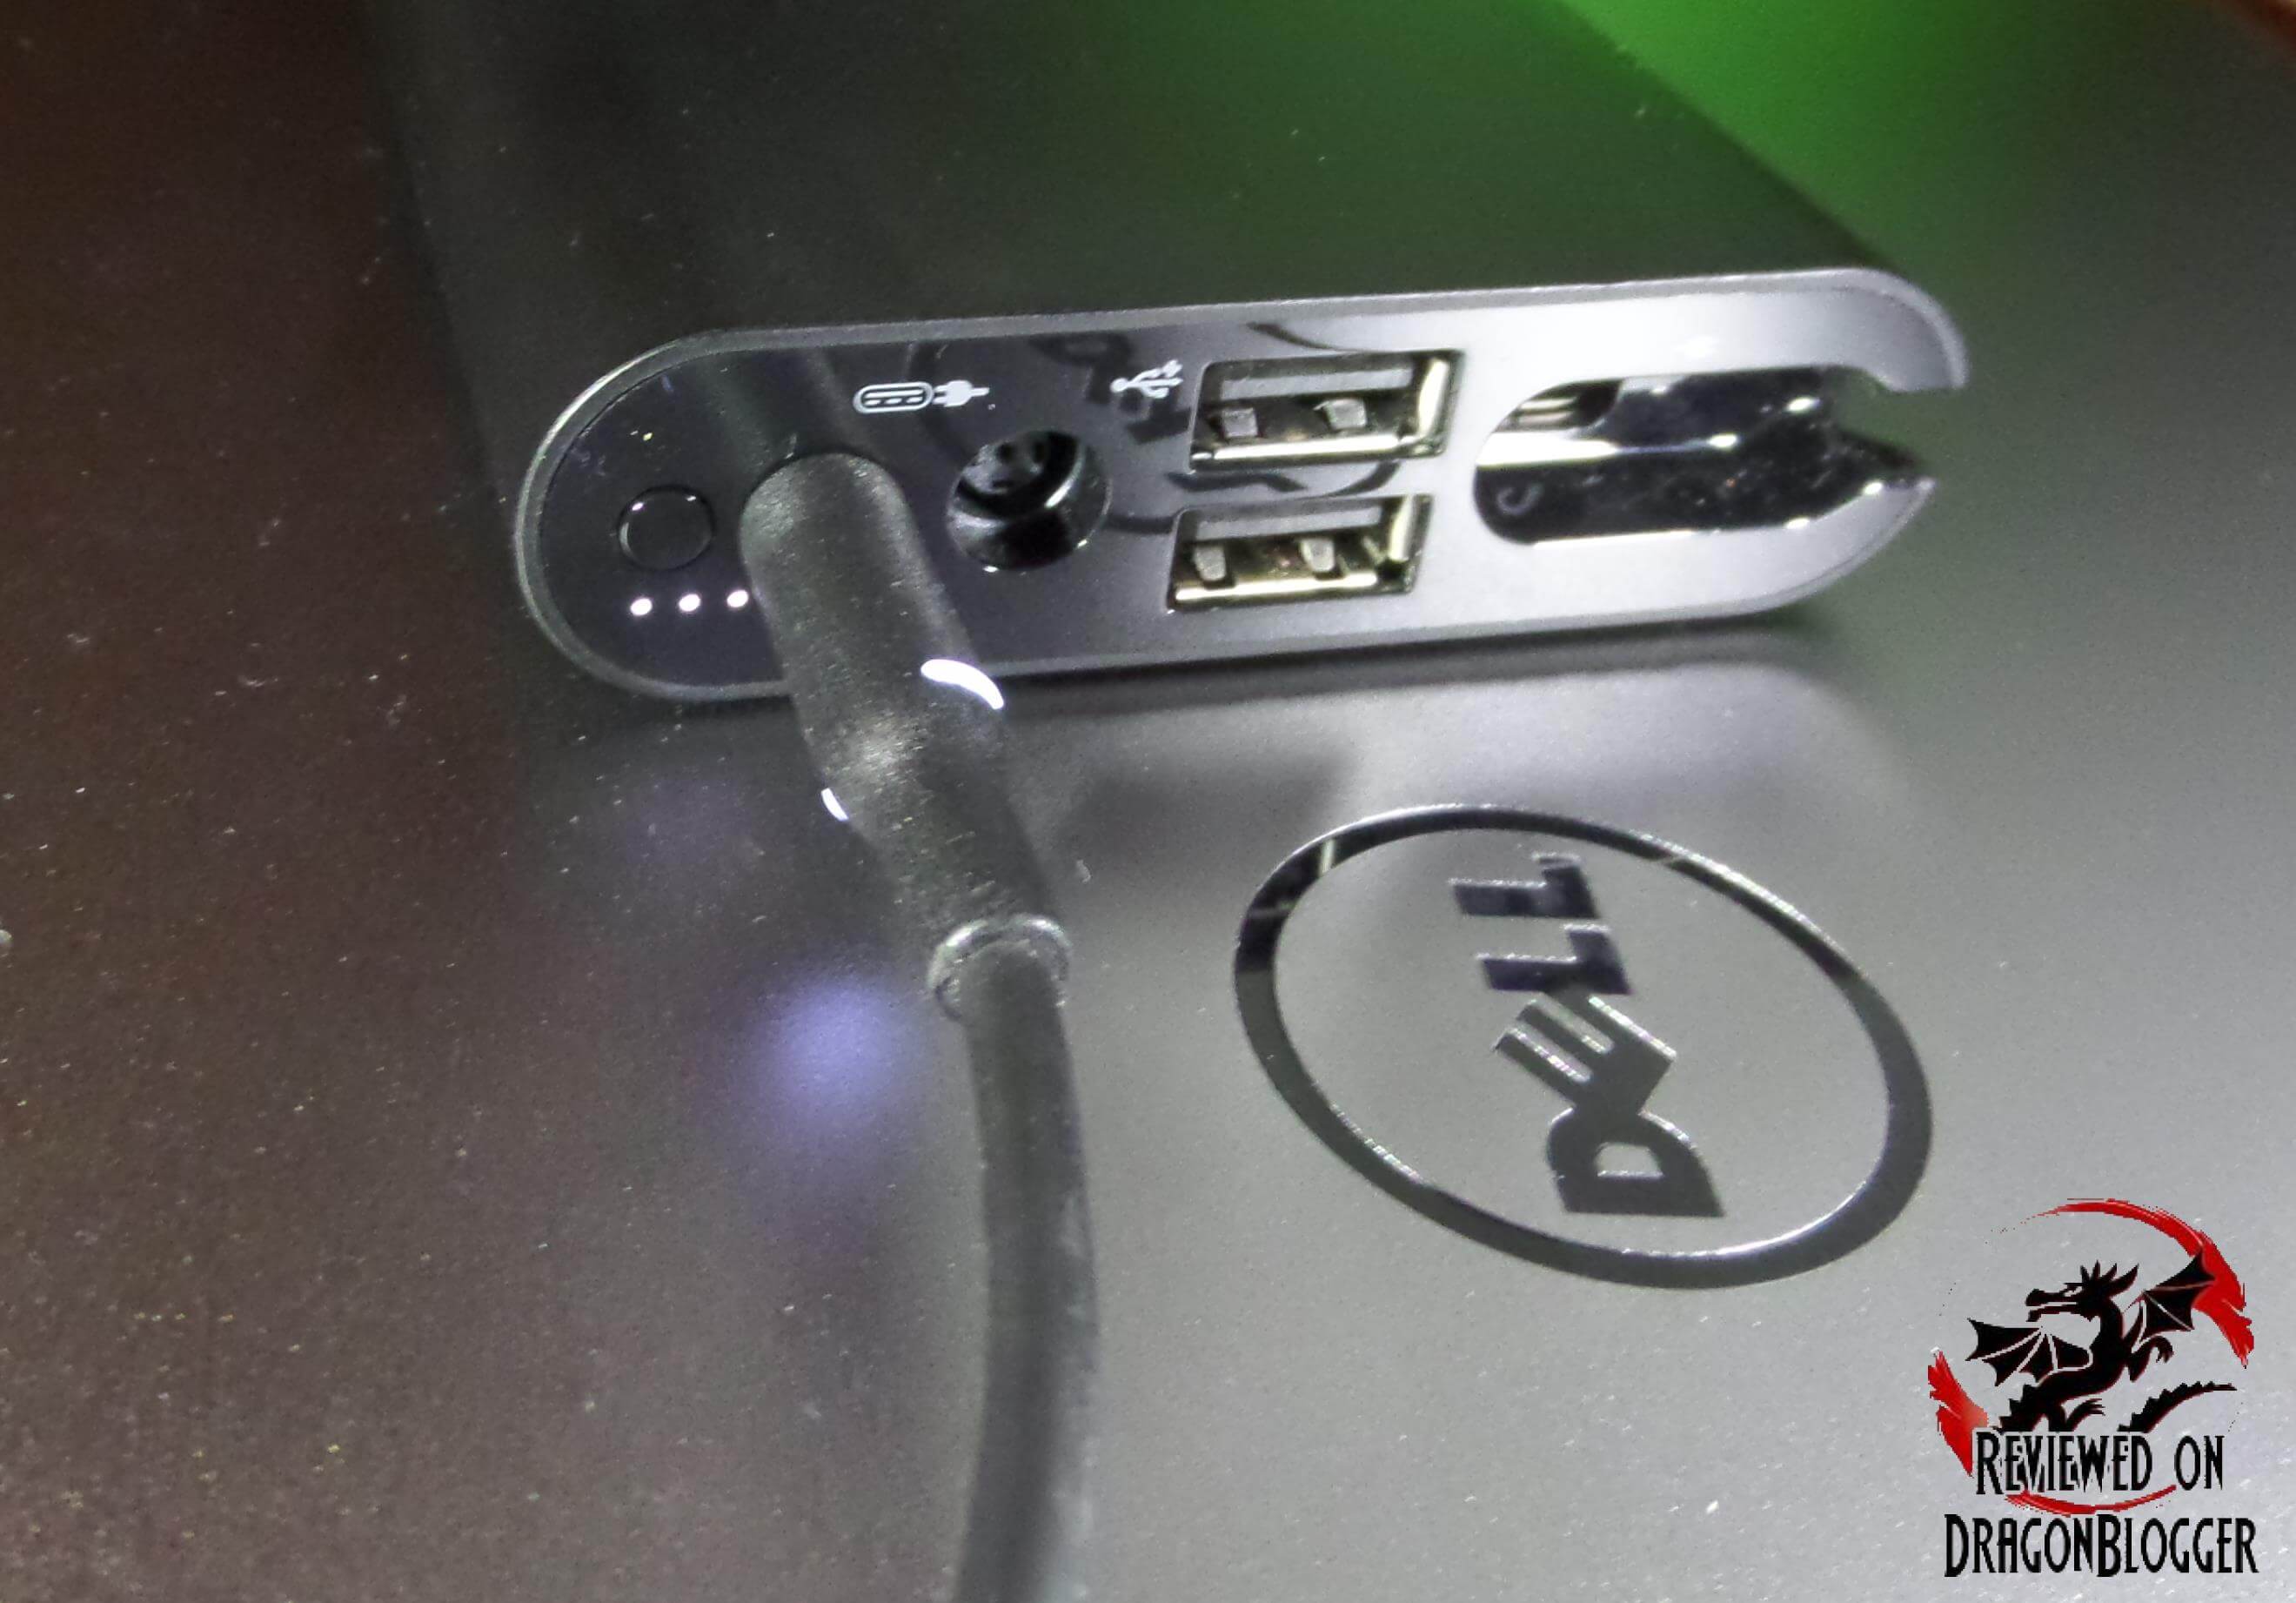
With this, I was able to get the battery on the Dell XPS 13 back up to 56% from being at 0%, totally devoid of any power.
The battery indicator on the side shows me I have 3 bars out of 5 of power after a full charge from this Companion. This is very handy so that you don’t have to keep booting the unit backup each time to check power.
With that extra power, I was able to get an hour into Lord of the Rings: The Two Towers, kind like real life…. So that’s the remaining 1 hour, 38 minutes and 41 seconds of The Goonies, 1 hour, 40 minutes and 34 seconds of Tomb Raider and 1 hour of the Lord of the Rings: The Two Towers, for an addition 4 hours, 19minutes and 25 seconds. Even though the system shut down to protect the battery, it had 4% left which is 29 minutes, so I could have seen an additional 29 minutes of Lord of the Rings: The Two Towers but I’m good. To total it up, that’s 12 and almost a half hours of movies, 8 with the built in battery and 4 hours and 20 minutes with the additional battery, even without the companion, that’s very nice.
Since this unit does not come with an optical drive, you would have to rip them or use Netflix or some other form of movie service, but I chose MP4. If you did want to buy an external media player, a Blu-Ray/DVD/CD player, you can get something along the lines of this

[nextpage title=”The Build”]
As I mentioned previously, this does not contain an optical, as we progress they are less and less useful but of course there will always be that time you need them. The drive is not included because this system is so thin; there is no way it would fit.
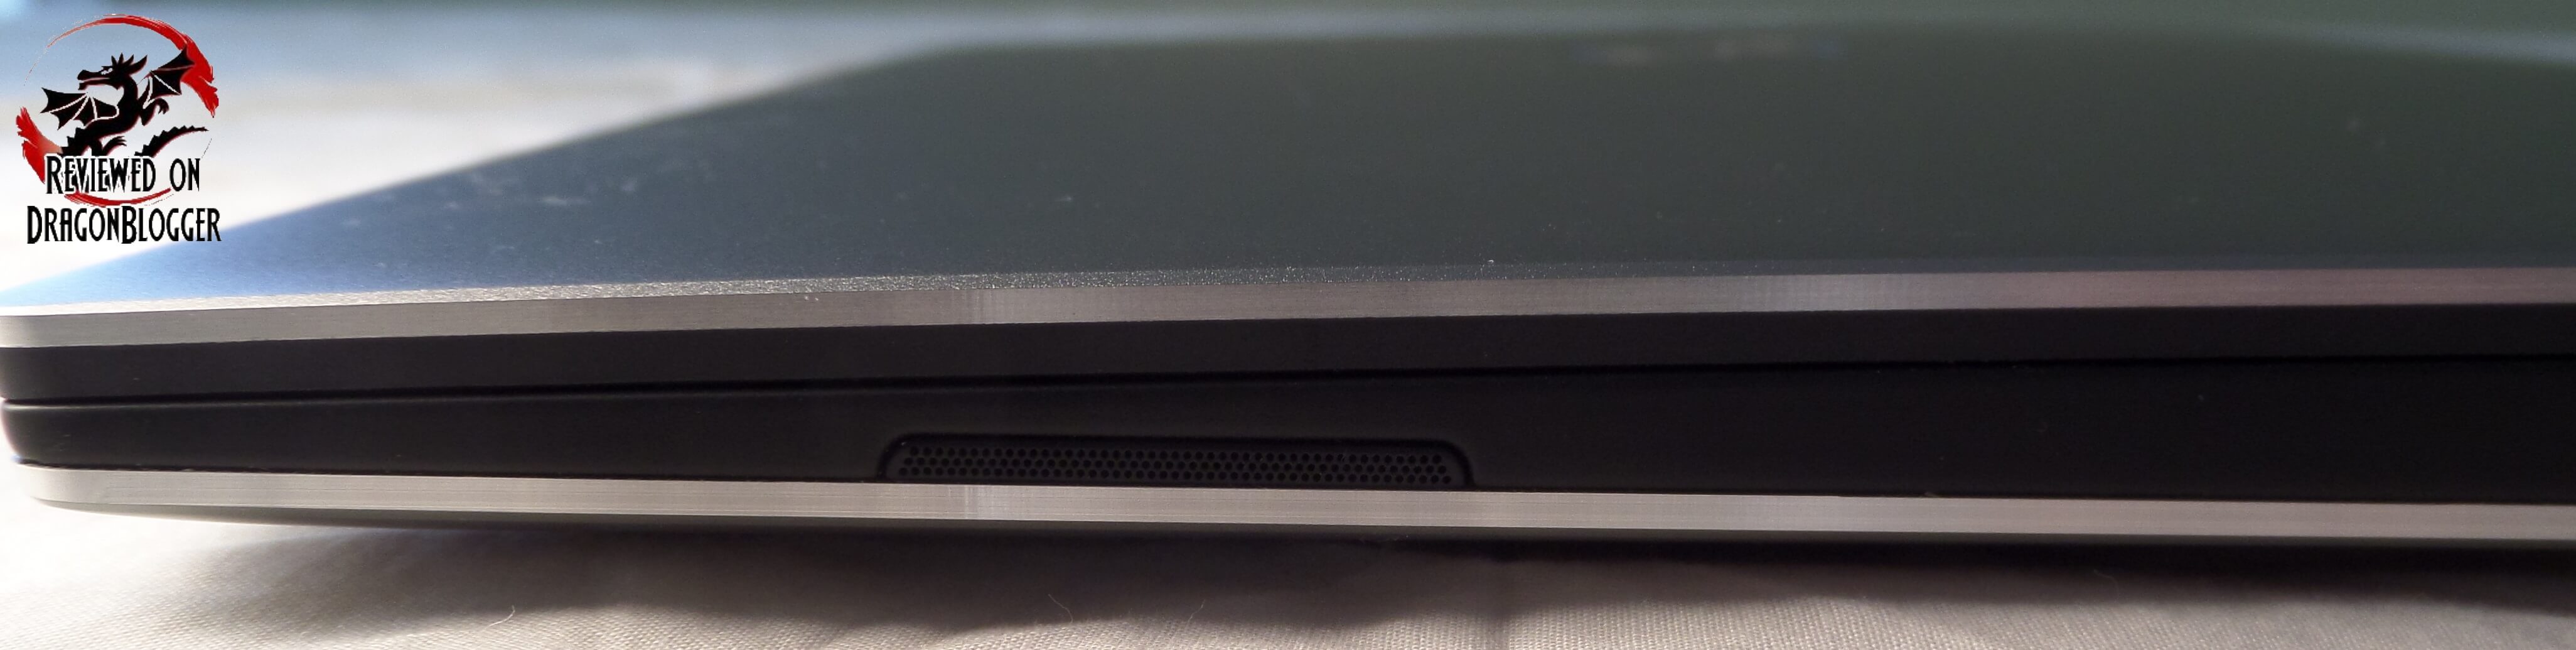
Aside from that, the top and the bottom of this Ultrabook are made out of CNC machined Aluminum, not plastic.


You will notice those long black strips, those are the feet. They bulge out a little to keep distance between the desk or surface you put them on so that the machine can breathe. Towards the back of the system, by where the Windows Pro sticker is, between that and the foot are the vents the machine pulls cool air from.

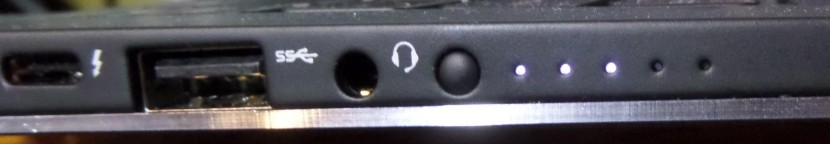
On the left side of the unit, from left to right you have the power plug, Thunderbolt port, USB 3.0 port, 3.5mm headphone jack, battery gauge and indicator. For the battery gauge, it’s actually a great little idea here. You don’t have to turn on the notebook to see how much power it has, you just press the button (press and hold for a second or 2) and it lights up to show you how much power it has. It is showing 5 lit up keys, telling me it is fully powered.

A tiny bit down from the indicator, we have one of the 2 speakers

On the right, you have an SD card slot, USB 3.0 port and a Noble lock slot. A Noble lock slot is supposedly the strongest mobile lock slot available to protect from the notebook being stolen if left somewhere.

A little further down on the right, we have the second speaker
For the SD card slot, it states you can only insert an SD, SDHC and SDXC but actually you can also plug in a micro SD, of course you need the adapter.

One thing to mention is that this slot does not take the entire card; it does stick out a tiny bit.

Opening the notebook up, we find some more nice stuff.

First off, we see the Carbon Fiber, it feels real nice. This is real carbon fiber to aid in the Dell XPS 13’s integrity, not just painted on.

Then a little to the side, we find the touchpad, or mouse.

The touchpad is a precision touchpad with seamless glass integrated buttons which to you and I means, there are no addition left or right buttons, you can click left or right from here.
A little higher we find the keys, they are chiclet style keys.

Oh yeah, and they are backlit.

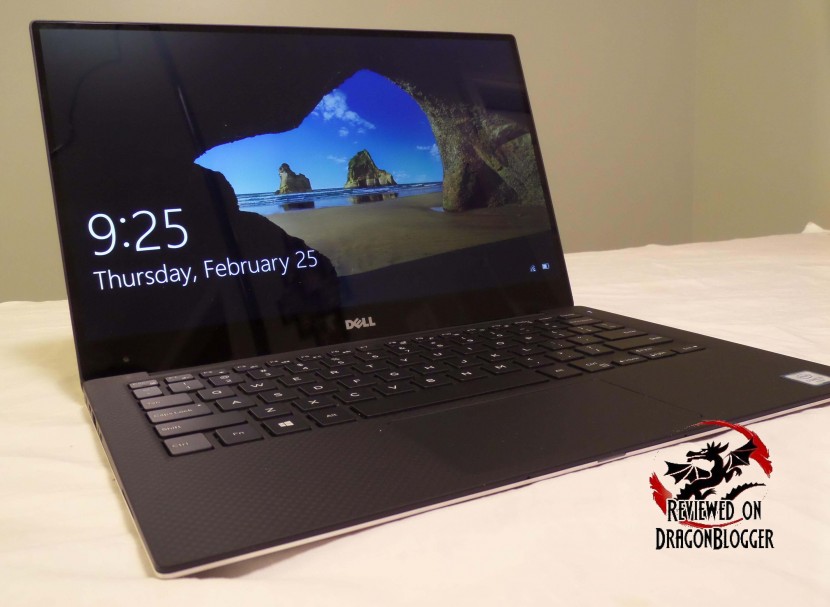
Moving up from there, we find the 13 inches screen.

Wait, a 13.3 inch notebook, with and a 13.3inch screen, it’s almost borderless. The screen is an edge-to-edge 13.3 inches made out of Corning Gorilla Glass NBT on a Quad HD+ resolution, that’s 3200 x 1800 and the display is IPS so you can see the image from almost any angle. One very important thing, this display is a touch screen display. You can see examples throughout the videos on this review.
On the same panel as usual we find the Widescreen 720P camera, though it’s not in the same spot you would normally find a camera on a laptop. Check it out.
It works pretty well and as you saw, the color was great.
In this picture, you can see the camera circled in red.

It also includes an Intel DW1820A 2×2 802.11ac 2.4/5GHz WIFI card that supports device that also provides support for Bluetooth 4.1, Miracast and WIDI. Check it out here
If you were wondering how the speakers sound, well here’s a little example. In this video I compare the audio from the Dell XPS 13 9350 speakers to the audio on my cell phone, the Motorola Droid Turbo then to the speakers on my Tablet Express DragonTouch X10.
OK, the notebook is nice, but does it have any accessories? No worries, it has plenty.
Continue: Accessories
[nextpage title=”Accessories”]
While it does not come with additional accessories, you can purchase them. Here are a few of the additional accessories.
The Dell Power Companion, perhaps, one of the handiest accessories available. Mind you this ultra-portable has tons of power, a little extra never hurt.
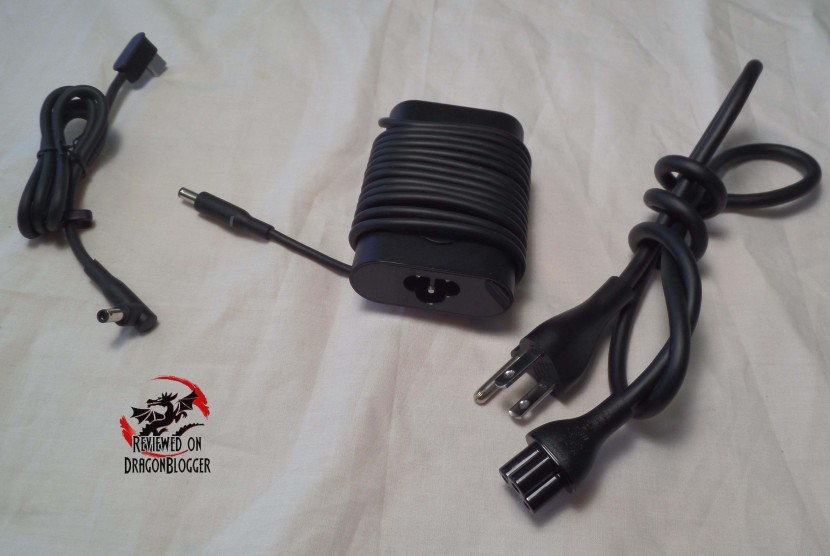
The Companion provides up to 12,000mAh of additional power, as you saw in my battery testing section of this review, that’s a little over 4 extra hours of movies. If you are not charging the notebook, or even if you are, you are able to charge 2 additional USB devices, just to make sure you are not left stranded.
Like the notebook, it has a power gauge so that you can see how much power is left on this. You can have this plugged in while you are using the notebook just to keep it going or when you are done, you can turn off the notebook, plug it in and put it away so that next time you use it its fully charged.
Dell Adapter – USB Type-C to HDMI/VGA/Ethernet/USB 3.0
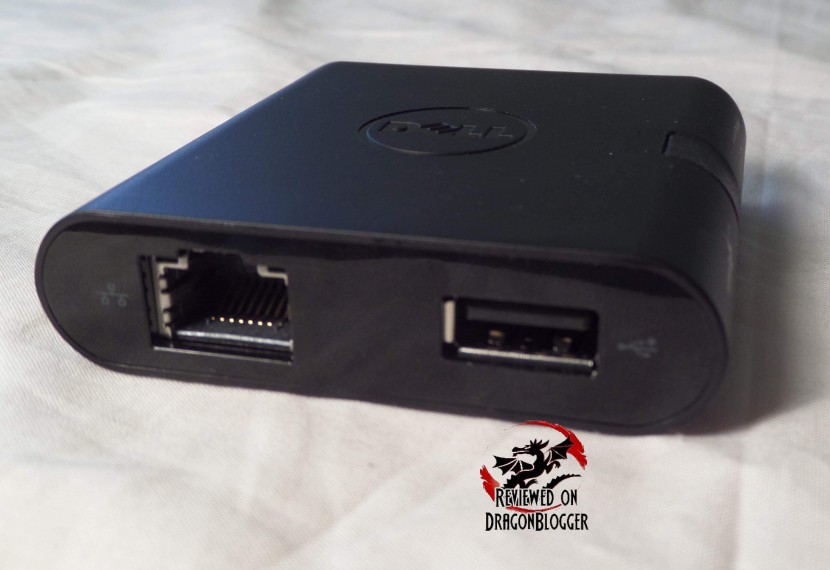
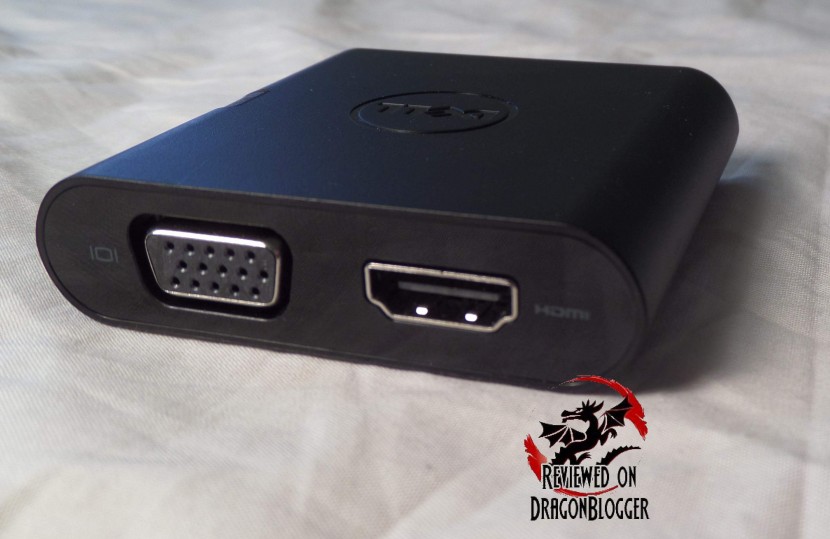
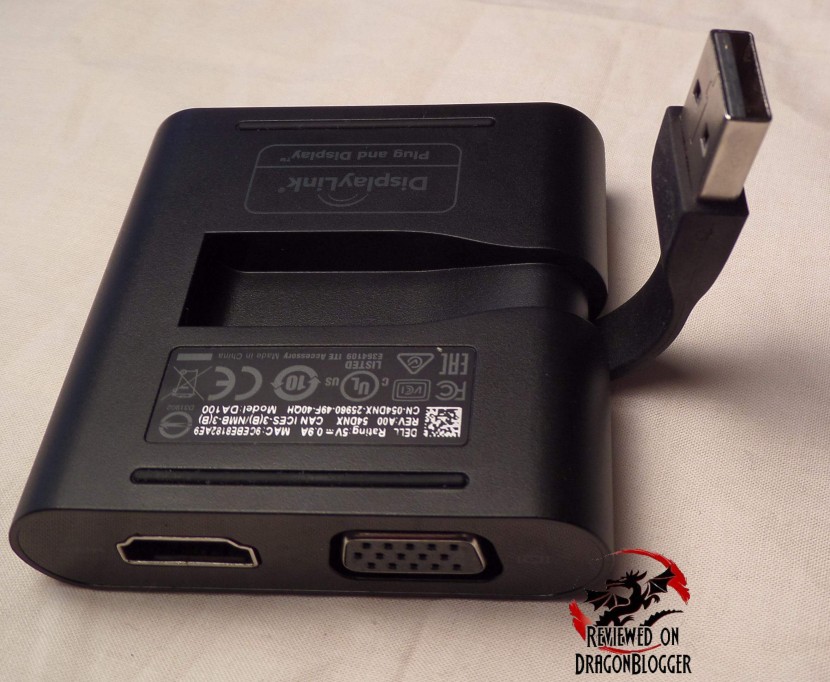
This adapter, while it does take up a USB port, it provides a USB 3.0 port as a pass through so it doesn’t really take up a slot, then also to an HDMI, Ethernet and/or VGA Port.
Check it out
It makes for a nice docking station of sorts when you are in the office or home office and want to use a larger display.
It comes with a velvety smooth little bag to protect the notebook a little.
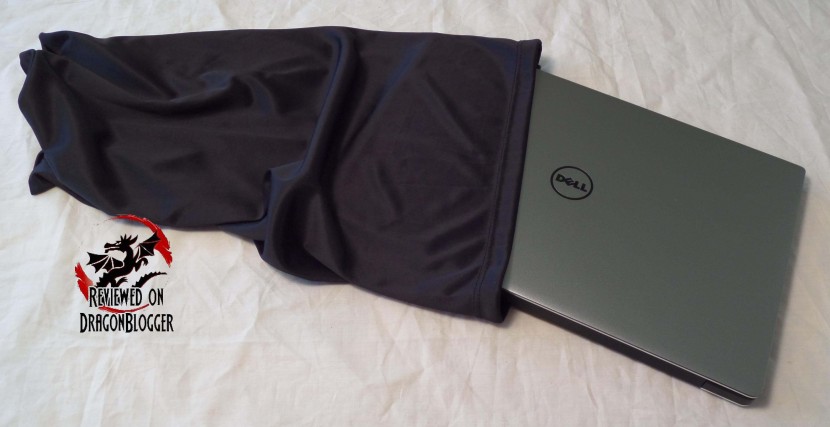
When I say a little, I mean a little, it’s just a pouch. For a little extra protection, you can purchase the Dell Premier Sleeve.
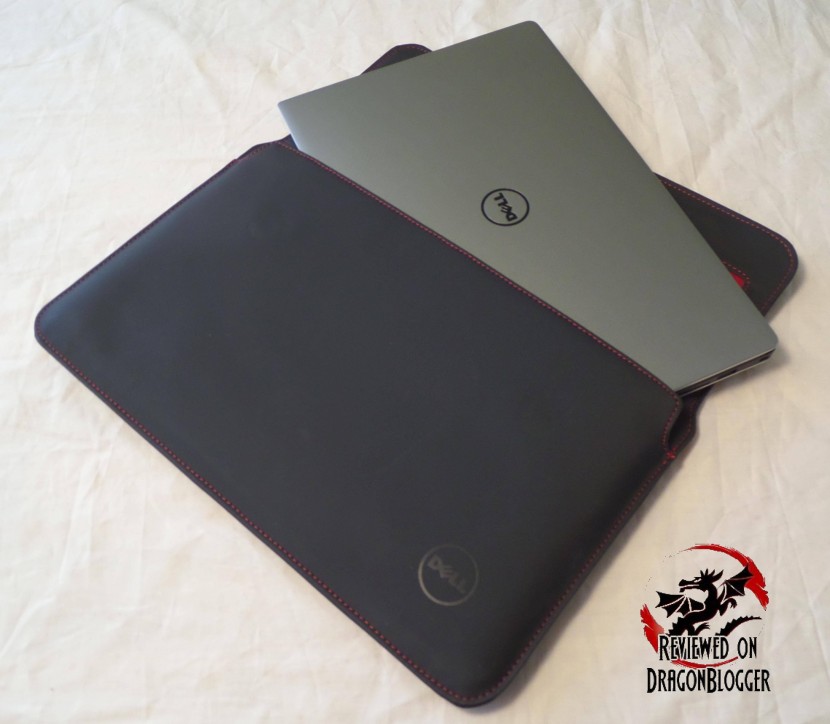
When all the way in, the fold to close the sleeve is magnetic, so it snaps in place making sure it won’t fall out.
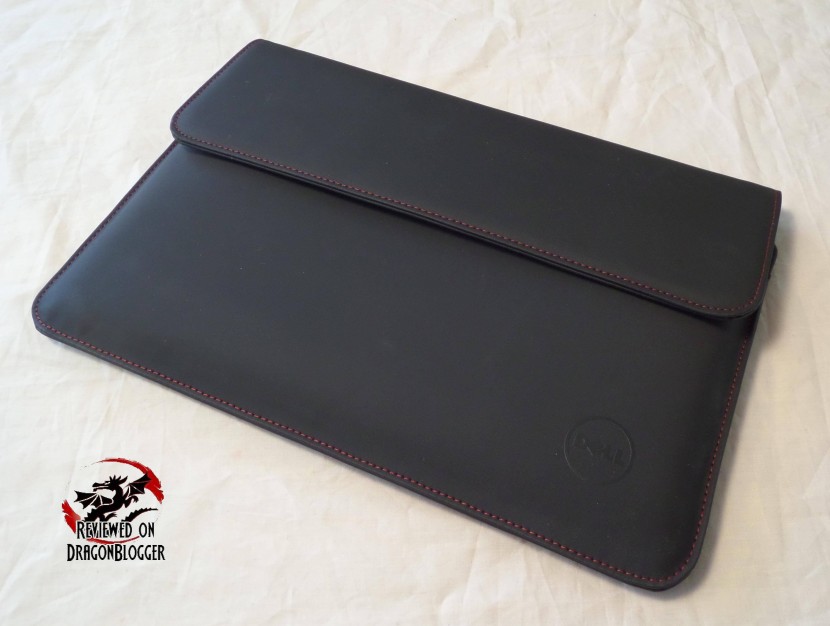
When closed it, it’s like a single slim book only this single book can provide more information than entire libraries, provide more entertainment than a year’s worth of movie passes, concert tickets, radio stations and more…. In this one little book, technology is amazing.
So I have shown you a pouch, a sleeve, a Dell adapter and companion, that’s not all going to fit in the Premiere Sleeve and no worries, Dell’s got you covered.
To carry all of this awesomeness, Dell has also created the Dell Premier Backpack (M).

This thing has a TON of pockets and I am not going to take pictures of the all, but rather I filmed it. Check out everything this backpack has pockets for.
Continue: Maintenance
[nextpage title=”Maintenance”]
When I received this system, there was a notification to update the WIFI driver and the video driver, so I figured, let me just update everything. Please note, all tests performed were performed with the latest drivers and software updates.
A laptop is a little different than a desktop, while you can build your own laptop/ultrabook, it is a bit more difficult and expensive to get all the right parts and a little more time consuming. For most, the obvious choice is to buy a prebuilt laptop. Unfortunately when they arrive, they don’t always have the latest drivers and/or BIOS already applied. Dell has a support site like other manufacturers where you can download your drivers and such.
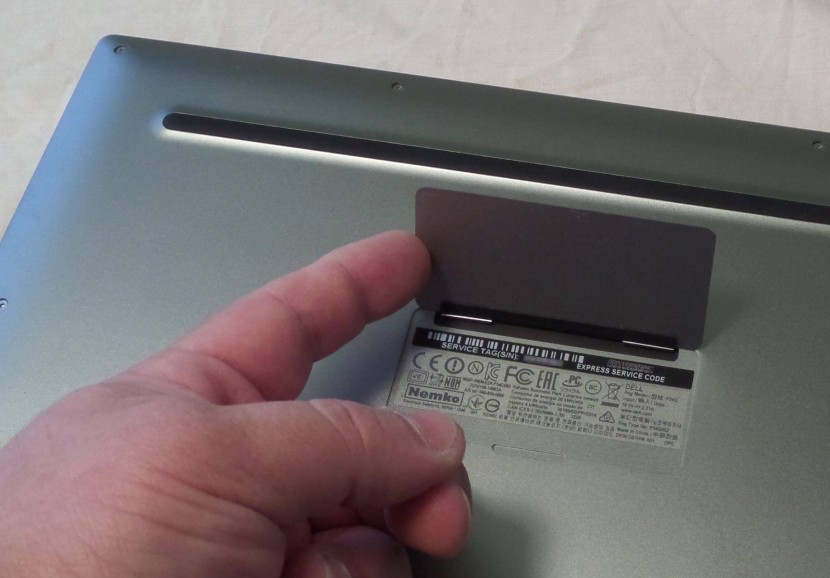
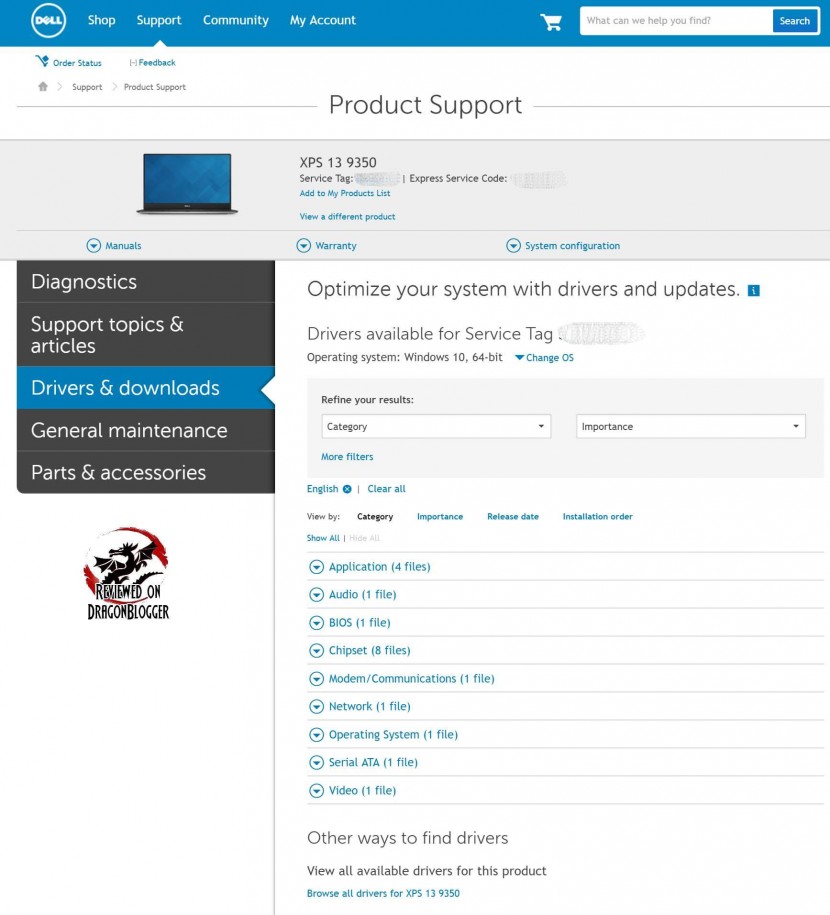
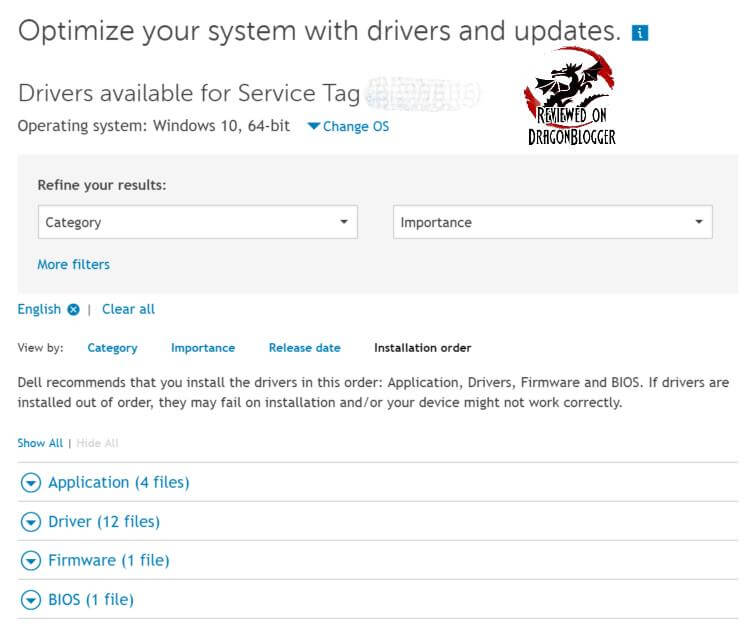
On this site you would enter your service tag number. Mind you, I have shown you pics all of the notebooks and no where did you see, nor did I see the service tag number. After doing a little digging I found a notch on the back of the unit on the XPS sticker
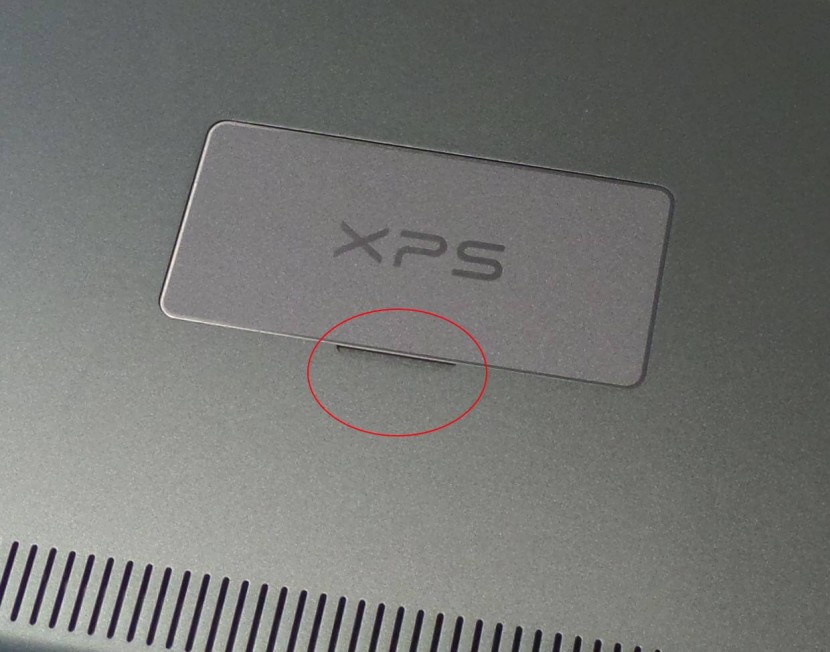
Here you would use your finger nail or a credit card to flip open the panel and you will find the Service tag number.
Once you find the service tag number, go to Dell’s site, click on the support link, enter your service tag number and you can find the drivers, software and BIOS updates for your notebook. Notice I didn’t say the notebook model, I said your notebook because that Service tag number points to your specific build.
One other very important thing is the fact that they give you information on installation order. The order in which you install drivers and software is very important because one driver could overwrite a portion of another driver impacting performance and overall function of that piece of software.
Aside from all of the software and BIOS’ updates the support site give you, you can also find a lot more. You can find Troubleshooting steps in case you run into issues, Support topics and articles, Diagnostics, General Maintenance tips, Parts & Accessories in case you want more and more information, they try to make it a one stop shop and they did a good job.
With all this information and performance, what do you think? Well, let’s go over to Final Thoughts.
Continue: Closing and Final thoughts
[nextpage title=”Closing and Final thoughts”]
I have used tons of Notebooks in my life, a few Ultrabooks as well and they all seem to lack one thing, true quality. Just opening up this box, I felt true quality. The laptop feels nice and sturdy with its aluminum and panels, the display is almost indestructible with its Gorilla glass. The keyboard I like with its backlit chiclet keys, though the camera while good seemed a little odd with its placement, even though there was a good reason being that it aids in keeping the Ultrabook thin.
One downside is the graphics, only being Intel HD 520 but it is understandable being that it has such an amazing battery life, I can’t give it a negative for that. It does not advertise to be a gaming notebook, so it is not a mark against it and it does not feel like an Ultrabook because of how sturdy it is. I have always felt Ultrabooks to be flimsy and very delicate; this guy can take some abuse, though I don’t recommend to abuse it, notebooks are people too, well not really but kind of. The sturdiness might be its weight, though it is still very lite coming in at 2.7lbs.
Pros
- Thin and Lite
- Ridiculously long battery life
- Made with amazing materials: Aluminum, Carbon Fiber, Gorilla Glass
- Touchscreen
- Amazingly high resolution: 3200 x 1800
- Very high brightness/nits 400
- Chiclet and backlit keys
- Nice port assortment: 2 x USB 3.0/3.1, Thunderbolt 3, SD Card slot, Power Gauge, 3.5mm headphone jack
- Large and fast 1TB PCI-E SSD
- Fast 16GB LPDDR3 1866MHz RAM
Cons
- No dedicated video card
- Battery is built into the unit, not easily replaceable.
While the battery is not easily replaceable due to it unibody design, a quick google/youtube search will show you how to do it to save some money, though this will void your warranty if it is still in its warranty period. As I mentioned before, even though there is no dedicated high end video card, this is not meant to be a gaming machine, but as you saw it can play anything though you might have to turn down the eye candy and being that it’s a 13.3 inch display, you don’t need to bump the res too high.
After all of my testing, I am without any regrets giving this ultra-portable laptop 5 out of 5, highly recommended to buy and Editors Choice. It really is a great laptop and does nothing but strengthen the XPS line Dell has created. It’s also safe to say that it has destroyed those Ultrabook Specifications set by Intel and because of that it can be called an Ultra-Notebook. Great job Dell.

One question I leave you with… Apple who?
Back to: Intro
We are influencers and brand affiliates. This post contains affiliate links, most which go to Amazon and are Geo-Affiliate links to nearest Amazon store.
I have spent many years in the PC boutique name space as Product Development Engineer for Alienware and later Dell through Alienware’s acquisition and finally Velocity Micro. During these years I spent my time developing new configurations, products and technologies with companies such as AMD, Asus, Intel, Microsoft, NVIDIA and more. The Arts, Gaming, New & Old technologies drive my interests and passion. Now as my day job, I am an IT Manager but doing reviews on my time and my dime.