
We are influencers and brand affiliates. This post contains affiliate links, most which go to Amazon and are Geo-Affiliate links to nearest Amazon store.
It seems that every other day a newer bigger and better video card comes out, and needless to say we all want that card. Just yesterday (a little bit ago), we reviewed the Sapphire PULSE Radeon RX 5700 and we fell in love with it, but what if I were to tell you there’s more? Well there is, today we will be reviewing the daddy of the 5700 series, the Sapphire Nitro+ Radeon RX 5700 XT 8GB OC Card, get ready.
Let’s see all of the specs and features this card provides.
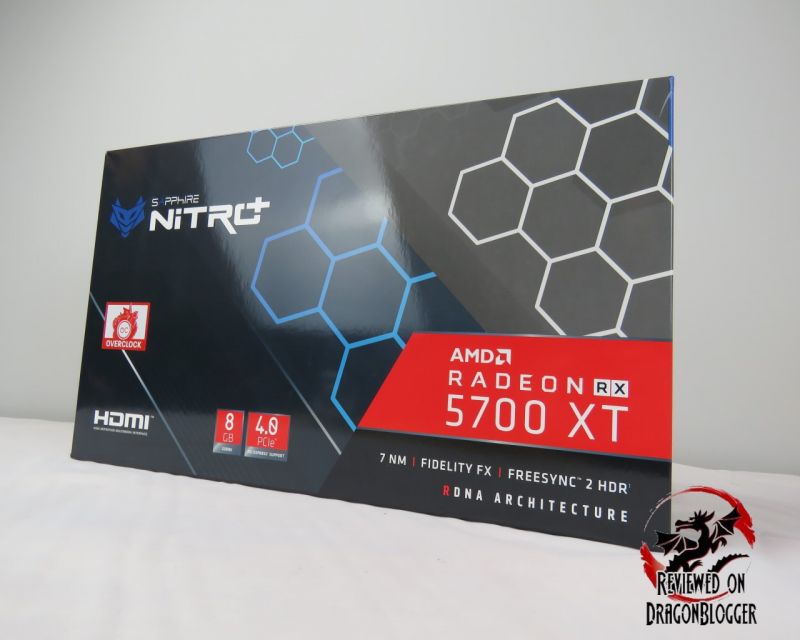
- Based off of AMD’s 2nd Gen 7nm process RDNA architecture
- 1540Mhz Base clock
- Boost Clock of Up to 2010Mhz
- 1905Mhz Game Clock
- Robust VRM Cooling
- 8Gigs of 256Bit GDDR6 RAM
- 14 Gbps Effective Memory clock speed
- 2,560 Stream processors
- Dual UEFI BIOS Support
- Tri-X cooling Technology
- Fuse Protection External Fuse built into the circuit of the external PCI-e connectors
- Quick Connect Fans
- Two Ball Bearings
- Requires 2.5 slots
- Dimension: 306x 135 x 49 (mm)
- 1 x HDMI
- HDMI @ 4096×2160@60Hz
- 3 x Display Port 1.4 HBR3 w/DSC (lossless encoding)
- Max of 4 concurrent displays
- DisplayPort 1.4 5120×2880@60Hz
- Supported Features
- TriXX Boost
- Radeon Boost
- AMD Compute
- Nitro Glow
- Optional Fan Glow ARGB Support
- Fan Check
- Software BIOS Switch
- PCI Express 4.0
- Streaming up to 8K
- Asynchronous Compute
- Radeon Rays Audio and True Audio Next
- Radeon Image Sharpening
- Fidelity FX
- Radeon Freesync 2 HDR
- Radeon VR Ready Premium
- Radeon boost
- Updated TriXX Boost feature to get maximum performance
- Dual BIOS’
- Fuse Protection
- DirectX 12 Optimized
- HDR Ready
- Radeon Relive
- Requires a minimum of 600Watts, recommended 650
- Requires 2 x 8-Pin PCI Connectors
- Max of 4 concurrent displays
Hopefully I didn’t lose you guys on that, I know there were a ton of specs but it’s worth it, I promise. OK, so let’s move on to the unboxing so we can see what comes in the box. I like to do simple unboxings because sometimes we just buy these things and we don’t know what comes in the box. There’s nothing worse than opening the box and getting all excited to install it, but you are missing something or worse, somethings. This just get’s you prepared.
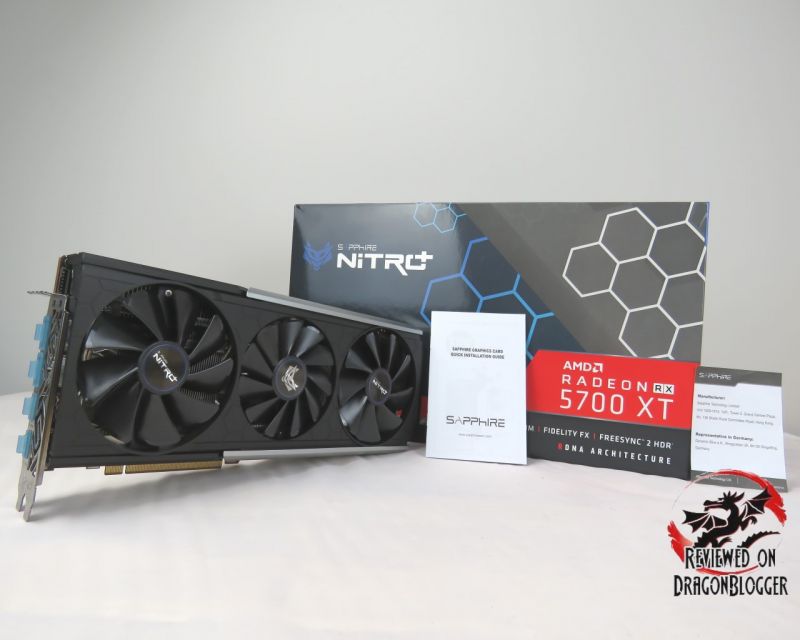
OK, working our way to the video card, let’s start with the documents.
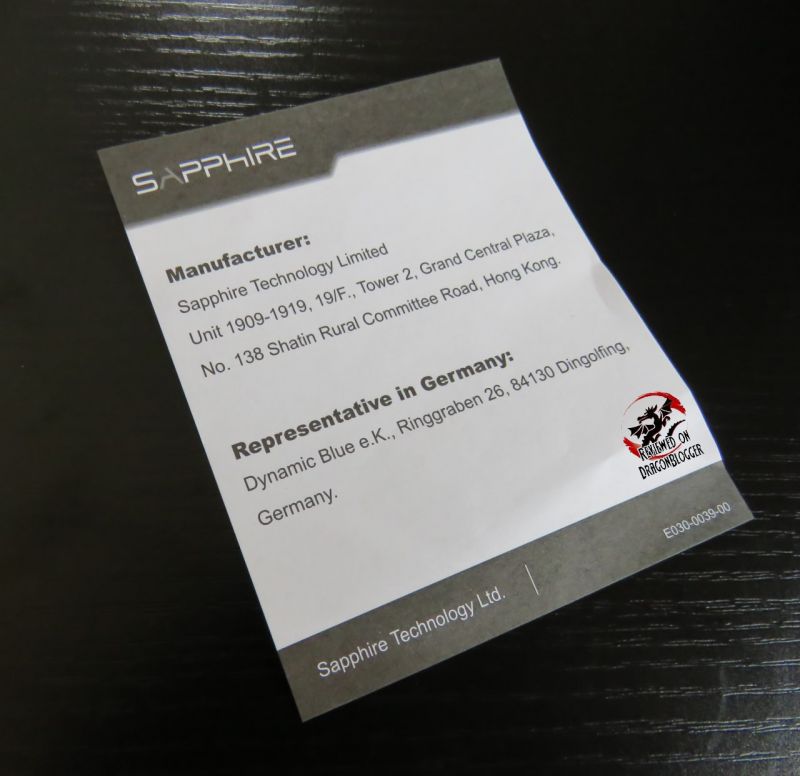
The first sheet, we find is the manufacture sheet needed for when purchased in Germany.
Next up, and the final extra in the box, the Quick Installation Guide. This is a very quick and generic document on how to install Sapphire Nitro+ RX 5700 XT OC into your system. I will provide a video showing a little later in this review on how to install the card into your system, so this document is not really need. We got you covered on Dragonblogger.
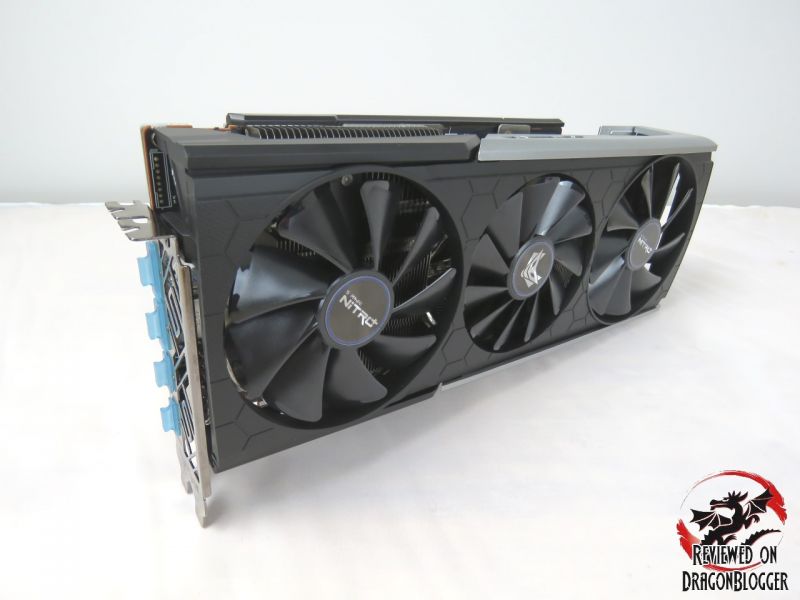
That’s it, after the documents, we have the video card. So now that we are down to the video card, let’s jump onto the next page, A close look at the card.
Continue on to: A Close look at the card
[nextpage title=”A Close look at the card”]
This card is a little wider than most, the fan housing makes it a little wider helping to keep the card cooler than other variants. The card is also a little longer, sporting 3 fans.

The card measures 12 inches in length

and almost 5 inches in width.

About 2.4 inches in depth. With the fan housing, the card will require about 2.5 PCI-e slots even though it only takes 1 physical PCI-e slot, make sure you have some room in your system.

The card includes full sized 2 x Display ports at a 1.4 specification and full sized 2 x HDMI ports. The HDMI ports provide resolutions to up to 4096 x 2160, the Display Ports provide resolutions of up to 5120 x 2880. Since you already know there are no adapters included in the box, make sure your monitor utilizes these ports. There are a ton of adapters you could get if you needed for example a DVI port to HDMI Click here to find it on Amazon, that are very affordable.

Laying the card down on its side exposes the a large heatsink, spanning across the length of the card. The other important piece is that it reveals the 2 x 8PCI-e power connections. Also, along this side, a few RGB elements, some of which we can’t see just yet, but we will soon.

Towards the I/O side of the card, where you plug in your monitors, we find the BIOS Select switch. The card supports dual BIOS but in three position. The default position, one closest to the IO is software controlled via TRIXX and not a BIOS by itself. The middle slot is for quiet operation, which means lower performance and lower voltages and the switch toward the power connectors is for performance which reasonably means it utilizes the cards full potential. Since right now, TRIXX is not 100% operational where you can overclock, the benchmarking and gaming portion of this review are run on the performance setting of the card,… I think everyone will keep it on that side too.
This BIOS switch, is a bit different than other BIOS switches, where you can save your overclocked or modified BIOS’ to, so I wanted to make sure to point that out.

In the center of the card, along the side, we find the SAPPHIRE logo, which hides some treats for us a little later in this review.

Along the rear of the card, we find the end of the heatsink, along with the terminated ends of the heatpipes, but we also find another connector.

Here we find the ARGB header. Unlike I thought originally, this does not allow you to connect an ARGB fan and have it controlled off of the card, this is to allows the card to connect to an ARGB controller on the motherboard so that you can sync the RGB on the card with your other devices using for example Asus Aura, Gigabyte RGB Fusion, MSI Mystic Light, AsRock RGB Sync or what ever other RGB software you may have. That is actually a great idea.

Next to the ARGB header, we find a SAPPHIRE NITRO+ logo.

The SAPPHIRE NITRO+ logo here has a LED backing.

We also find the GPU retention mechanism, helping to hold the heatsink firmly over the GPU.

Here we can see the entire card lit up inside of a system. How’d we get it in there though? In this next page we will go over Installing the Sapphire Radeon Nitro+ RX 5700 XT OC 8GB Card.
Continue on to: Sapphire Radeon Nitro+ RX 5700 XT OC 8GB Card
[nextpage title=”Sapphire Radeon Nitro+ RX 5700 XT OC 8GB Card”]
This page would be more for those of us that don’t know how to install a video card. The method itself is basically universal, every card potentially with its own caveat, but if you are already familiar, who knows you still might learn something out of it. This video also does not only show you how to install a new card, but it also shows you how to remove your old card without damaging it or your motherboard, just in case. Remember, all of us at some point did not know how to remove or install card.
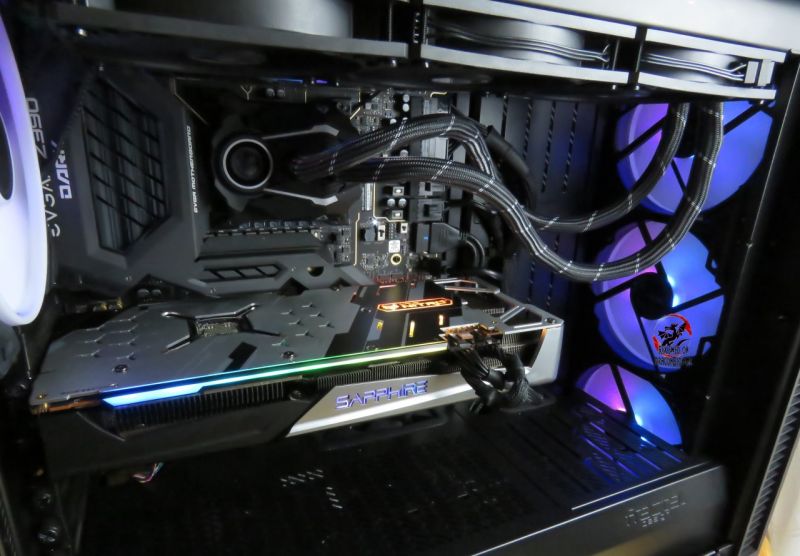
Like you saw in the video, this is the card installed with the system on. The process itself is pretty easy, but if you have never done before can be daunting, hopefully I helped you out. In that video I not only show you how to do all that, but I show you how to remove your older drivers using Wagnardsoft’s DDU and then how to install your newer ones.
On the next page, we will go over the benchmarks, performance, temperatures and power consumption.
Continue on to: Benchmarks, Performance, Temperatures and Power consumption
[nextpage title=”Benchmarks, Performance, Temperatures and Power consumption”]A video card does not work on its own, aside from drivers and all, we need the rest of the system. So that you know what I am working with and to compare performance with your own system, here are my system specifications.
- Windows 10 Professional: https://geni.us/TbOpq
- Viotek G35DR 35” Ultra Wide Curved Monitor: http://geni.us/6LrGJ
- ASUS PB287Q 28″ 4K LED Monitor: https://geni.us/LeWBsp
- Sapphire Nitro+ RX 5700 XT OC 8GB: https://geni.us/VoHIZhu
- Fractal Design Define S2 Vision RGB Case: https://geni.us/t6xXT
- Alienware Wireless Gaming Headset – AW988: https://geni.us/z52uzC
- Arctic Liquid Freezer II 360: https://geni.us/iAqV
- Intel Core i9 9900K Processor: https://geni.us/0PrCbaY
- Patriot Viper Gaming RGB DDR4 DRAM 3200MHz 16GB Kit: https://geni.us/URlI8
- EVGA Z390 Dark Motherboard: https://geni.us/UmV6t
- WD Black SN750 1TB: https://geni.us/8sqXFs
- Samsung 850 EVO 500GB SSD: https://geni.us/QTA2
- WD Black PCI-e NVMe 512GB SSD: https://geni.us/mMNLde
- EVGA SuperNOVA 1000 G+, 80 Plus Gold 1000W: https://geni.us/IVoE
Here are the specs on the Sapphire Radeon Nitro+ RX 5700 XT OC.
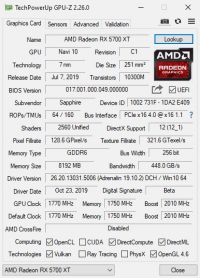
I use GPU-Z to gather temperatures of the card, but I use a Kill A Watt for reporting the wattage consumed. The Kill A Watt by P3 International is great, you can click on this link to check it out on my Amazon affiliated link and maybe get yourself one too.

I have changed up some of the games and programs I have used with more demanding and newer titles. Here is the list of games and programs used for benchmarking.
- FutureMark’s 3DMark Fire Strike
- FutureMark’s TimeSpy
- Metro Exodus
- Assassin’s Creed Odyssey
- Shadows of the Tomb Raider
- Far Cry 5
- Tom Clancy’s Ghost Recon Wildlands
Alright, let’s get started.

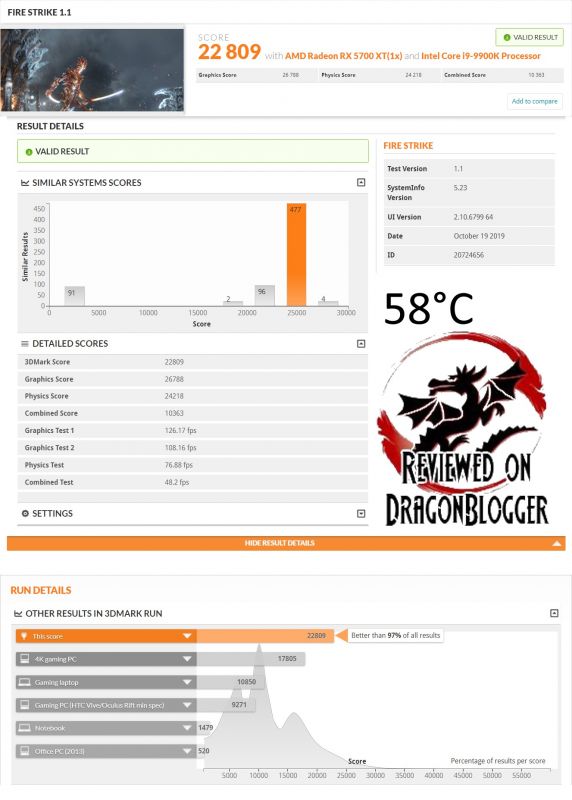
The overall score on UL’s 3DMark FireStrike 1.1 was 22,809 and the hottest the card reached was 58°C. During these tests, the maximum power consumed was 423Watts, while the average was 335Watts. The Sapphire states that the card requires a 600Watt power supply, though they recommend a 650Watt. So far it using more power than I would have expected, though not close to that 600Watts, but if they recommend that, it probably is for a good reason, so let’s move on.
The card scored an impressive 97% better than all other results on UL’s results. Moving on to DX12, we have UL’s TimeSpy.

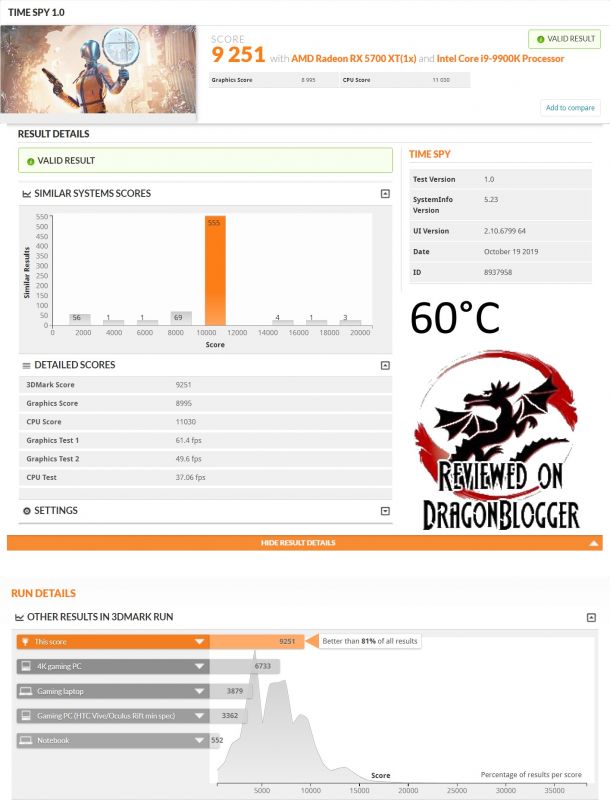
We can see in TimeSpy, the results are better than 81% of all other results. The overall score was 9,251 and the card heated up to 60°C while consuming 360Watts at max, and averaging at 343 Watts. While these are in fact non-playable benchmarks, they do give us an understanding on the performance we can expect. Now that we are done with the synthetic benchmarks, let’s jump into some actual gaming benchmarks. We will start off with Metro Exodus by our friends over at Deep Silver.

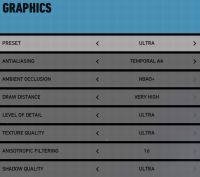
Throughout these benchmarks, I keep the settings the same, changing only the resolutions. For example, I selected here “Ultra”, and throughout the test I changed the resolution only from 1920 x 1080 to 2560 x 1440 to 3840 x 2160.
Here are the results from all 3 presets below
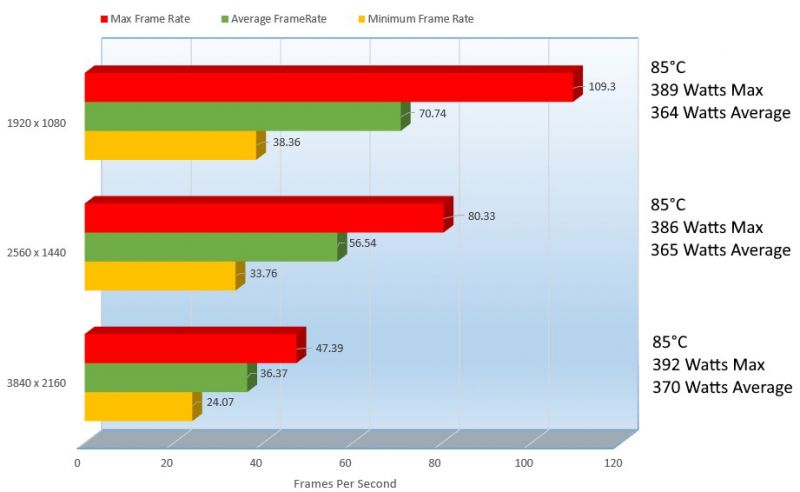
At 3840×2160, Metro Exodus is unplayable at the Ultra preset. It came in at 36.37 FPS, consuming an average of 370 Watts heating up the card to 85°C. At 2560×1440, the game became almost totally playable at 56.54 FPS, taking up 365 Watts on average and keeping the PC toasty at 85°C. At 1920×1080, the game was buttery smooth at 70.74 fps consuming 364Watts and keeping up the heat at 85°C.
While not 60FPS, it did a decent job at 2K, most might not even notice during play that it was not totally smooth. To easily hit that 60, you would need to drop the eye candy, as we saw on 1920×1080 but only a little. We may have a solution to that a little later in this review, a very handy idea Sapphire had on taking care of this for us.
So, let’s jump over and see what Laura has for us in Shadow of the Tomb Raider.

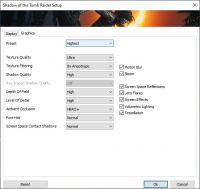
Again here, I keep the settings the same, changing only the resolutions.
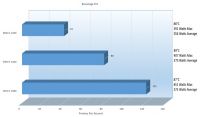
Laura as usual, took things a little more lightly than Metro.
At 3840 x 2160 we could only muster up an average of 41FPS, drawing an impressive 356 Watts on average and toasting up the card to 88°C. At 2560 x 1440, things were smooth at 80 frames though still a bit toasty at 89°C and consuming on average 373 Watts, that 4.78% more consumed than at 4K but that was a 95.12% improvement. At 1920 x 1080, the frame rate increased 51.25% at 121 FPS and the temperature dropped 2° at 87°C but still took up 375 Watts on average.
Laura today would look through the ruins of yesterday to discover yesterday’s artifacts, so let’s go back to yesterday and see how things look and run on Assassins Creed Odyssey.

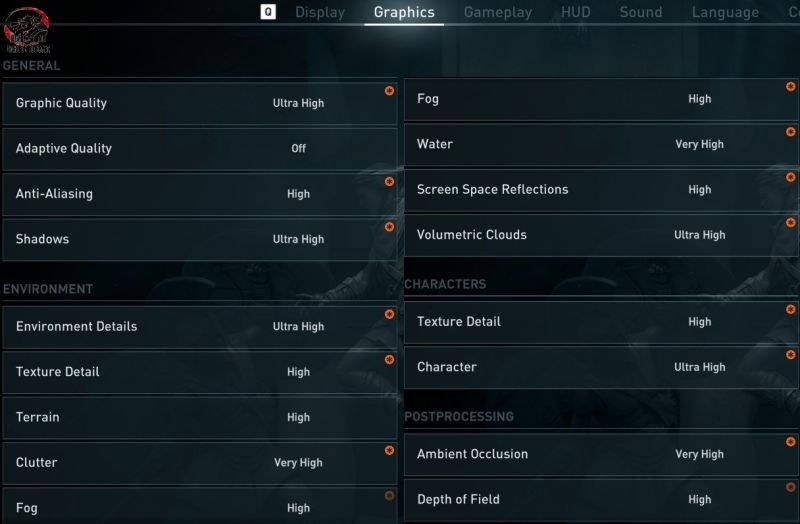
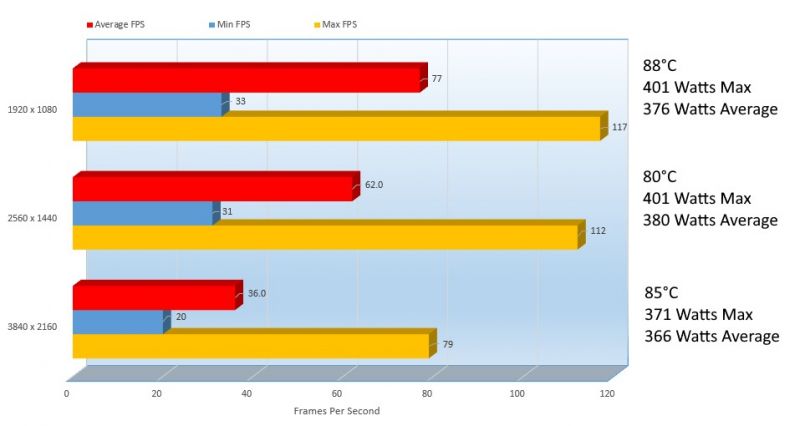
On Assassins Creed Odyssey at 3840 x 2160 we were presented with a slide show at 36 FPS, drawing 366 Watts on average and keeping things warm at 85°C. At 2560 x 1440, performance rose 53.06% to 62 frames per second. The card dropped 5° coming down to 80°C and consuming 380 Watts on average, 6.06% more power than at 4K. At 1920 x 1080, the frame rate increased 21.58% over the 2K benches coming in at 77 FPS at 88°C, consuming 376 Watts on average.
Coming back to today, but going down to the south. Let’s see how Far Cry 5 performs.

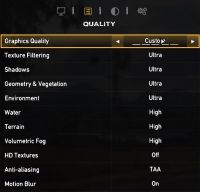
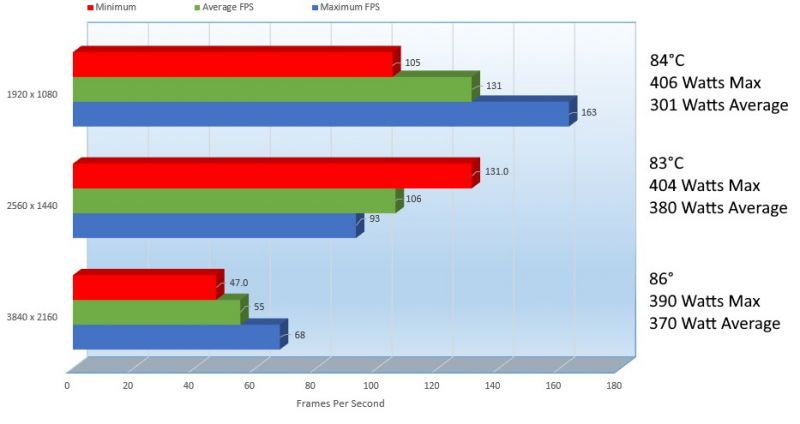
Far Cry 5 did a bit better than I thought it would. At 4K, we reached and an average and incredibly playable 55 FPS at a toasty 86°C at 370 Watts on average. At 2560 x 1440, the card reached 106 frames per second, 63.35% better than at 4K while coming in 3° cooler at 83°C consuming on average 380 Watts.
At 1920 x 1080, this card hit 131 frames per second, 21.097% faster than at 2K and 301 Watts on average hitting 82°C. These scores impressed me a bit.
Let’s see how Tom Clancy’s Ghost Recon Wildlands performs.

Tom Clancy’s Ghost Recon Wild Lands as usual didn’t fare so well at 4K, reaching only 34.47 frames per second and hitting 86°C consuming on average 376Watts. 2K did much better improving the frame rate by 53.83% coming in at 59.86 FPS, taking up 375 Watts on average and hitting 85°C. At 1080P, the frame rate jumped 20.93% coming in at 73.86 cooling down 3° at 82°C and consuming 362 Watts on average.
While at 2K, we came in at 59.86 FPS. It might have well as been 60FPS, because it was totally smooth. So this makes Wild Lands playable at 2K and 1080P with all the eye candy on.
While the XT has been touted to be Sapphires fastest at the moment, it is a few dollars more than its little brother the Pulse 5700, but how much faster could it be right? Well let’s compare the 2 in our next page, Benchmark Comparisons.
Continue on to: Comparing Performance
[nextpage title=”Comparing Performance”]
We know that the 5700 series has been a great series for AMD, but what does it mean for Sapphire and it’s variant’s. Let’s do some comparison running some of the benchmarks we have already run.
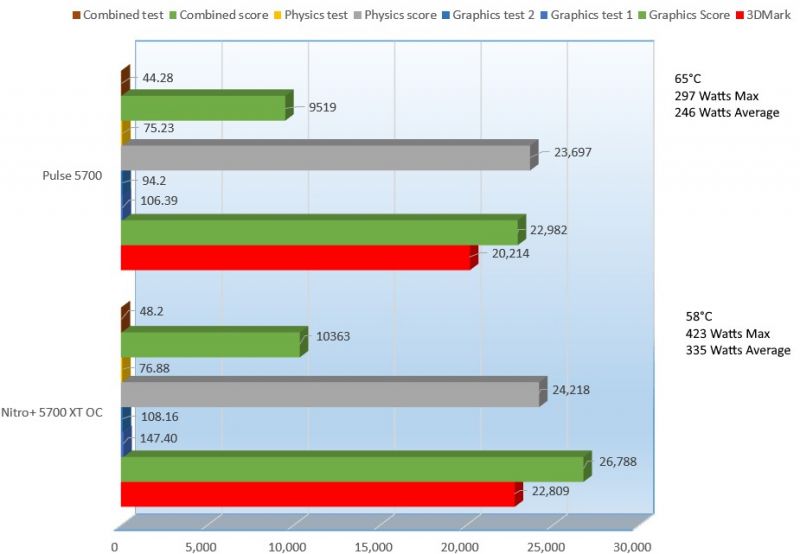
Rather than go through the entire story here on 3DMark, lots of individual scores, the main score is usually people refer to when taking about 3DMark score. We can see the 5700 XT scored an impressive 22,809 while the Pulse 5700 scored 20,214 a 12.06% improvement. The Nitro+ 5700 XT OC card was also 7°C cooler but consumed on average 89 Watts more.
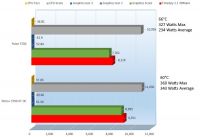
Again, we are reminded at the power of the 5700XT. We can see on the overall TimeSpy 1.1 score, there was a 13.07% improvement over the Pulse 5700. The Nitro+ 5700XT OC was 6° cooler than the Pulse 5700 though consumed 109Watts more on average. It makes sense that it would consume more, but shows how much better the cooling was on the Nitro+ over the Pulse.
What kind of improvement can we expect on Metro Exodus.
1920 x 1080
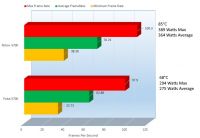
At 1920 x 1080, resolution most gamers play at, we can see the Nitro+ 5700 XT performed on average 11.76% better reaching 70.74 frames per second. With that performance though, comes the trade off, the Nitro+ also came in at 27.86% higher than the Pulse from 275 Watts to 364 Watts respectively. To continue with that trend, the temperature on the Nitro+ was also 22.22% higher from 68°C to 85°C. With great performance comes great temperature. Let’s see what goes on at 2560 x 1440.
2560 x 1440
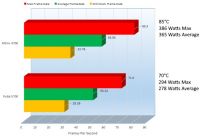
Metro is brutal, between the 2 cards, there is only a 11.8% increase in performance. With that, a 15° difference and a 27.06% increase in the average power consumed.
11.8% is not huge, but 56FPS is a lot more playable and closer to 60FPS than 50.24. Let’s check out 4K.
3840 x 2160
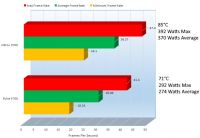
4K, is rough on its own and to add to that, it’s 4K on Metro Exodus. We can see here on average, the performance increased by 19.23% which is great, but being that the base average was 29.99FPS, don’t expect too much here. With the improvement, the temperature raised from 71° to 85° at a 17.95% increase, with that the average power consumption great to 370Watts on average, a 29.81% increase. A bit painful no mater how you look at it.
OK, let’s see what Shadows of the Tomb Raider performs like.
1920 x 1080
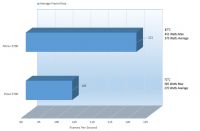
On Shadows of the Tomb Raider, can see performance has improved by 16.07% on the Nitro+ 5700. Overkill of course at this resolution, but is there really such thing as overkill on an average… really?
With that bump in performance, we see a 32% increase in average power consumed and an increase in thermals, spiking up to 87°C, that’s a 18.87% increase. I think it’s worth it, but that’s just me what do you think?
2560 x 1080
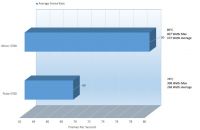
At 2560 x 1080, the trend continues with the Nitro+ coming in at 80FPS, a 18.40% increase over the Pulse 5700’s 69FPS. When you perform, you heat up, so we see the Nitro+ heated up to 89°C while the Pulse stayed at a cooler 74°C. The Average Wattage consumed on the Nitro+ was almost doubles the Pulse’s at 373Watts, 32.76% more power taken, that’s a bit hit. Do you think it’s worth it?
3840 x 2160
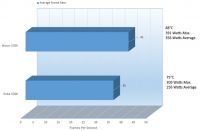
There is not much to say on this one, they kind of both failed but still the Nitro+ chugged up ahead at 41FPs, up 15.79% above the Pulse’s 35FPS. The heat this time was still hotter, but a little less hot at 32.68% but consumed 50% more power at 356Watts.
Not too impressed here, while the performance was higher on the Nitro+, I don’t know if I could justify the cost difference but that is yet to be seen. So let’s go over to
1920 x 1080
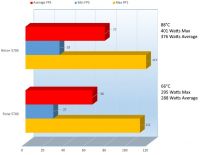
Killing it yet again, the Nitro+ 5700 trucks ahead at 77 frames per second, 16.90% faster than the Pulse 5700. With that though, we can see the Nitro+ consumed 30.46% more power than the Pulse did and came in 28.57% hotter.
2560 x 1080
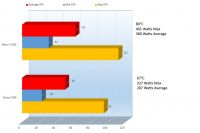
We are seeing one of the biggest gains on performance here, with the Nitro+ 5700 coming in at a 21% performance gain over the Pulse. With that gain however we can see the Nitro+ 5700 is drawing 27.89% more power and generating 17.69% more heat than the Pulse. I am hoping this means some great things for 4K?
3840 x 2160
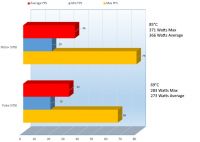
The Nitro+ 5700 tried its hardest but could not reach that 4K award. It scored slightly above its lower end counterpart, by 11.76%, that’s only 4 FPS from 32FPS to 36FPS. That tiny bump though heated up the card by 20.79% over the Pulse and consumed 29.11% more on average.
Would we see a higher performance increase out of the Nitro+ on FarCry 5?
1920 x 1080
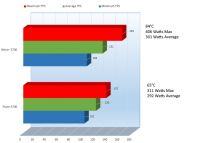
Well, a little surprising here, while the performance was higher, by an impressive 25.50% but the average power consumed was only 3.04% higher. It did heat up a little more, from 65°C on the Pulse to 84°C on the Nitro.
2560 x 1440
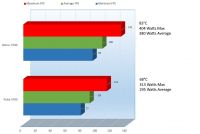
We have yet another decent performance improvement, 17.44% on the Nitro+ over the Pulse, but the very high temperature and wattage continue. The Nitro+ was 19.87% hotter and consumed 25.19% more power on average than the Pulse.
3840 x 2160
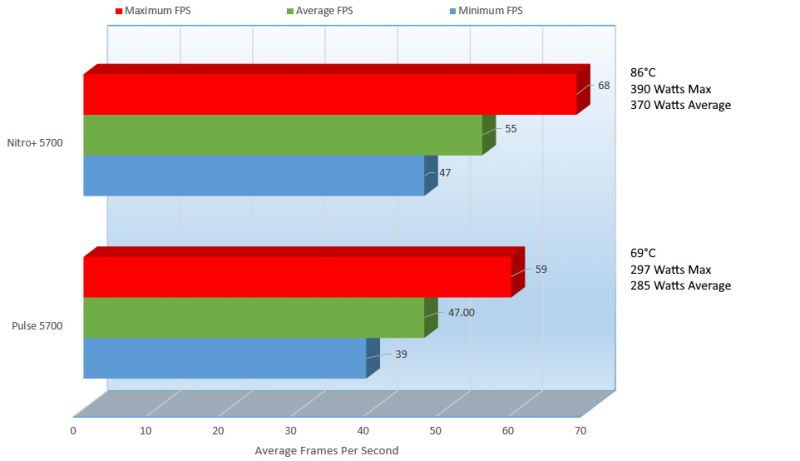
Here, the Nitro+ got so close to 60FPS, but it feel just shy. Still playable at 55FPS but still not 60FPS. The Pulse here struggle but it strayed behind at 47, still not too bad for the more budgeted version, but XT once again takes the lead. Let’s see what Tom can do here.
1920 x 1080
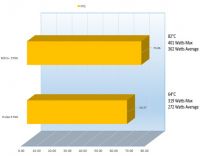
I apologize on this one, I was not able to capture the minimum and maximum frames per second on the Pulse. I recorded them incorrectly on it’s review, (click here for the review of the Sapphire PULSE Radeon RX 5700 8GB OC) so I do not want to include them for the Nitro+ on this comparison. If I am able to obtain the Pulse again, I will update my scores though they did not impact the final results, even though minimum is a bit important.
Here, we can see once again the Nitro